Water vapor
| Water vapor (H2O) | |
|---|---|
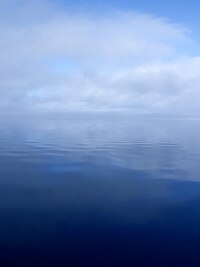 Invisible water vapor condenses to form
visible clouds of liquid rain droplets | |
| Liquid state | Water |
| Solid state | Ice |
| Properties[1] | |
| Molecular formula | H2O |
| Molar mass | 18.01528(33) g/mol |
| Melting point | 0.00 °C (273.15 K)[2] |
| Boiling point | 99.98 °C (373.13 K)[2] |
| specific gas constant | 461.5 J/(kg·K) |
| Heat of vaporization | 2.27 MJ/kg |
| Heat capacity at 300 K | 1.864 kJ/(kg·K)[3] |
Water vapor, water vapour or aqueous vapor is the gaseous phase of water. It is one state of water within the hydrosphere. Water vapor can be produced from the evaporation or boiling of liquid water or from the sublimation of ice. Water vapor is transparent, like most constituents of the atmosphere.[4] Under typical atmospheric conditions, water vapor is continuously generated by evaporation and removed by condensation. It is less dense than most of the other constituents of air and triggers convection currents that can lead to clouds.
Being a component of Earth's hydrosphere and hydrologic cycle, it is particularly abundant in Earth's atmosphere, where it acts as a greenhouse gas and warming feedback, contributing more to total greenhouse effect than non-condensable gases such as carbon dioxide and methane. Use of water vapor, as steam, has been important for cooking, and as a major component in energy production and transport systems since the industrial revolution.
Water vapor is a relatively common atmospheric constituent, present even in the solar atmosphere as well as every planet in the Solar System and many astronomical objects including natural satellites, comets and even large asteroids. Likewise the detection of extrasolar water vapor would indicate a similar distribution in other planetary systems. Water vapor is significant in that it can be indirect evidence supporting the presence of extraterrestrial liquid water in the case of some planetary mass objects.
Properties[]
Evaporation[]
Whenever a water molecule leaves a surface and diffuses into a surrounding gas, it is said to have evaporated. Each individual water molecule which transitions between a more associated (liquid) and a less associated (vapor/gas) state does so through the absorption or release of kinetic energy. The aggregate measurement of this kinetic energy transfer is defined as thermal energy and occurs only when there is differential in the temperature of the water molecules. Liquid water that becomes water vapor takes a parcel of heat with it, in a process called evaporative cooling.[5] The amount of water vapor in the air determines how frequently molecules will return to the surface. When a net evaporation occurs, the body of water will undergo a net cooling directly related to the loss of water.
In the US, the National Weather Service measures the actual rate of evaporation from a standardized "pan" open water surface outdoors, at various locations nationwide. Others do likewise around the world. The US data is collected and compiled into an annual evaporation map.[6] The measurements range from under 30 to over 120 inches per year. Formulas can be used for calculating the rate of evaporation from a water surface such as a swimming pool.[7][8] In some countries, the evaporation rate far exceeds the precipitation rate.
Evaporative cooling is restricted by atmospheric conditions. Humidity is the amount of water vapor in the air. The vapor content of air is measured with devices known as hygrometers. The measurements are usually expressed as specific humidity or percent relative humidity. The temperatures of the atmosphere and the water surface determine the equilibrium vapor pressure; 100% relative humidity occurs when the partial pressure of water vapor is equal to the equilibrium vapor pressure. This condition is often referred to as complete saturation. Humidity ranges from 0 gram per cubic metre in dry air to 30 grams per cubic metre (0.03 ounce per cubic foot) when the vapor is saturated at 30 °C.[9]


Sublimation[]
Sublimation is the process by which water molecules directly leave the surface of ice without first becoming liquid water. Sublimation accounts for the slow mid-winter disappearance of ice and snow at temperatures too low to cause melting. Antarctica shows this effect to a unique degree because it is by far the continent with the lowest rate of precipitation on Earth. As a result, there are large areas where millennial layers of snow have sublimed, leaving behind whatever non-volatile materials they had contained. This is extremely valuable to certain scientific disciplines, a dramatic example being the collection of meteorites that are left exposed in unparalleled numbers and excellent states of preservation.
Sublimation is important in the preparation of certain classes of biological specimens for scanning electron microscopy. Typically the specimens are prepared by cryofixation and freeze-fracture, after which the broken surface is freeze-etched, being eroded by exposure to vacuum till it shows the required level of detail. This technique can display protein molecules, organelle structures and lipid bilayers with very low degrees of distortion.
Condensation[]

Water vapor will only condense onto another surface when that surface is cooler than the dew point temperature, or when the water vapor equilibrium in air has been exceeded. When water vapor condenses onto a surface, a net warming occurs on that surface.[10] The water molecule brings heat energy with it. In turn, the temperature of the atmosphere drops slightly.[11] In the atmosphere, condensation produces clouds, fog and precipitation (usually only when facilitated by cloud condensation nuclei). The dew point of an air parcel is the temperature to which it must cool before water vapor in the air begins to condense. Condensation in the atmosphere forms cloud droplets.
Also, a net condensation of water vapor occurs on surfaces when the temperature of the surface is at or below the dew point temperature of the atmosphere. Deposition is a phase transition separate from condensation which leads to the direct formation of ice from water vapor. Frost and snow are examples of deposition.
There are several mechanisms of cooling by which condensation occurs: 1) Direct loss of heat by conduction or radiation. 2) Cooling from the drop in air pressure which occurs with uplift of air, also known as adiabatic cooling. Air can be lifted by mountains, which deflect the air upward, by convection, and by cold and warm fronts. 3) Advective cooling - cooling due to horizontal movement of air.
Chemical reactions[]
A number of chemical reactions have water as a product. If the reactions take place at temperatures higher than the dew point of the surrounding air the water will be formed as vapor and increase the local humidity, if below the dew point local condensation will occur. Typical reactions that result in water formation are the burning of hydrogen or hydrocarbons in air or other oxygen containing gas mixtures, or as a result of reactions with oxidizers.
In a similar fashion other chemical or physical reactions can take place in the presence of water vapor resulting in new chemicals forming such as rust on iron or steel, polymerization occurring (certain polyurethane foams and cyanoacrylate glues cure with exposure to atmospheric humidity) or forms changing such as where anhydrous chemicals may absorb enough vapor to form a crystalline structure or alter an existing one, sometimes resulting in characteristic color changes that can be used for measurement.
Measurement[]
Measuring the quantity of water vapor in a medium can be done directly or remotely with varying degrees of accuracy. Remote methods such electromagnetic absorption are possible from satellites above planetary atmospheres. Direct methods may use electronic transducers, moistened thermometers or hygroscopic materials measuring changes in physical properties or dimensions.
| medium | temperature range (degC) | measurement uncertainty | typical measurement frequency | system cost | notes | |
|---|---|---|---|---|---|---|
| Sling psychrometer | air | −10 to 50 | low to moderate | hourly | low | |
| Satellite-based spectroscopy | air | −80 to 60 | low | very high | ||
| Capacitive sensor | air/gases | −40 to 50 | moderate | 2 to 0.05 Hz | medium | prone to becoming saturated/contaminated over time |
| Warmed capacitive sensor | air/gases | −15 to 50 | moderate to low | 2 to 0.05 Hz (temp dependant) | medium to high | prone to becoming saturated/contaminated over time |
| Resistive sensor | air/gases | −10 to 50 | moderate | 60 seconds | medium | prone to contamination |
| Lithium chloride dewcell | air | −30 to 50 | moderate | continuous | medium | see dewcell |
| Cobalt(II) chloride | air/gases | 0 to 50 | high | 5 minutes | very low | often used in Humidity indicator card |
| Absorption spectroscopy | air/gases | moderate | high | |||
| Aluminum oxide | air/gases | moderate | medium | see Moisture analysis | ||
| Silicon oxide | air/gases | moderate | medium | see Moisture analysis | ||
| Piezoelectric sorption | air/gases | moderate | medium | see Moisture analysis | ||
| Electrolytic | air/gases | moderate | medium | see Moisture analysis | ||
| Hair tension | air | 0 to 40 | high | continuous | low to medium | Affected by temperature. Adversely affected by prolonged high concentrations |
| Nephelometer | air/other gases | low | very high | |||
| Goldbeater's skin (Cow Peritoneum) | air | −20 to 30 | moderate (with corrections) | slow, slower at lower temperatures | low | ref:WMO Guide to Meteorological Instruments and Methods of Observation No. 8 2006, (pages 1.12–1) |
| Lyman-alpha | high frequency | high | http://amsglossary.allenpress.com/glossary/search?id=lyman-alpha-hygrometer1 Requires frequent calibration | |||
| Gravimetric Hygrometer | very low | very high | often called primary source, national independent standards developed in US,UK,EU & Japan | |||
| medium | temperature range (degC) | measurement uncertainty | typical measurement frequency | system cost | notes |
Impact on air density[]
Water vapor is lighter or less dense than dry air.[12][13] At equivalent temperatures it is buoyant with respect to dry air, whereby the density of dry air at standard temperature and pressure (273.15 K, 101.325 kPa) is 1.27 g/L and water vapor at standard temperature has a vapor pressure of 0.6 kPa and the much lower density of 0.0048 g/L.
Calculations[]
Water vapor and dry air density calculations at 0 °C:
- The molar mass of water is 18.02 g/mol, as calculated from the sum of the atomic masses of its constituent atoms.
- The average molar mass of air (approx. 78% nitrogen, N2; 21% oxygen, O2; 1% other gases) is 28.57 g/mol at standard temperature and pressure (STP).
- Obeying Avogadro's Law and the ideal gas law, moist air will have a lower density than dry air. At max. saturation (i. e. rel. humidity = 100% at 0 °C) the density will go down to 28.51 g/mol.
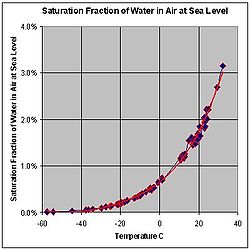
- STP conditions imply a temperature of 0 °C, at which the ability of water to become vapor is very restricted. Its concentration in air is very low at 0 °C. The red line on the chart to the right is the maximum concentration of water vapor expected for a given temperature. The water vapor concentration increases significantly as the temperature rises, approaching 100% (steam, pure water vapor) at 100 °C. However the difference in densities between air and water vapor would still exist (0.598 vs. 1.27 g/l).
At equal temperatures[]
At the same temperature, a column of dry air will be denser or heavier than a column of air containing any water vapor, the molar mass of diatomic nitrogen and diatomic oxygen both being greater than the molar mass of water. Thus, any volume of dry air will sink if placed in a larger volume of moist air. Also, a volume of moist air will rise or be buoyant if placed in a larger region of dry air. As the temperature rises the proportion of water vapor in the air increases, and its buoyancy will increase. The increase in buoyancy can have a significant atmospheric impact, giving rise to powerful, moisture rich, upward air currents when the air temperature and sea temperature reaches 25 °C or above. This phenomenon provides a significant driving force for cyclonic and anticyclonic weather systems (typhoons and hurricanes).
Respiration and breathing[]
Water vapor is a by-product of respiration in plants and animals. Its contribution to the pressure, increases as its concentration increases. Its partial pressure contribution to air pressure increases, lowering the partial pressure contribution of the other atmospheric gases (Dalton's Law). The total air pressure must remain constant. The presence of water vapor in the air naturally dilutes or displaces the other air components as its concentration increases.
This can have an effect on respiration. In very warm air (35 °C) the proportion of water vapor is large enough to give rise to the stuffiness that can be experienced in humid jungle conditions or in poorly ventilated buildings.
Lifting gas[]
Water vapor has lower density than that of air and is therefore buoyant in air but has lower vapor pressure than that of air. When water vapor is used as a lifting gas by a thermal airship the water vapor is heated to form steam so that its vapor pressure is greater than the surrounding air pressure in order to maintain the shape of a theoretical "steam balloon", which yields approximately 60% the lift of helium and twice that of hot air.[14]
General discussion[]
The amount of water vapor in an atmosphere is constrained by the restrictions of partial pressures and temperature. Dew point temperature and relative humidity act as guidelines for the process of water vapor in the water cycle. Energy input, such as sunlight, can trigger more evaporation on an ocean surface or more sublimation on a chunk of ice on top of a mountain. The balance between condensation and evaporation gives the quantity called vapor partial pressure.
The maximum partial pressure (saturation pressure) of water vapor in air varies with temperature of the air and water vapor mixture. A variety of empirical formulas exist for this quantity; the most used reference formula is the Goff-Gratch equation for the SVP over liquid water below zero degrees Celsius:

where T, temperature of the moist air, is given in units of kelvin, and p is given in units of millibars (hectopascals).
The formula is valid from about −50 to 102 °C; however there are a very limited number of measurements of the vapor pressure of water over supercooled liquid water. There are a number of other formulae which can be used.[15]
Under certain conditions, such as when the boiling temperature of water is reached, a net evaporation will always occur during standard atmospheric conditions regardless of the percent of relative humidity. This immediate process will dispel massive amounts of water vapor into a cooler atmosphere.
Exhaled air is almost fully at equilibrium with water vapor at the body temperature. In the cold air the exhaled vapor quickly condenses, thus showing up as a fog or mist of water droplets and as condensation or frost on surfaces. Forcibly condensing these water droplets from exhaled breath is the basis of exhaled breath condensate, an evolving medical diagnostic test.
Controlling water vapor in air is a key concern in the heating, ventilating, and air-conditioning (HVAC) industry. Thermal comfort depends on the moist air conditions. Non-human comfort situations are called refrigeration, and also are affected by water vapor. For example, many food stores, like supermarkets, utilize open chiller cabinets, or food cases, which can significantly lower the water vapor pressure (lowering humidity). This practice delivers several benefits as well as problems.
In Earth's atmosphere[]
Gaseous water represents a small but environmentally significant constituent of the atmosphere. The percentage of water vapor in surface air varies from 0.01% at -42 °C (-44 °F)[16] to 4.24% when the dew point is 30 °C (86 °F).[17] Over 99% of atmospheric water is in the form of vapour, rather than liquid water or ice, [18] and approximately 99.13% of the water vapour is contained in the troposphere. The condensation of water vapor to the liquid or ice phase is responsible for clouds, rain, snow, and other precipitation, all of which count among the most significant elements of what we experience as weather. Less obviously, the latent heat of vaporization, which is released to the atmosphere whenever condensation occurs, is one of the most important terms in the atmospheric energy budget on both local and global scales. For example, latent heat release in atmospheric convection is directly responsible for powering destructive storms such as tropical cyclones and severe thunderstorms. Water vapor is an important greenhouse gas[19][20] owing to the presence of the hydroxyl bond which strongly absorbs in the infra-red.
Water vapor is the "working medium" of the atmospheric thermodynamic engine which transforms heat energy from sun irradiation into mechanical energy in the form of winds. Transforming thermal energy into mechanical energy requires an upper and a lower temperature level, as well as a working medium which shuttles forth and back between both. The upper temperature level is given by the soil or water surface of the earth, which absorbs the incoming sun radiation and warms up, evaporating water. The moist and warm air at the ground is lighter than its surroundings and rises up to the upper limit of the troposphere. There the water molecules radiate their thermal energy into outer space, cooling down the surrounding air. The upper atmosphere constitutes the lower temperature level of the atmospheric thermodynamic engine. The water vapor in the now cold air condenses out and falls down to the ground in the form of rain or snow. The now heavier cold and dry air sinks down to ground as well; the atmospheric thermodynamic engine thus establishes a vertical convection, which transports heat from the ground into the upper atmosphere, where the water molecules can radiate it to outer space. Due to the earth’s rotation and the resulting Coriolis forces, this vertical atmospheric convection is also converted into a horizontal convection, in the form of cyclones and anticyclones, which transport the water evaporated over the oceans into the interior of the continents, enabling vegetation to grow.[21]
Water in Earth's atmosphere is not merely below its boiling point (100 °C), but at altitude it goes below its freezing point (0 °C), due to water's highly polar attraction. When combined with its quantity, water vapor then has a relevant dew point and frost point, unlike e. g., carbon dioxide and methane. Water vapor thus has a scale height a fraction of that of the bulk atmosphere,[22][23][24] as the water condenses and exits, primarily in the troposphere, the lowest layer of the atmosphere.[25] Carbon dioxide (CO
2) and methane, being well-mixed in the atmosphere, tend to rise above water vapour. The absorption and emission of both compounds contribute to Earth's emission to space, and thus the planetary greenhouse effect.[23][26][27] This greenhouse forcing is directly observable, via distinct spectral features versus water vapor, and observed to be rising with rising CO
2 levels.[28] Conversely, adding water vapor at high altitudes has a disproportionate impact, which is why jet traffic[29][30][31] has a disproportionately high warming effect. Oxidation of methane is also a major source of water vapour in the stratosphere,[32] and adds about 15% to methane's global warming effect.[33]
In the absence of other greenhouse gases, Earth's water vapor would condense to the surface;[34][35][36] this has likely happened, possibly more than once. Scientists thus distinguish between non-condensable (driving) and condensable (driven) greenhouse gases, i.e., the above water vapor feedback.[37][20][19]
Fog and clouds form through condensation around cloud condensation nuclei. In the absence of nuclei, condensation will only occur at much lower temperatures. Under persistent condensation or deposition, cloud droplets or snowflakes form, which precipitate when they reach a critical mass.
Atmospheric concentration of water vapour is highly variable between locations and times, from 10 ppmv in the coldest air to 5% (50 000 ppmv) in humid tropical air, [38] and can be measured with a combination of land observations, weather balloons and satellites.[39] The water content of the atmosphere as a whole is constantly depleted by precipitation. At the same time it is constantly replenished by evaporation, most prominently from oceans, lakes, rivers, and moist earth. Other sources of atmospheric water include combustion, respiration, volcanic eruptions, the transpiration of plants, and various other biological and geological processes. At any given time there is about 1.29 x 10¹⁶ litres (3.4 x 10¹⁵ gal.) of water in the atmosphere. The atmosphere holds 1 part in 2500 of the fresh water, and 1 part in 100,000 of the total water on Earth. [40] The mean global content of water vapor in the atmosphere is roughly sufficient to cover the surface of the planet with a layer of liquid water about 25 mm deep.[41][42][43] The mean annual precipitation for the planet is about 1 metre, a comparison which implies a rapid turnover of water in the air – on average, the residence time of a water molecule in the troposphere is about 9 to 10 days. [43]
Global mean water vapour is about 0.25% of the atmosphere by mass and also varies seasonally, in terms of contribution to atmospheric pressure between 2.62 hPa in July and 2.33 hPa in December.[44] IPCC AR6 expresses medium confidence in increase of total water vapour at about 1-2% per decade;[45] it is expected to increase by around 7% per °C of warming. [41]
Episodes of surface geothermal activity, such as volcanic eruptions and geysers, release variable amounts of water vapor into the atmosphere. Such eruptions may be large in human terms, and major explosive eruptions may inject exceptionally large masses of water exceptionally high into the atmosphere, but as a percentage of total atmospheric water, the role of such processes is trivial. The relative concentrations of the various gases emitted by volcanoes varies considerably according to the site and according to the particular event at any one site. However, water vapor is consistently the commonest volcanic gas; as a rule, it comprises more than 60% of total emissions during a subaerial eruption.[46]
Atmospheric water vapor content is expressed using various measures. These include vapor pressure, specific humidity, mixing ratio, dew point temperature, and relative humidity.
Radar and satellite imaging[]

Because water molecules absorb microwaves and other radio wave frequencies, water in the atmosphere attenuates radar signals.[47] In addition, atmospheric water will reflect and refract signals to an extent that depends on whether it is vapor, liquid or solid.
Generally, radar signals lose strength progressively the farther they travel through the troposphere. Different frequencies attenuate at different rates, such that some components of air are opaque to some frequencies and transparent to others. Radio waves used for broadcasting and other communication experience the same effect.
Water vapor reflects radar to a lesser extent than do water's other two phases. In the form of drops and ice crystals, water acts as a prism, which it does not do as an individual molecule; however, the existence of water vapor in the atmosphere causes the atmosphere to act as a giant prism.[48]
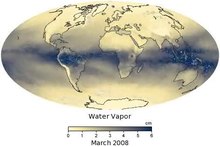
A comparison of GOES-12 satellite images shows the distribution of atmospheric water vapor relative to the oceans, clouds and continents of the Earth. Vapor surrounds the planet but is unevenly distributed. The image loop on the right shows monthly average of water vapor content with the units are given in centimeters, which is the precipitable water or equivalent amount of water that could be produced if all the water vapor in the column were to condense. The lowest amounts of water vapor (0 centimeters) appear in yellow, and the highest amounts (6 centimeters) appear in dark blue. Areas of missing data appear in shades of gray. The maps are based on data collected by the Moderate Resolution Imaging Spectroradiometer (MODIS) sensor on NASA's Aqua satellite. The most noticeable pattern in the time series is the influence of seasonal temperature changes and incoming sunlight on water vapor. In the tropics, a band of extremely humid air wobbles north and south of the equator as the seasons change. This band of humidity is part of the Intertropical Convergence Zone, where the easterly trade winds from each hemisphere converge and produce near-daily thunderstorms and clouds. Farther from the equator, water vapor concentrations are high in the hemisphere experiencing summer and low in the one experiencing winter. Another pattern that shows up in the time series is that water vapor amounts over land areas decrease more in winter months than adjacent ocean areas do. This is largely because air temperatures over land drop more in the winter than temperatures over the ocean. Water vapor condenses more rapidly in colder air.[49]
As water vapor absorbs light in the visible spectral range, its absorption can be used in spectroscopic applications (such as DOAS) to determine the amount of water vapor in the atmosphere. This is done operationally, e.g. from the spectrometers on ERS and MetOp.[50] The weaker water vapor absorption lines in the blue spectral range and further into the UV up to its dissociation limit around 243 nm are mostly based on quantum mechanical calculations[51] and are only partly confirmed by experiments.[52]
Lightning generation[]
Water vapor plays a key role in lightning production in the atmosphere. From cloud physics, usually clouds are the real generators of static charge as found in Earth's atmosphere. The ability of clouds to hold massive amounts of electrical energy is directly related to the amount of water vapor present in the local system.
The amount of water vapor directly controls the permittivity of the air. During times of low humidity, static discharge is quick and easy. During times of higher humidity, fewer static discharges occur. Permittivity and capacitance work hand in hand to produce the megawatt outputs of lightning.[53]
After a cloud, for instance, has started its way to becoming a lightning generator, atmospheric water vapor acts as a substance (or insulator) that decreases the ability of the cloud to discharge its electrical energy. Over a certain amount of time, if the cloud continues to generate and store more static electricity, the barrier that was created by the atmospheric water vapor will ultimately break down from the stored electrical potential energy.[54] This energy will be released to a local oppositely charged region, in the form of lightning. The strength of each discharge is directly related to the atmospheric permittivity, capacitance, and the source's charge generating ability.[55]
Extraterrestrial[]
Water vapor is common in the Solar System and by extension, other planetary systems. Its signature has been detected in the atmospheres of the Sun, occurring in sunspots. The presence of water vapor has been detected in the atmospheres of all seven extraterrestrial planets in the solar system, the Earth's Moon,[56] and the moons of other planets,[which?] although typically in only trace amounts.
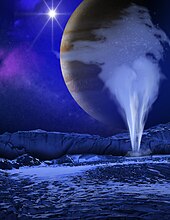

Geological formations such as cryogeysers are thought to exist on the surface of several icy moons ejecting water vapor due to tidal heating and may indicate the presence of substantial quantities of subsurface water. Plumes of water vapor have been detected on Jupiter's moon Europa and are similar to plumes of water vapor detected on Saturn's moon Enceladus.[57] Traces of water vapor have also been detected in the stratosphere of Titan.[59] Water vapor has been found to be a major constituent of the atmosphere of dwarf planet, Ceres, largest object in the asteroid belt[60] The detection was made by using the far-infrared abilities of the Herschel Space Observatory.[61] The finding is unexpected because comets, not asteroids, are typically considered to "sprout jets and plumes." According to one of the scientists, "The lines are becoming more and more blurred between comets and asteroids."[61] Scientists studying Mars hypothesize that if water moves about the planet, it does so as vapor.[62]
The brilliance of comet tails comes largely from water vapor. On approach to the Sun, the ice many comets carry sublimes to vapor. Knowing a comet's distance from the sun, astronomers may deduce the comet's water content from its brilliance.[63]
Water vapor has also been confirmed outside the Solar System. Spectroscopic analysis of HD 209458 b, an extrasolar planet in the constellation Pegasus, provides the first evidence of atmospheric water vapor beyond the Solar System. A star called CW Leonis was found to have a ring of vast quantities of water vapor circling the aging, massive star. A NASA satellite designed to study chemicals in interstellar gas clouds, made the discovery with an onboard spectrometer. Most likely, "the water vapor was vaporized from the surfaces of orbiting comets."[64] Other exoplanets with evidence of water vapor include HAT-P-11b and K2-18b.[65][66]
See also[]
- Air density
- Atmospheric river
- Boiling point
- Condensation in aerosol dynamics
- Deposition
- Earth's atmosphere
- Eddy covariance
- Equation of state
- Evaporative cooler
- Fog
- Frost
- Gas laws
- Gibbs free energy
- Gibbs phase rule
- Greenhouse gas
- Heat capacity
- Heat of vaporization
- Humidity
- Hygrometer
- Ideal gas
- Kinetic theory of gases
- Latent heat
- Latent heat flux
- Microwave radiometer
- Phase of matter
- Saturation vapor density
- Steam
- Sublimation
- Superheating
- Supersaturation
- Thermodynamics
- Troposphere
- Vapor pressure
| Wikimedia Commons has media related to Water vapor. |
References[]
- ^ Lide (1992)
- ^ Jump up to: a b Vienna Standard Mean Ocean Water (VSMOW), used for calibration, melts at 273.1500089(10) K (0.000089(10) °C, and boils at 373.1339 [Kelvin|K} (99.9839 °C)
- ^ "Water Vapor – Specific Heat". Retrieved May 15, 2012.
- ^ "What is Water Vapor?". Retrieved August 28, 2012.
- ^ Schroeder (2000), p. 36
- ^ https://web.archive.org/web/20080412215652/http://www.grow.arizona.edu/Grow--GrowResources.php?ResourceId=208. Archived from the original on April 12, 2008. Retrieved April 7, 2008. Missing or empty
|title=(help) - ^ "swimming, pool, calculation, evaporation, water, thermal, temperature, humidity, vapor, excel". Retrieved February 26, 2016.
- ^ "Summary of Results of all Pool Evaporation Rate Studies". R. L. Martin & Associates. Archived from the original on March 24, 2008.
- ^ "climate - meteorology". Encyclopædia Britannica. Retrieved February 26, 2016.
- ^ Held, Isaac M.; Soden, Brian J. (November 2000). "Watervaporfeedback Andglobalwarming". Annual Review of Energy and the Environment. 25 (1): 441–475. doi:10.1146/annurev.energy.25.1.441. ISSN 1056-3466.
- ^ Schroeder (2000), p. 19
- ^ Williams, Jack (August 5, 2013). "Why dry air is heavier than humid air". The Washington Post. Retrieved December 28, 2014.
- ^ "Humidity 101". World Water rescue Foundation. Archived from the original on April 16, 2013. Retrieved December 28, 2014.
- ^ Goodey, Thomas J. "Steam Balloons and Steam Airships". Retrieved August 26, 2010.
- ^ "Water Vapor Pressure Formulations". Retrieved February 26, 2016.
- ^ McElroy (2002), p. 34, Fig. 4.3a
- ^ McElroy (2002), p. 36 example 4.1
- ^ "Atmospheric Water Vapor". Remote Sensing Systems. Retrieved August 22, 2021.
- ^ Jump up to: a b Lacis, A. et al., The role of long-lived greenhouse gases as principal LW control knob that governs the global surface temperature for past and future climate change, Tellus B, vol. 65 p. 19734, 2013
- ^ Jump up to: a b "Properties". American Chemical Society. Retrieved February 26, 2016.
- ^ https://web.stanford.edu/~ajlucas/The%20Atmosphere%20as%20a%20Heat%20Engine.pdf
- ^ Bruce L. Gary. "Ch#5". Retrieved February 26, 2016.
- ^ Jump up to: a b "The Carbon Dioxide Greenhouse Effect". Retrieved February 26, 2016.
- ^ Weaver & Ramanathan (1995)
- ^ Norris, G. (December 2, 2013). "Icy Surprise". Aviation Week & Space Technology. 175 (41): 30.
22,000 ft., which is considered the upper limit for clouds containing supercooled liquid water
- ^ "Climate scientists confirm elusive tropospheric hot spot". ARC Centre of Excellence for Climate System Science. May 14, 2015. Retrieved May 17, 2015.
- ^ Sherwood, S; Nishant, N (May 11, 2015). "Atmospheric changes through 2012 as shown by iteratively homogenized radiosonde temperature and wind data (IUKv2)". Environmental Research Letters. 10 (5): 054007. Bibcode:2015ERL....10e4007S. doi:10.1088/1748-9326/10/5/054007.
- ^ Feldman, D (February 25, 2015). "Observational determination of surface radiative forcing by CO2 from 2000 to 2010". Nature. 519 (7543): 339–343. Bibcode:2015Natur.519..339F. doi:10.1038/nature14240. PMID 25731165. S2CID 2137527.
- ^ Messer, A. "Jet contrails alter average daily temperature range". Retrieved May 17, 2015.
- ^ Danahy, A. "Jets' contrails contribute to heat-trapping high-level clouds". Retrieved May 17, 2015.
- ^ Ryan, A; Mackenzie, A; et al. (September 2012). "World War II contrails: a case study of aviation-induced cloudiness". International Journal of Climatology. 32 (11): 1745–1753. Bibcode:2012IJCli..32.1745R. doi:10.1002/joc.2392.
- ^ Noël, Stefan; Weigel, Katja; et al. (2017). "Water Vapour and Methane Coupling in the Stratosphere observed with SCIAMACHY Solar Occultation Measurements" (PDF). Atmospheric Chemistry and Physics (18): 4463–4476. doi:10.5194/acp-18-4463-2018. Retrieved August 22, 2021.
- ^ Myhre, Gunnar; et al. (January 9, 2007). "Radiative forcing due to stratospheric water vapour from CH4 oxidation". Geophysical Research Letters. 34 (1). doi:10.1029/2006GL027472. Retrieved August 22, 2021.
- ^ Vogt et al. (2010): "The equilibrium temperature of the Earth is 255 K, well-below the freezing point of water, but because of its atmosphere, the greenhouse effect warms the surface"
- ^ What is the maximum and minimum distance for the Earth that is compatible with life?
- ^ "for the Earth, the albedo is 0.306 and the distance is 1.000 AU, so the expected temperature is 254 K or -19 C – significantly below the freezing point of water!"
- ^ de Pater, I., Lissauer, J., Planetary Sciences, Cambridge University Press, 2007
- ^ Wallace, John M. and Peter V. Hobbs. Atmospheric Science: An Introductory Survey Archived 2018-07-28 at the Wayback Machine. Elsevier. Second Edition, 2006. ISBN 978-0-12-732951-2. Page 8.
- ^ Li, Zhenhong; Muller, Jan-Peter; Cross, Paul (October 29, 2003). "Comparison of precipitable water vapor derived from radiosonde, GPS, and Moderate-Resolution Imaging Spectroradiometer measurements". Journal of Geophysical Research Atmospheres. 108 (20): 1–10. doi:10.1029/2003JD003372. Retrieved August 22, 2021.
- ^ Gleick, P. H. (1996). "Water Resources". In Schneider, S. H. (ed.). Encyclopedia of Climate and Weather. New York: Oxford University Press. pp. 817–823.
Vol. 2
- ^ Jump up to: a b Forsythe, John; Haar2, Thomas H; Cronk, Heather (May 21, 2014). "Observed Global and Regional Variation in Earth's Water Vapor: Focus on the Weather-Climate Interface" (PDF). Retrieved August 22, 2021.
- ^ International Satellite Cloud Climatology Project (2010). "21-Year Deviations and Anomalies of Region Monthly Mean From Total Period Mean Over Global Total Column Water Vapor (cm)". Retrieved August 22, 2021.
- ^ Jump up to: a b Mockler, SB (December 1995). "Water vapor in the climate system". AGU special report. Retrieved August 22, 2021.
- ^ Trenberth, Kevin E; Smith, Lesley (March 15, 2005). "The Mass of the Atmosphere: A Constraint on Global Analyses". Journal of Climate. Volume 18 (6): 864–875. doi:10.1175/JCLI-3299.1. Retrieved August 22, 2021.
|volume=has extra text (help) - ^ Gulev, S. K., P. W. Thorne, J. Ahn, F. J. Dentener, C. M. Domingues, S. Gerland, D. Gong, D. S. Kaufman, H. C. Nnamchi, J. Quaas, J. A. Rivera, S. Sathyendranath, S. L. Smith, B. Trewin, K. von Shuckmann, R. S. Vose (2021). "2.3.1.3.3 Total column water vapour". In Masson-Delmotte, V; P, Zhai (eds.). Changing State of the Climate System. Climate Change 2021: The Physical Science Basis. Contribution of Working Group I to the Sixth Assessment Report of the Intergovernmental Panel on Climate Change (Report). Cambridge University Press. pp. 52–3. Retrieved August 22, 2021.CS1 maint: uses authors parameter (link)
- ^ Sigurdsson & Houghton (2000)
- ^ Skolnik (1990), p. 23.5
- ^ Skolnik (1990), pp. 2.44–2.54
- ^ "Water Vapor". Global Maps. July 31, 2018. Retrieved February 26, 2016.
- ^ Loyola, Diego. "GOME-2/MetOp-A at DLR". atmos.eoc.dlr.de. Retrieved October 19, 2017.
- ^ Tennyson, Jonathan (2014). "Vibration–rotation transition dipoles from first principles". Journal of Molecular Spectroscopy. 298: 1–6. Bibcode:2014JMoSp.298....1T. doi:10.1016/j.jms.2014.01.012.
- ^ Tennyson, J., Bernath, P.F., Brown, L.R., Campargue, A., Carleer, M.R., Csa´sza´r, A.G., Daumont, L., Gamache, R.R., es, J. T. H., Naumenko, O.V., Polyansky, O.L., Rothmam, L.S., Vandaele, A.C., Zobov, N.F., Al Derzi, A.R., F´abri, C., Fazliev, A.Z., rtenbacher, T.F., Gordon, I.E., Lodi, L., and Mizus, I.I. (2013). "IUPAC critical evaluation of the rotational-vibrational spectra of 1440 water vapor. Part III". Physical Chemistry Chemical Physics. 15 (37): 15 371–15 381. Bibcode:2013PCCP...1515371T. doi:10.1039/C3CP50968K. PMID 23928555.CS1 maint: multiple names: authors list (link)
- ^ Shadowitz (1975), pp. 165–171
- ^ Shadowitz (1975), pp. 172–173, 182, 414–416
- ^ Shadowitz (1975), p. 172
- ^ Sridharan et al. (2010), p. 947
- ^ Jump up to: a b Cook, Jia-Rui C.; Gutro, Rob; Brown, Dwayne; Harrington, J.D.; Fohn, Joe (December 12, 2013). "Hubble Sees Evidence of Water Vapor at Jupiter Moon". NASA. Retrieved December 12, 2013.
- ^ "Hubble traces faint signatures of water in exoplanet atmospheres (artist's illustration)". ESA/Hubble Press Release. Retrieved December 5, 2013.
- ^ Cottini et al. (2012)
- ^ Küppers et al. (2014)
- ^ Jump up to: a b Harrington, J.D. (January 22, 2014). "Herschel Telescope Detects Water on Dwarf Planet – Release 14-021". NASA. Retrieved January 22, 2014.
- ^ Jakosky, Bruce, et al. "Water on Mars", April 2004, Physics Today, p. 71.
- ^ Anatomy of a Comet
- ^ Lloyd, Robin. "Water Vapor, Possible Comets, Found Orbiting Star", 11 July 2001, Space.com. Retrieved December 15, 2006.
- ^ Clavin, Whitney; Chou, Felicia; Weaver, Donna; Villard; Johnson, Michele (September 24, 2014). "NASA Telescopes Find Clear Skies and Water Vapor on Exoplanet". NASA. Retrieved September 24, 2014.
- ^ Tsiaras, Angelos; et al. (September 11, 2019). "Water vapour in the atmosphere of the habitable-zone eight-Earth-mass planet K2-18 b". Nature Astronomy. 3 (12): 1086–1091. arXiv:1909.05218. Bibcode:2019NatAs.tmp..451T. doi:10.1038/s41550-019-0878-9. S2CID 202558393.
Bibliography[]
- Cottini, V.; Nixon, C. A.; Jennings, D. E.; Anderson, C. M.; Gorius, N.; Bjoraker, G.L.; Coustenis, A.; Teanby, N. A.; Achterberg, R. K.; Bézard, B.; de Kok, R.; Lellouch, E.; Irwin, P. G. J.; Flasar, F. M.; Bampasidis, G. (2012). "Water vapor in Titan's stratosphere from Cassini CIRS far-infrared spectra". Icarus. 220 (2): 855–862. Bibcode:2012Icar..220..855C. doi:10.1016/j.icarus.2012.06.014. hdl:2060/20140010836.
- Küppers, Michael; O'Rourke, Laurence; Bockelée-Morvan, Dominique; Zakharov, Vladimir; Lee, Seungwon; von Allmen, Paul; Carry, Benoît; Teyssier, David; Marston, Anthony; Müller, Thomas; Crovisier, Jacques; Barucci, M. Antonietta; Moreno, Raphael (2014). "Localized sources of water vapour on the dwarf planet (1) Ceres". Nature. 505 (7484): 525–527. Bibcode:2014Natur.505..525K. doi:10.1038/nature12918. PMID 24451541. S2CID 4448395.
- Lide, David (1992). CRC Handbook of Chemistry and Physics (73rd ed.). CRC Press.
- McElroy, Michael B. (2002). The Atmospheric Environment. Princeton University Press.
- Schroeder, David (2000). Thermal Physics. Addison Wesley Longman.
- Shadowitz, Albert (1975). The Electromagnetic Field. McGraw-Hill.
- Sigurdsson, Haraldur; Houghton, B. F. (2000). Encyclopedia of Volcanoes. San Diego, CA: Academic Press. ISBN 9780126431407.
- Skolnik, Merrill (1990). Radar Handbook (2nd ed.). McGraw-Hill.
- Sridharan, R.; Ahmed, S. M.; Dasa, Tirtha Pratim; Sreelathaa, P.; Pradeepkumara, P.; Naika, Neha; Supriya, Gogulapati (2010). "'Direct' evidence for water (H2O) in the sunlit lunar ambience from CHACE on MIP of Chandrayaan I". Planetary and Space Science. 58 (6): 947–950. Bibcode:2010P&SS...58..947S. doi:10.1016/j.pss.2010.02.013.
- Vogt, Steven S.; Butler, R. Paul; Rivera, E. J.; Haghighipour, N.; Henry, Gregory W.; Williamson, Michael H. (2010). "The Lick-Carnegie Exoplanet Survey: a 3.1 M⊕ planet in the habitable zone of the nearby M3V star Gliese 581" (PDF draft). The Astrophysical Journal. 723 (1): 954–965. arXiv:1009.5733. Bibcode:2010ApJ...723..954V. doi:10.1088/0004-637X/723/1/954. S2CID 3163906.
- Weaver, C. P.; Ramanathan, V. (1995). "Deductions from a simple climate model: factors governing surface temperature and atmospheric thermal structure" (PDF). Journal of Geophysical Research. 100 (D6): 11585–11591. Bibcode:1995JGR...10011585W. doi:10.1029/95jd00770.
External links[]
- National Science Digital Library – Water Vapor
- Calculate the condensation of your exhaled breath
- Water Vapor Myths: A Brief Tutorial
- AGU Water Vapor in the Climate System – 1995
- Free Windows Program, Water Vapor Pressure Units Conversion Calculator – PhyMetrix
| show Authority control |
|---|
- Greenhouse gases
- Atmospheric thermodynamics
- Forms of water
- Water in gas
- Psychrometrics