Total fertility rate
The total fertility rate (TFR), sometimes also called the fertility rate, absolute/potential natality, period total fertility rate (PTFR), or total period fertility rate (TPFR) of a population is the average number of children that would be born to a woman over her lifetime if:
- she was to experience the exact current age-specific fertility rates (ASFRs) through her lifetime
- she was to live from birth until the end of her reproductive life.[1]
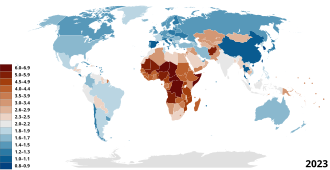
It is obtained by summing the single-year age-specific rates at a given time. As of 2020, the total fertility rate varied from 0.84 in South Korea[2] to 7.0 in Niger.[3]
Parameter characteristics[]

| Years | TFR |
|---|---|
| 1950–1955 | 4.96 |
| 1955–1960 | 4.89 |
| 1960–1965 | 5.03 |
| 1965–1970 | 4.92 |
| 1970–1975 | 4.46 |
| 1975–1980 | 3.87 |
| 1980–1985 | 3.6 |
| 1985–1990 | 3.44 |
| 1990–1995 | 3.02 |
| 1995–2000 | 2.75 |
| 2000–2005 | 2.63 |
| 2005–2010 | 2.57 |
| 2010–2015 | 2.52 |
| 2015-2020 | 2.47 |
The TFR is not based on the fertility of any real group of women since this would involve waiting until they had completed childbearing. Nor is it based on counting up the total number of children actually born over their lifetime. Instead, the TFR is based on the age-specific fertility rates of women in their "child-bearing years", which in conventional international statistical usage is ages 15–44 or 15–49.[5]
The TFR is, therefore, a measure of the fertility of an imaginary woman who passes through her reproductive life subject to all the age-specific fertility rates for ages 15–49 that were recorded for a given population in a given year. The TFR represents the average number of children a woman would potentially have, were she to fast-forward through all her childbearing years in a single year, under all the age-specific fertility rates for that year. In other words, this rate is the number of children a woman would have if she was subject to prevailing fertility rates at all ages from a single given year and survives throughout all her childbearing years.
Related parameters[]
Net reproduction rate[]
An alternative fertility measure is the net reproduction rate (NRR), which measures the number of daughters a woman would have in her lifetime if she were subject to prevailing age-specific fertility and mortality rates in the given year. When the NRR is exactly 1, then each generation of women is exactly reproducing itself.
The NRR is less widely used than the TFR, and the United Nations stopped reporting NRR data for member nations after 1998. But the NRR is particularly relevant where the number of male babies born is very high due to gender imbalance and sex selection. This is a significant factor in world population, due to the high level of gender imbalance in the very populous nations of China and India. The gross reproduction rate (GRR), is the same as the NRR, except that—like the TFR—it ignores life expectancy.
Total period fertility rate[]
The TFR (or TPFR—total period fertility rate) is a better index of fertility than the crude birth rate (annual number of births per thousand population) because it is independent of the age structure of the population, but it is a poorer estimate of actual completed family size than the , which is obtained by summing the age-specific fertility rates that actually applied to each cohort as they aged through time. In particular, the TFR does not necessarily predict how many children young women now will eventually have, as their fertility rates in years to come may change from those of older women now. However, the TFR is a reasonable summary of current fertility levels. TFR and long term population growth rate, g, are closely related. For a population structure in a steady state, growth rate equals log(TFR/2)/Xm, where Xm is the mean age for childbearing women.
Tempo effect[]
The TPFR (total period fertility rate) is affected by a tempo effect—if age of childbearing increases (and life cycle fertility is unchanged) then while the age of childbearing is increasing, TPFR will be lower (because the births are occurring later), and then the age of childbearing stops increasing, the TPFR will increase (due to the deferred births occurring in the later period) even though the life cycle fertility has been unchanged. In other words, the TPFR is a misleading measure of life cycle fertility when childbearing age is changing, due to this statistical artifact. This is a significant factor in some countries, such as the Czech Republic and Spain in the 1990s. Some measures seek to adjust for this timing effect to gain a better measure of life-cycle fertility.

Replacement rates []
Replacement fertility is the total fertility rate at which women give birth to enough babies to sustain population levels.
According to the UN Population Division, a total fertility rate (TFR) of about 2.1 children per woman is called replacement-level fertility.[9] If replacement level fertility is sustained over a sufficiently long period, each generation will exactly replace itself.[9] The replacement level of TFR is dependent also on maternal mortality and child mortality, and, as such, it is higher in underdeveloped countries. The replacement fertility rate is indeed only slightly above 2.0 births per woman for most industrialized countries (2.075 in the UK, for example), but ranges from 2.5 to 3.3 in developing countries because of higher mortality rates, especially child mortality.[10] The global average for the replacement total fertility rate (eventually leading to a stable global population) was 2.33 children per woman in 2003.[11]
Lowest-low fertility[]
The term "lowest-low fertility" is defined as TFR at or below 1.3.[12] This is characteristic of some Eastern European, Southern European, and East Asian countries.[13] In 2001, more than half of the population of Europe lived in countries with the lowest-low TFR, but TFRs have since slightly increased there.[14] Additionally, the fertility rate for Parsis in India is 0.8 as of 2017.[15]
Population-lag effect[]

A population that maintained a TFR of 3.8 over an extended period without a correspondingly high death or emigration rate would increase rapidly (doubling period ~ 32 years), whereas a population that maintained a TFR of 2.0 over a long time would decrease, unless it had a large enough immigration. However, it may take several generations for a change in the total fertility rate to be reflected in birth rate, because the age distribution must reach equilibrium. For example, a population that has recently dropped below replacement-level fertility will continue to grow, because the recent high fertility produced large numbers of young couples who would now be in their childbearing years.
This phenomenon carries forward for several generations and is called population momentum, population inertia, or population-lag effect. This time-lag effect is of great importance to the growth rates of human populations.
TFR (net) and long-term population growth rate, g, are closely related. For a population structure in a steady state and with zero migration, g equals log(TFR/2)/Xm, where Xm is mean age for childbearing women and thus P(t) = P(0) exp(gt). At the left side is shown the empirical relation between the two variables in a cross-section of countries with the most recent y-y growth rate. The parameter 1/b should be an estimate of the Xm; here equal to 1/0.02 = 50 years, way off the mark because of population momentum. E.g. for log(TFR/2) = 0, g should be exactly zero, which is seen not to be the case.
Developed or developing countries[]


Developed countries usually have a significantly lower fertility rate, often correlated with greater wealth, education, urbanization, or other factors. Mortality rates are low, birth control is understood and easily accessible, and costs are often deemed very high because of education, clothing, feeding, and social amenities. With wealth, contraception becomes affordable. In countries like Iran where contraception was subsidized before the economy accelerated, birth rate also rapidly declined. Further, longer periods of time spent getting higher education often mean women have children later in life. The female labor participation rate also has a substantial negative impact on fertility, but not in all countries (for countries in the OECD, increased female labor participation has been associated with increased fertility[16]).
In undeveloped countries, on the other hand, families desire children for their labour and as caregivers for their parents in old age. Fertility rates are also higher due to the lack of access to contraceptives, stricter adherence to traditional religious beliefs, generally lower levels of female education, and lower rates of female employment in industry. The total fertility rate for the world has been declining very rapidly since the 1990s. Some forecasters like Sanjeev Sanyal argue that, adjusted for gender imbalances, the effective global fertility will fall below replacement rate in the 2020s. This would stabilize world population by 2050.[17] This differs from projections by the United Nations who estimate that some growth will continue even in 2100.[18] If the global TFR falls as much as it did from year 1995 to 2000, by 0.25 points, in 2015 to 2020, then that would result in global TFR being 2.11 by year 2020 (it was 2.36 in 2010–2015 period). 2.11 is the exact global replacement rate of humanity. However, if it falls as much as it did from 1975 to 1980, by 0.61 points (it was 4.45 TFR in 1975 and 3.84 TFR by 1980), then the global TFR would be low at 1.75 children per woman, well below replacement level, by year 2020.
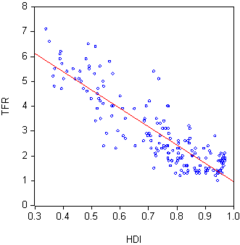
This situation of wealthy countries usually having a lower fertility rate than poor countries is part of the fertility-income paradox, as the very high fertility countries are very poor, and it may seem counter-intuitive for families there to have so many children. The inverse relationship between income and fertility has been termed a demographic-economic "paradox" by the notion that greater means would enable the production of more offspring, as first suggested by demographic scholar Thomas Malthus in 1798.
Politics[]
Governments have often set population targets, to either increase or decrease the total fertility rate; or to have certain ethnic or socioeconomic groups have a lower or higher fertility rate. Often such policies have been interventionist, and abusive. The most notorious natalist policies of the 20th century include those in communist Romania and communist Albania, under Nicolae Ceaușescu and Enver Hoxha respectively. The policy of Romania (1967–1990) was very aggressive, including outlawing abortion and contraception, routine pregnancy tests for women, taxes on childlessness, and legal discrimination against childless people; and resulted in large numbers of children put into Romanian orphanages by parents who couldn't cope with raising them, street children in the 1990s (when many orphanages were closed and the children ended up on the streets), overcrowding in homes and schools, and over 9,000 women who died due to illegal abortions.[19] Conversely, in China the government sought to lower the fertility rate, and, as such, enacted the one-child policy (1978–2015), which included abuses such as forced abortions.[20]
Some governments have sought to regulate which groups of society could reproduce through eugenic policies of forced sterilizations of 'undesirable' population groups. Such policies were carried out against ethnic minorities in Europe and North America in the first half of the 20th century, and more recently in Latin America against the Indigenous population in the 1990s; in Peru, President Alberto Fujimori (in office from 1990 to 2000) has been accused of genocide and crimes against humanity as a result of a sterilization program put in place by his administration targeting indigenous people (mainly the Quechuas and the Aymaras).[21] Within this historical contexts, the notion of reproductive rights has developed. Such rights are based on the concept that each person freely decides if, when, and how many children to have - not the state or church. According to the OHCHR reproductive rights "rest on the recognition of the basic rights of all couples and individuals to decide freely and responsibly the number, spacing and timing of their children and to have the information and means to do so, and the right to attain the highest standard of sexual and reproductive health. It also includes the right to make decisions concerning reproduction free of discrimination, coercion and violence, as expressed in human rights documents".[22]
Factors[]
A parent's number of children strongly correlates with the number of children that each person in the next generation will eventually have.[23] Factors generally associated with increased fertility include religiosity,[24] intention to have children,[25] and maternal support.[26] Factors generally associated with decreased fertility include wealth, education,[27] female labor participation,[28] urban residence,[29] intelligence, widespread birth control usage, increased female age and (to a lesser degree) increased male age. Many of these factors, however, are not universal, and differ by region and social class. For instance, at a global level, religion is correlated with increased fertility, but in the West less so: Scandinavian countries and France are among the least religious in the EU, but have the highest TFR, while the opposite is true about Portugal, Greece, Cyprus, Poland and Spain.[30]
World extreme lows[]
The lowest TFR recorded anywhere in the world in recorded history is for Xiangyang district of Jiamusi city (Heilongjiang, China) which had a TFR of 0.41.[31][page needed] Outside China, the lowest TFR ever recorded was 0.80 for Eastern Germany in 1994. The low Eastern German value was influenced by a change to higher age at birth, with the consequence that neither older cohorts (e.g. women born until the late 1960s), who often already had children, nor younger cohorts, who were postponing childbirth, had many children during that time. The total cohort fertility rate of each age cohort of women in East German did not drop as significantly.
By region[]
Africa[]
The most populous country in Africa, Nigeria, had a TFR of 5.3 in 2018.[32] The second most populous country, Ethiopia, had an estimated TFR of 4.25 in 2018.[33]
[7] This region of the world has the highest TFR (Niger, Burundi, Mali, Somalia, and Uganda are highest).[7] The poverty of the region, and the high maternal mortality and infant mortality had led to calls from WHO of family planning and encouragement of smaller families.[34]
South Asia[]
India[]
The Indian fertility rate has declined significantly over the early 21st century. The Indian TFR declined from 3.2 in 2000 to 2.3 in 2016.[35] It since fell to 2.2 in 2018.[36] The TFR for 2019 was estimated at 2.1[37]
Bangladesh[]
The fertility rate fell to 2.0 in Bangladesh in 2019.[38]
East Asia[]

Singapore, Macau, Taiwan, Hong Kong, and South Korea had lowest-low fertility, defined as TFR at or below 1.3, and were among the lowest in the world. Singapore and Macau had a TFR below 1.0 in 2017. North Korea had the highest TFR in East Asia at 1.95.[7]
China[]
The TFR of China was 1.30 in 2020.[7] China implemented the one-child policy in 1979 as a drastic population planning measure to control the ever-growing population at the time. In 2015, the policy was replaced with two-child policy as China's population is aging faster than almost any other country in modern history.[39]
Japan[]
Japan had a TFR of 1.34 in 2020.[7] Japan's population is rapidly aging due to both a long life expectancy and a low birth rate. The total population is shrinking, losing 430,000 in 2018 to a total of 126.4 million.[40] Hong Kong and Singapore mitigate this through immigrant workers, but in Japan, a serious demographic imbalance has developed due to the limited number of immigration to Japan.
South Korea[]
In South Korea, a low birthrate is one of its most urgent socio-economic challenges.[41] Rising housing expenses, shrinking job opportunities for younger generations, insufficient support to families with newborns either from the government or employers are among the major explanations for its crawling TFR, which fell to 0.92 in 2019.[42][43] Koreans are yet to find viable solutions to make the birthrate rebound, even after trying out dozens of programs over a decade, including subsidizing rearing expenses, giving priorities for public rental housing to couples with multiple children, funding day care centers, reserving seats in public transportation for pregnant women, and so on.
In the past 20 years, South Korea has recorded some of the lowest fertility and marriage levels in the world. As of 2020, South Korea is the country with the world’s lowest total fertility rate - 0.84, Especially in Seoul - 0.64, probably the lowest level anywhere in the world.
Latin America[]
The TFR of Brazil, the most populous country in the region, was estimated at 1.68 in 2018.[7] The second most populous country, Mexico, had an estimated TFR of 2.22.[7] The next most populous four countries in the region had estimated TFRs of between 1.9 and 2.3 in 2018, including Colombia (1.98), Argentina (2.25), Peru (2.1), and Venezuela (2.3). Guatemala had the highest estimated TFR in the region at 2.87 in 2018; and Puerto Rico the lowest at 1.21.[7]
Europe[]
The average total fertility rate in the European Union (EU-27) is calculated at 1.55 children per woman in 2018.[30] France had the highest TFR in 2018 among EU countries at 1.88, followed by Romania and Sweden (1.76), Ireland (1.75) and Denmark (1.73).[30] Malta had the lowest TFR in 2018 among EU countries at 1.23.[30] Other southern European countries also had very low TFR (Portugal 1.38, Cyprus, 1.32, Greece 1.35, Spain 1.26, and Italy 1.29).[30] According to 2018 estimates for the non-EU European post-Soviet states group, Russia had a TFR of 1.61, Moldova 1.57, Ukraine 1.55, and Belarus 1.49.[7] Bosnia Herzegovina had the lowest estimated TFR in Europe in 2018, at 1.31.[7]
Emigration of young adults from Eastern Europe to the West aggravates the demographic problems of those countries. People from countries such as Ukraine, Moldova, Romania, and Bulgaria are particularly moving abroad.[44]
North America[]
United States[]


The total fertility rate in the United States after World War II peaked at about 3.8 children per woman in the late 1950s and by 1999 was at 2 children. The fertility rate of the total U.S. population was just below the replacement level in 1979.[45] Currently, the fertility is below replacement among those native born, and above replacement among immigrant families, most of whom come to the United States from countries with higher fertility. However, the fertility rate of immigrants to the United States has been found to decrease sharply in the second generation, correlating with improved education and income.[46] In 2020, U.S. TFR continued to decline, reaching 1.64.[47]
Canada[]
The TFR of Canada was 1.46 in 2020.[48]
Western Asia[]
In 2019, the TFR of Turkey reached 1.88.[49]
In the Iranian calendar year (March 2019- March 2020), Iran's total fertility rate fell to 1.8. [50]
See also[]
- List of sovereign states and dependencies by total fertility rate
- List of countries by past fertility rate
References[]
- ^ Total fertility rate definition from CIA world factbook. Cia.gov. Retrieved on 2012-09-17.
- ^ https://koreajoongangdaily.joins.com/2021/01/03/national/socialAffairs/population-decline-korea-aging-society/20210103165800619.html
- ^ https://www.indexmundi.com/niger/total_fertility_rate.html
- ^ UNdata: Total fertility rate (children per woman). esa.un.org. Retrieved 2012-09-17. Archived June 7, 2012, at the Wayback Machine
- ^ National Association for Public Health Statistics and Information Systems (NAPHSIS), "Statistical Measures and Definitions" [retrieved 16 June 2010].
- ^ "Country Comparison :: Population size". The World Factbook. Central Intelligence Agency. Retrieved 2017-05-30.
- ^ Jump up to: a b c d e f g h i j k l "Country Comparison :: Total Fertility Rate". The World Factbook. Central Intelligence Agency. Retrieved 2017-05-30.
- ^ "Country Comparison :: GDP - per capita (PPP)". The World Factbook. Central Intelligence Agency. Retrieved 2017-05-30.
- ^ Jump up to: a b "World Health Organization, Total Fertility Rate". SEARO. Retrieved 2019-08-15.
- ^ Espenshade TJ, Guzman JC, Westoff CF (2003). "The surprising global variation in replacement fertility". Population Research and Policy Review. 22 (5/6): 575. doi:10.1023/B:POPU.0000020882.29684.8e. S2CID 10798893.
- ^ Espenshade TJ, Guzman JC, Westoff CF (2003). "The surprising global variation in replacement fertility". Population Research and Policy Review. 22 (5/6). Introduction and Table 1, p. 580. doi:10.1023/B:POPU.0000020882.29684.8e. S2CID 10798893.
- ^ "European data" (PDF). www.ssc.upenn.edu. Retrieved 2020-01-27.
- ^ Goldstein, Joshua R.; Sobotka, Tomáš; Jasilioniene, Aiva (November 2019). "The End of 'Lowest-Low' Fertility?" (PDF). Max Planck Institute for Demographic Research. Retrieved 2020-01-27.
- ^ "Data" (PDF). www.rug.nl. Retrieved 2020-01-27.
- ^ Dore, Bhavya (2017). "Glimmer of hope at last for India's vanishing Parsis". BBC. Missing or empty
|url=(help) - ^ Namkee Ahn; Pedro Mira (2002). "A Note on the Changing Relationship between Fertility and Female Employment Rates in Developed Countries" (PDF). Journal of Population Economics. 15 (4): 667–682. doi:10.1007/s001480100078. JSTOR 20007839. S2CID 17755082.
- ^ Sanyal, Sanjeev (30 October 2011). "The End of Population Growth".
- ^ "World population projected to reach 9.8 billion in 2050, and 11.2 billion in 2100". UN DESA | United Nations Department of Economic and Social Affairs. 2017-06-21. Retrieved 2019-02-19.
- ^ Kligman, Gail. "Political Demography: The Banning of Abortion in Ceausescu's Romania". In Ginsburg, Faye D.; Rapp, Rayna, eds. Conceiving the New World Order: The Global Politics of Reproduction. Berkeley, CA: University of California Press, 1995 :234–255. Unique Identifier : AIDSLINE KIE/49442.
- ^ "Shock at Chinese abortion photo". BBC News. 14 June 2012.
- ^ "Mass sterilisation scandal shocks Peru". 24 July 2002 – via news.bbc.co.uk.
- ^ "Handbook" (PDF). www.ohchr.org. Retrieved 2020-01-27.
- ^ Murphy, Michael (2013). "Cross-National Patterns of Intergenerational Continuities in Childbearing in Developed Countries". Biodemography and Social Biology. 59 (2): 101–126. doi:10.1080/19485565.2013.833779. ISSN 1948-5565. PMC 4160295. PMID 24215254.
- ^ Hayford, S. R.; Morgan, S. P. (2008). "Religiosity and Fertility in the United States: The Role of Fertility Intentions". Social Forces. 86 (3): 1163–1188. doi:10.1353/sof.0.0000. PMC 2723861. PMID 19672317.
- ^ Lars Dommermuth; Jane Klobas; Trude Lappegård (2014). "Differences in childbearing by time frame of fertility intention. A study using survey and register data from Norway". Part of the research project Family Dynamics, Fertility Choices and Family Policy (FAMDYN)
- ^ Schaffnit, S. B.; Sear, R. (2014). "Wealth modifies relationships between kin and women's fertility in high-income countries". Behavioral Ecology. 25 (4): 834–842. doi:10.1093/beheco/aru059. ISSN 1045-2249.
- ^ Rai, Piyush Kant; Pareek, Sarla; Joshi, Hemlata (2013). "Regression Analysis of Collinear Data using r-k Class Estimator: Socio-Economic and Demographic Factors Affecting the Total Fertility Rate (TFR) in India" (PDF). Journal of Data Science. 11.
- ^ Bloom, David; Canning, David; Fink, Günther; Finlay, Jocelyn (2009). "Fertility, female labor force participation, and the demographic dividend". Journal of Economic Growth. 14 (2): 79–101. doi:10.1007/s10887-009-9039-9.
- ^ Sato, Yasuhiro (30 July 2006), "Economic geography, fertility and migration" (PDF), Journal of Urban Economics, archived from the original (PDF) on 2016-02-06, retrieved 31 March 2008
- ^ Jump up to: a b c d e Eurostat (May 2020). "Fertility statistics". ec.europa.eu.
- ^ Terrell, Heather Kathleen Mary, "Fertility in China in 2000: A County-Level Analysis Archived 2007-06-16 at the Wayback Machine" (2005), Texas A&M University.
- ^ [1], Nigeria TFR 2018
- ^ [2], CIA World Factbook 2018 Estimated TFR.
- ^ "WHO - Family planning in sub-Saharan Africa: progress or stagnation?". www.who.int.
- ^ [3], niti.gov.in Total Fertility Rate 2000-2016.
- ^ https://timesofindia.indiatimes.com/india/better-education-of-women-helped-push-total-fertility-rate-down/articleshow/76720789.cms
- ^ [4], India Times July 15, 2019.
- ^ https://www.newagebd.net/article/109937/fertility-rate-in-bangladesh-20-life-expectancy-73yrs
- ^ Rapoza, Kenneth (February 21, 2017). "China's Aging Population Becoming More Of A Problem". Forbes. Retrieved 2019-05-10.
- ^ "Info". www.ft.com. Retrieved 2020-01-27.
- ^ Sang-Hun, Choe (2016-12-30). "South Korea's Plan to Rank Towns by Fertility Rate Backfires". The New York Times. ISSN 0362-4331. Retrieved 2019-08-15.
- ^ "Childbirth drops 10.4% in April". yna.co.kr.
- ^ Kwon, Jake (2019-08-29). "South Korea's fertility rate falls to record low - CNN". Edition.cnn.com. Retrieved 2020-01-27.
- ^ "Central and Eastern Europe Face Emigration Challenge". Stratfor.
- ^ "Fertility rate, total (births per woman) - Data".
- ^ "How Fertility Changes Across Immigrant Generations." Research Brief #58, Public Policy Institute of California, 2002.
- ^ "Expect a baby bust, not a boom, from the coronavirus pandemic". Washington Post. 2020-06-16. Retrieved 2020-07-13.
- ^ https://www150.statcan.gc.ca/t1/tbl1/en/tv.action?pid=1310041801
- ^ ["Late marriages, late births: Turkish population below replacement level".
- ^ ["Iran's demographic issue: fertility reaches lowest rate in 8 years".
Sources[]
- Bulatao, Rodolfo (1984). Reducing Fertility in Developing Countries. Washington, D.C.: World Bank. ISBN 978-0-8213-0444-0.
External links[]
- World Factbook table of Total Fertility Rate ordered by country rank
- Eurostat – Statistics Explained: Fertility statistics (data October 2011)
- Population Reference Bureau Glossary of Population Terms
- Java Simulation of Total Fertility.
- Java Simulation of Population Dynamics.
- How Fertility Changes Across Immigrant Generations.
- Fertility Trends, Marriage Patterns and Savant Typologies.
- Human Fertility Database: Collection of age specific fertility rates for some developed countries.
- Human overpopulation
- Fertility
- Rates