Demographics of Estonia
| Demographics of Estonia | ||
|---|---|---|
| Indicator | Rank | Measure |
| Population | ||
| Population | 152nd | 1,330,068 |
| Economy | ||
| GDP (PPP) per capita | 39th | $35,852 |
| GDP | 103rd | $31.038 billion |
| Unemployment rate | ↓ 67th | 5.9% |
| CO2 emissions | 22nd | 11.9 t† |
| Electricity consumption | 97th | 7.4 TWh |
| Economic freedom | 10th | 7.95 |
| Politics | ||
| Human Development Index | 30th | 0.882 |
| Political freedom | 1st (equal)* | 1 |
| Press freedom | 11th | 9.63 |
| Society | ||
| Literacy Rate | 3rd | 99.8% |
| Broadband uptake | 78th | 25.7% |
| Beer consumption | 4th[1] | 102.4 L† |
| Health | ||
| Life Expectancy | 40th | 77.6 |
| Birth rate | 188th | 10.29‡ |
| Fertility rate | 183th | 1.7†† |
| Infant mortality | 27th | 4.68‡‡ |
| Death rate | 13th | 13.69‡ |
| Suicide Rate | 38th | ♂ 24.9†‡ ♀ 3.8†‡ |
| HIV/AIDS rate | 130th | 1.3% |
| Notes | ||


The demographics of Estonia in the twenty-first century result from historical trends over more than a thousand years, as with most European countries, but have been disproportionately influenced by events in the last half of the twentieth century. The rise and fall of the Soviet Union, including the annexation and eventual independence of Estonia, has had a major effect on Estonia's ethnic makeup and educational achievement.
Languages spoken in Estonia largely reflect the ethnic groups composing the country, and thus have changed with historical trends affecting the ethnic makeup of the country. Religion plays a small part in the lives of most Estonians,[2][3] largely as a result of the Soviet occupation from 1944 to 1991.[4]
Overall, the quality-of-life indices for Estonia indicate a modern industrial state. The population declined annually from 1991 until 2016, except for a brief pause in 2010.[5] Since 2016 immigration has exceeded emigration, making the overall population grow.[6]
| Year | Pop. | ±% |
|---|---|---|
| 1881 | 881,455 | — |
| 1897 | 958,351 | +8.7% |
| 1922 | 1,107,059 | +15.5% |
| 1934 | 1,126,413 | +1.7% |
| 1941 | 1,017,475 | −9.7% |
| 1959 | 1,196,791 | +17.6% |
| 1970 | 1,356,079 | +13.3% |
| 1979 | 1,464,476 | +8.0% |
| 1989 | 1,565,662 | +6.9% |
| 2000 | 1,370,052 | −12.5% |
| 2011 | 1,294,455 | −5.5% |
| 2021 | 1,330,068 | +2.8% |
| Source:[7] [8] | ||
Population[]


- Number of births
- Number of deaths
- Natural population increase

The population increased from 1,351,640 in January 1970 to 1,570,599 in January 1990. After 1990, Estonia lost about 15% of its population (230,000 people). The population decreased to 1,294,455 by December 2011, a figure lower than that recorded in 1970.
- 1,294,455 (2011 Population Count and Housing Census) [11]
- 1,370,052 (2000 Population Count and Housing Census) [12]
Decreasing population pressures are explained by a higher death than birth rate and periods of an excess of emigrants over immigrants.
Since 2015 the country has experienced population growth.[13] The population mainly increased as a result of net immigration of European Union citizens.[14] Citizens of Russia and Ukraine made up the bulk of non-EU immigration.[15] The increase was detected through methodological changes in data collection. Initially a population decrease had been reported.[16]
Age structure[]

Between 1970 and 1990 the age structure of Estonia was rather stable with around 22% of the population in the age group 0–14 years, 66% between 15 and 65, while 12% were 65 years or older.[5] Due to the low birth rates after 1990, the proportion of the population 0–14 years of age dropped to 15% in 2009, while the proportion of 65 years or older gradually increased to 17% in 2009. The proportion of the age group 15–64 also slightly increased to 68% in 2009.
Births and deaths[]
From 1947–1989 the number of births was higher than the number of deaths, but from 1990 onwards the number of deaths outnumbered the number of births. The crude birth rate of 2011 was 10.96 (14,679 births) and the crude death rate of 2011 was 11.38 (15,244 deaths), making the rate of natural increase −0.42 (−565).[9] For more detailed historic data, see the table of birth and death rates below.
Total fertility rate[]
Between 1970 and 1990, the total fertility rate (TFR) was little over 2 children born per woman.[17] A fast decrease of the TFR occurred after independence. In 1998 the lowest rate was recorded: 1.28 children born per woman. The TFR slightly recovered in the subsequent years. The TFR was 1.66 in 2008 and 1.52 in 2011.
Infant mortality rate[]
The infant mortality rate in Estonia has decreased considerably during the past decades. In 1970 the rate was 17.7 per 1,000 live births.[17] The rate decreased to 17.1 in 1980, 12.3 in 1990 and 8.4 in 2000. The lowest infant mortality rate was recorded in 2011: 2.6.
Life expectancy at birth[]
Life expectancy in Estonia is lower than in most Western European countries. During the Soviet era life expectancy in males was between 64 and 66 years and in females between 73 and 75 years.[17] After the independence, life expectancy decreased for a number of years. In 1994, the lowest life expectancy was recorded: 60.5 years in males and 72.8 in females. After 1994, life expectancy gradually increased to reach 68.3 years in males and 79.2 in females in 2012.[18]
| Period | Life expectancy in Years[19] |
|---|---|
| 1950–1955 | 61.77 |
| 1955–1960 | |
| 1960–1965 | |
| 1965–1970 | |
| 1970–1975 | |
| 1975–1980 | |
| 1980–1985 | |
| 1985–1990 | |
| 1990–1995 | |
| 1995–2000 | |
| 2000–2005 | |
| 2005–2010 | |
| 2010–2015 | |
| 2020 |
By data from Statistics Estonia life expectancy at birth in both 2019 and 2020 was 74.4 years for males and 82.8 years for females, on average for all 78,8 years.[20] Life expectancy has increased during last years for both sexes, men are expected to live disability-free for 54.1 years and women for 57.6 years. Males live 72.7 percent of their life in good health and females 70 percent.[21]
For comparing, in 2018 the average life expectancy for men in Europe was 78.3 years and for women 83.6 years.[22]
Migration[]
As the cumulative negative natural growth was about 82,000 during 1991-2010, the remainder of the population decline of Estonia since 1990 (230,000 people in total) was caused by emigration (150,000 people or about 10% of the population of Estonia in 1990). Mainly ethnic Russians, Ukrainians and Belarusians emigrated. Consequently, the proportion of these ethnic groups decreased as can be seen in the results of the 2000 census (see below). Data from 2000–2009 also shows that the number of emigrants is larger than the number of immigrants, but on a much lower lever than in the 1990s.[10]
Foreign-born population in 2017 and 2020:
| Country of birth | 2017[23] | 2020[23] | ||
|---|---|---|---|---|
| Number | % | Number | % | |
| 122,920 | 9.34 | 115,890 | 8.72 | |
| 22,713 | 1.73 | 24,996 | 1.88 | |
| 10,698 | 0.81 | 10,355 | 0.78 | |
| 4,913 | 0.37 | 6,094 | 0.46 | |
| 4,658 | 0.35 | 6,037 | 0.45 | |
| 3,726 | 0.28 | 3,760 | 0.28 | |
| 1,984 | 0.15 | 2,380 | 0.18 | |
| 2,059 | 0.16 | 2,090 | 0.16 | |
| 1,683 | 0.13 | 1,769 | 0.13 | |
| 1,486 | 0.11 | 1,688 | 0.13 | |
| Other countries | 15,721 | 1.21 | 23,983 | 1.81 |
| Foreign-born total | 192,561 | 14.64 | 199,042 | 14.98 |
| 1,123,074 | 85.36 | 1,129,934 | 85.02 | |
| Population total | 1,315,635 | 100.00 | 1,328,976 | 100.00 |
There were a total of 199,042 foreign-born people in Estonia at 1 January 2020, representing 15% of the population. 58% of them were born in Russia, and a total of 85% in a ex-Soviet country.
Ethnic groups[]
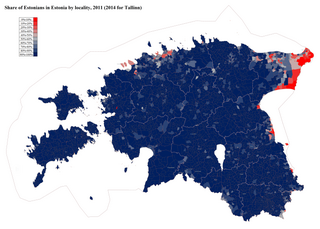
Today, Estonia is an ethnically fairly diverse country, ranking 97th out of 239 countries and territories in 2001 study by Kok Kheng Yeoh.[24] In 2008, thirteen of Estonia's fifteen counties were over 80% ethnic Estonian. The counties with the highest percentage Estonians are Hiiu County (98.4%) and Saare County (98.3%). However, in Harju County (which includes the national capital, Tallinn) and Ida-Viru County, ethnic Estonians make up only 59.6% (55.0% in Tallinn) and 19.7% of the population, respectively. In those two counties, Russians account for 32.4% (36.4% in Tallinn) and 71.2% of the population, respectively. In the nation as a whole, Russians make up 24.8% of the total population.[25]
After gaining independence following World War I a population census was held in 1922 and 1934. At that time Estonians were still the predominant ethnic group, while all others constituted 12% of the population of Estonia.
Major Jewish communities were present in Estonia between 1918 and 1940 in Tallinn, Pärnu, Kilingi-Nõmme, Narva, Tartu, Valga, and Võru.[26]
Population of Estonia by ethnic group 1897–2021
| Ethnic group |
census 1897[27] | census 19221 | census 19341 | census 19592 | census 19703 | census 19794 | census 19895 | census 20006 | census 2011[28] | statistics 2021[29] | ||||||||||
|---|---|---|---|---|---|---|---|---|---|---|---|---|---|---|---|---|---|---|---|---|
| Number | % | Number | % | Number | % | Number | % | Number | % | Number | % | Number | % | Number | % | Number | % | Number | % | |
| Estonians | 867,794 | 90.6 | 969,976 | 87.6 | 992,520 | 88.1 | 892,653 | 74.6 | 925,157 | 68.2 | 947,812 | 64.7 | 963,281 | 61.5 | 930,219 | 67.9 | 902,547 | 69.7 | 914,896 | 68.8 |
| Russians | 37,599 | 3.9 | 91,109 | 8.2 | 92,656 | 8.2 | 240,227 | 20.1 | 334,620 | 24.7 | 408,778 | 27.9 | 474,834 | 30.3 | 351,178 | 25.6 | 326,235 | 25.2 | 322,700 | 24.2 |
| Ukrainians | 504 | 0.1 | — | 92 | 0.0 | 15,769 | 1.3 | 28,086 | 2.1 | 36,044 | 2.5 | 48,271 | 3.1 | 29,012 | 2.1 | 22,573 | 1.7 | 27,254 | 2.0 | |
| Belarusians | 272 | 0.0 | — | — | 10,930 | 0.9 | 18,732 | 1.4 | 23,461 | 1.6 | 27,711 | 1.8 | 17,241 | 1.3 | 12,579 | 1.0 | 11,485 | 0.8 | ||
| Finns | 362 | 0.0 | 401 | 0.0 | 1,088 | 0.1 | 16,699 | 1.4 | 18,537 | 1.4 | 17,753 | 1.2 | 16,622 | 1.1 | 11,837 | 0.9 | 7,589 | 0.6 | 8,479 | 0.6 |
| Latvians | 5,470 | 0.6 | 1,966 | 0.2 | 5,435 | 0.5 | 2,888 | 0.2 | 3,286 | 0.2 | 3,963 | 0.3 | 3,135 | 0.2 | 2,330 | 0.2 | 1,764 | 0.1 | 3,572 | 0.3 |
| Germans | 33,362 | 3.5 | 18,319 | 1.7 | 16,346 | 1.5 | 670 | 0.1 | 7,850 | 0.6 | 3,944 | 0.3 | 3,466 | 0.2 | 1,870 | 0.1 | 1,544 | 0.1 | 2,570 | 0.2 |
| Lithuanians | 44 | 0.0 | 436 | 0.0 | 253 | 0.0 | 1,616 | 0.1 | 2,356 | 0.2 | 2,379 | 0.2 | 2,568 | 0.2 | 2,116 | 0.2 | 1,727 | 0.1 | 2,057 | 0.1 |
| Tatars | 36 | 0.0 | — | 166 | 0.0 | 1,534 | 0.1 | 2,204 | 0.2 | 3,195 | 0.2 | 4,058 | 0.3 | 2,582 | 0.2 | 1,993 | 0.2 | 1,937 | 0.1 | |
| Jews | 3,837 | 0.4 | 4,566 | 0.4 | 4,434 | 0.4 | 5,433 | 0.5 | 5,282 | 0.4 | 4,954 | 0.3 | 4,613 | 0.3 | 2,145 | 0.2 | 1,973 | 0.2 | 1,898 | 0.1 |
| Poles | 1,941 | 0.2 | 969 | 0.1 | 1,608 | 0.1 | 2,256 | 0.2 | 2,651 | 0.2 | 2,897 | 0.2 | 3,008 | 0.2 | 2,193 | 0.2 | 1,664 | 0.1 | 1,745 | 0.1 |
| Swedes | 6,083 | 0.6 | 7,850 | 0.7 | 7,641 | 0.7 | — | 435 | 0.0 | 254 | 0.0 | 297 | 0.0 | 300 | 0.0 | 380 | 0.0 | — | ||
| Other | 1,047 | 0.1 | 11,467 | 1.0 | 4,266 | 0.4 | 6,116 | 0.5 | 6,883 | 0.5 | 9,042 | 0.6 | 13,798 | 0.9 | 19,174 | 1.4 | 11,887 | 0.9 | 24 336 | 1.8 |
| Total | 958,351 | 1,107,059 | 1,126,413 | 1,196,791 | 1,356,079 | 1,464,476 | 1,565,662 | 1,370,052 | 1,294,455 | 1 330 068 | ||||||||||
As a result of the Soviet occupation from 1944 to 1991 and Soviet policies, the share of ethnic Estonians in the population resident within currently defined boundaries of Estonia dropped to 61.5% in 1989, compared to 88% in 1934.[30] But in the decade following the restoration of independence, large scale emigration by ethnic Russians, as well as ethnic groups of other former Soviet countries, and the removal of the Russian military bases in 1994 caused the proportion of ethnic Estonians in Estonia to increase from 61.5% in 1989 to 68.7% in 2008. In the same period the proportion of ethnic Russians decreased from 30.0% to 25.6%, the proportion of ethnic Ukrainians decreased from 3.1% to 2.1%, and the proportion of ethnic Belarusians decreased from 1.8% to 1.2%.[25][30]


As of 2008, the largest ethnic groups in Estonia are Estonians (68.7%), Russians (25.6%), Ukrainians (2.1%), Belarusians (1.2%), and Finns (0.8%). These five groups made up 98.4% of Estonia's population.[25]
Languages[]


Many languages are spoken in Estonia, including Estonian (official), Võro, Russian, Ukrainian, English, Finnish, German and others. According to the census of 2000, 109 languages were spoken natively in Estonia. By 2011, the number of languages spoken natively had increased to 157, mainly due to new immigrants. However, most of these languages were used only between relatives or compatriots, while only 30 languages were spoken on a daily basis in families.[32]
Estonian and Finnish are closely related, belonging to the same Finnic branch of the Uralic language family. The two languages are only partially mutually intelligible, although learning to comprehend and speak each other's languages is fairly easy for native speakers. Estonian and Finnish are only distantly related to the Hungarian language.
Written with the Latin script, Estonian is the language of the Estonian people and the official language of the country. One-third of the standard vocabulary is derived from adding suffixes to root words. The oldest known examples of written Estonian originate in 13th century chronicles. During the Soviet era, the Russian language was imposed in parallel to, and often instead of, Estonian in official use.
| Language | 2000 census[33] | 2011 census[28] | ||
|---|---|---|---|---|
| Number | % | Number | % | |
| Estonian | 921,817 | 67.28 | 887,216 | 68.54 |
| Russian | 406,755 | 29.69 | 383,118 | 29.60 |
| Ukrainian | 12,299 | 0.90 | 8,016 | 0.62 |
| Finnish | 4,932 | 0.36 | 2,621 | 0.20 |
| Belarusian | 5,197 | 0.38 | 1,664 | 0.13 |
| Latvian | 1,389 | 0.10 | 999 | 0.08 |
| Lithuanian | 1,198 | 0.09 | 905 | 0.07 |
| English | 248 | 0.02 | 878 | 0.07 |
| Tatar | 1,251 | 0.09 | 806 | 0.06 |
| Armenian | 719 | 0.05 | 717 | 0.06 |
| Azerbaijani | 592 | 0.04 | 656 | 0.05 |
| German | 557 | 0.04 | 522 | 0.04 |
| Polish | 674 | 0.05 | 435 | 0.03 |
| Other | 3,235 | 0.24 | 2,891 | 0.22 |
| Unknown | 9,189 | 0.67 | 1,723 | 0.13 |
| Total | 1,370,052 | 1,294,455 | ||
Population of Estonia by second language
| Language | 2000 census[33] | 2011 census[28] | ||
|---|---|---|---|---|
| Number | % | Number | % | |
| Russian | 578,004 | 42.1 | 545,537 | 41.5 |
| English | 345,854 | 25.2 | 495,420 | 37.8 |
| Finnish | 138,354 | 10 | 167,315 | 12.7 |
| German | 140,004 | 10.2 | 130,191 | 10.0 |
| French | 9,912 | 0.7 | 18,677 | 1.4 |
| Swedish | 9,345 | 0.6 | 13,990 | 1.1 |
Religion[]
Religion in Estonia (2011)[34] [35]


According to the most recent Eurobarometer Poll 2010,[36] 18% of Estonian citizens responded that "they believe there is a God", whereas 50% answered that "they believe there is some sort of spirit or life force" and 29% that "they do not believe there is any sort of spirit, god, or life force". This, according to the survey, would have made Estonians the most non-religious people in the then 25-member European Union. A survey conducted in 2006–2008 by Gallup showed that 14% of Estonians answered positively to the question: "Is religion an important part of your daily life?", which was the lowest among 143 countries polled.[37]
In 2000, according to the census, 29.2% of the population considered themselves to be related to any religion, thereof:[38]
- 13.6% Lutheran Christians
- 12.8% Orthodox Christians
- 6,009 Baptists
- 5,745 Roman Catholics
- 4,254 Jehovah's Witnesses
- 2,648 Pentecostals
- 2,515 Old Believers
- 1,561 Adventists
- 1,455 Methodists
- 1,387 Muslims
- 5,008 followers of other religions
There are also a number of smaller Protestant, Jewish, and Buddhist groups. The organisation Maavalla Koda (Taaraism) unites adherents of animist traditional religions.[39][40] The Russian neopagan organisation "Vene Rahvausu Kogudus Eestis" is registered in Tartu.[41]
The irrereligiousity of Estonians is a relic of Soviet occupation time, but culturally Estonia still belongs to the Lutheran culture sphere, like most of Northern Europe.
Vital statistics[]
Vital statistics for the Governorate of Estonia[]
The Governorate of Estonia comprised the northern part of present-day Estonia. The southern part was part of the Governorate of Livonia.[42]
| Average population | Live births | Deaths | Natural change | Crude birth rate (per 1000) | Crude death rate (per 1000) | Natural change (per 1000) | |
|---|---|---|---|---|---|---|---|
| 1900 | 428,000 | 12,487 | 8,227 | 4,260 | 29.2 | 19.2 | 10.0 |
| 1901 | 430,000 | 12,703 | 8,428 | 4,275 | 29.5 | 19.6 | 9.9 |
| 1902 | 434,000 | 13,101 | 7,724 | 5,377 | 30.2 | 17.8 | 12.4 |
| 1903 | 440,000 | 12,704 | 8,004 | 4,700 | 28.9 | 18.2 | 10.7 |
| 1904 | 446,000 | 12,753 | 8,279 | 4,474 | 28.6 | 18.6 | 10.0 |
| 1905 | 449,000 | 11,991 | 9,694 | 2,297 | 26.7 | 21.6 | 5.1 |
| 1906 | 452,000 | 12,417 | 8,842 | 3,575 | 27.4 | 19.5 | 7.9 |
| 1907 | 455,000 | 12,304 | 8,730 | 3,574 | 27.0 | 19.2 | 7.9 |
| 1908 | 459,000 | 11,861 | 8,495 | 3,366 | 25.8 | 18.5 | 7.3 |
| 1909 | 464,000 | 11,970 | 8,297 | 3,673 | 25.8 | 17.9 | 7.9 |
| 1910 | 466,000 | 12,193 | 8,204 | 3,989 | 26.2 | 17.6 | 8.6 |
| 1911 | 472,000 | 11,749 | 8,976 | 2,773 | 24.9 | 19.0 | 5.9 |
| 1912 | 480,000 | 11,900 | 8,431 | 3,469 | 24.8 | 17.6 | 7.2 |
| 1913 | 491,000 | 11,653 | 9,089 | 2,564 | 23.7 | 18.5 | 5.2 |
| 1914 | 506,000 | 11,854 | 9,212 | 2,642 | 23.4 | 18.2 | 5.2 |
Present Estonia[]
Source: Statistics Estonia[43]
| Average population | Live births | Deaths | Natural change | Crude birth rate (per 1000) | Crude death rate (per 1000) | Natural change (per 1000) | Total fertility rate | Infant mortality rate | |
|---|---|---|---|---|---|---|---|---|---|
| 1914 | 1,197,000 | 26,865 | 20,882 | 5,983 | 22.4 | 17.4 | 5.0 | ||
| 1915 | 1,188,000 | 24,680 | 21,841 | 2,839 | 20.8 | 18.4 | 2.4 | ||
| 1916 | 1,154,000 | 21,282 | 25,429 | −4,147 | 18.4 | 22.0 | −3.6 | ||
| 1917 | 1,120,000 | 18,333 | 27,336 | −9,003 | 16.4 | 24.4 | −8.0 | ||
| 1918 | 1,086,000 | 21,659 | 32,488 | −10,829 | 19.9 | 29.9 | −10.0 | ||
| 1919 | 1,064,000 | 18,456 | 28,800 | −10,344 | 17.3 | 27.1 | −9.7 | ||
| 1920 | 1,068,000 | 19,625 | 21,363 | −1,738 | 18.4 | 20.0 | −1.6 | ||
| 1921 | 1,087,000 | 22,067 | 17,143 | 4,924 | 20.3 | 15.8 | 4.5 | ||
| 1922 | 1,102,000 | 22,255 | 18,401 | 3,854 | 20.2 | 16.7 | 3.5 | ||
| 1923 | 1,111,000 | 22,347 | 16,630 | 5,717 | 20.1 | 15.0 | 5.1 | ||
| 1924 | 1,116,000 | 21,441 | 16,918 | 4,523 | 19.2 | 15.2 | 4.1 | 99.9 | |
| 1925 | 1,117,000 | 20,445 | 16,680 | 3,765 | 18.3 | 14.9 | 3.4 | 95.7 | |
| 1926 | 1,117,000 | 19,977 | 18,047 | 1,900 | 17.9 | 16.2 | 1.7 | 101.8 | |
| 1927 | 1,116,000 | 19,705 | 19,356 | 500 | 17.7 | 17.3 | 0.4 | 114.6 | |
| 1928 | 1,116,000 | 20,064 | 17,785 | 2,279 | 18.0 | 15.9 | 2.0 | 103.6 | |
| 1929 | 1,116,000 | 19,110 | 20,178 | −1,068 | 17.1 | 18.1 | −1.0 | 110.5 | |
| 1930 | 1,116,000 | 19,471 | 16,610 | 2,861 | 17.4 | 14.9 | 2.6 | 100.1 | |
| 1931 | 1,118,000 | 19,509 | 18,077 | 1,432 | 17.4 | 16.2 | 1.3 | 102.8 | |
| 1932 | 1,122,000 | 19,742 | 16,641 | 3,101 | 17.6 | 14.8 | 2.8 | 96.8 | |
| 1933 | 1,124,000 | 18,208 | 16,472 | 1,736 | 16.2 | 14.7 | 1.5 | 94.0 | |
| 1934 | 1,126,000 | 17,305 | 15,853 | 1,452 | 15.4 | 14.1 | 1.3 | 91.1 | |
| 1935 | 1,129,000 | 17,891 | 16,864 | 1,027 | 15.8 | 14.9 | 0.9 | 89.3 | |
| 1936 | 1,130,000 | 18,222 | 17,594 | 628 | 16.1 | 15.6 | 0.6 | 89.2 | |
| 1937 | 1,131,000 | 18,190 | 16,614 | 1,576 | 16.1 | 14.7 | 1.4 | 90.7 | |
| 1938 | 1,133,000 | 18,453 | 16,496 | 1,957 | 16.3 | 14.6 | 1.7 | 77.5 | |
| 1939 | 1,128,000 | 18,475 | 17,101 | 1,374 | 16.4 | 15.2 | 1.2 | 78.8 | |
| 1940 | 1,096,000 | 18,407 | 19,024 | −617 | 16.8 | 17.4 | −0.6 | 83.7 | |
| 1941 | 1,044,000 | 19,574 | 23,702 | −4,128 | 18.8 | 22.7 | −4.0 | ||
| 1942 | 1,017,000 | 19,242 | 20,276 | −1,034 | 18.9 | 19.9 | −1.0 | 91.8 | |
| 1943 | 1,006,000 | 16,001 | 18,120 | −2,119 | 15.9 | 18.0 | −2.1 | ||
| 1944 | 990,000 | 15,180 | 24,700 | −9,520 | 15.3 | 24.9 | −9.6 | ||
| 1945 | 879,000 | 14,968 | 20,708 | −5,740 | 17.0 | 23.6 | −6.5 | 124.8 | |
| 1946 | 928,000 | 19,408 | 19,969 | −561 | 20.9 | 21.5 | −0.6 | 96.8 | |
| 1947 | 977,000 | 22,721 | 21,492 | 1,229 | 23.3 | 22.0 | 1.3 | 121.4 | |
| 1948 | 1,026,000 | 21,777 | 17,549 | 4,228 | 21.2 | 17.1 | 4.1 | 84.2 | |
| 1949 | 1,074,000 | 21,770 | 16,730 | 5,040 | 20.3 | 15.6 | 4.7 | 82.4 | |
| 1950 | 1,101,000 | 20,279 | 15,817 | 4,462 | 18.4 | 14.4 | 4.1 | 81.2 | |
| 1951 | 1,114,000 | 20,730 | 15,354 | 5,376 | 18.6 | 13.7 | 4.8 | 76.2 | |
| 1952 | 1,126,000 | 21,111 | 15,817 | 5,294 | 18.7 | 14.0 | 4.7 | 64.9 | |
| 1953 | 1,138,000 | 20,146 | 14,420 | 5,726 | 17.7 | 12.7 | 5.0 | 52.2 | |
| 1954 | 1,149,000 | 20,909 | 13,981 | 6,928 | 18.2 | 12.2 | 6.0 | 49.5 | |
| 1955 | 1,160,000 | 20,786 | 13,638 | 7,148 | 17.9 | 11.8 | 6.2 | 51.6 | |
| 1956 | 1,171,000 | 19,660 | 12,748 | 6,912 | 16.8 | 10.9 | 5.9 | 41.2 | |
| 1957 | 1,181,000 | 19,509 | 13,026 | 6,483 | 16.5 | 11.0 | 5.5 | 40.1 | |
| 1958 | 1,192,000 | 19,598 | 12,971 | 6,627 | 16.4 | 10.9 | 5.6 | 39.9 | |
| 1959 | 1,203,000 | 19,938 | 13,130 | 6,808 | 16.5 | 10.9 | 5.7 | 31.7 | |
| 1960 | 1,216,000 | 20,187 | 12,738 | 7,449 | 16.6 | 10.5 | 6.1 | 1.95 | 31.1 |
| 1961 | 1,229,000 | 20,230 | 13,036 | 7,194 | 16.5 | 10.6 | 5.9 | 1.97 | 28.0 |
| 1962 | 1,243,000 | 19,959 | 13,495 | 6,464 | 16.1 | 10.9 | 5.2 | 1.95 | 25.2 |
| 1963 | 1,258,000 | 19,275 | 13,251 | 6,024 | 15.3 | 10.5 | 4.8 | 1.91 | 26.0 |
| 1964 | 1,276,000 | 19,629 | 12,754 | 6,875 | 15.4 | 10.0 | 5.4 | 1.94 | 25.4 |
| 1965 | 1,291,000 | 18,909 | 13,520 | 5,389 | 14.6 | 10.5 | 4.2 | 1.90 | 20.3 |
| 1966 | 1,303,000 | 18,629 | 13,800 | 4,829 | 14.3 | 10.6 | 3.7 | 1.85 | 20.0 |
| 1967 | 1,314,000 | 18,671 | 13,699 | 4,972 | 14.2 | 10.4 | 3.8 | 1.86 | 19.2 |
| 1968 | 1,327,000 | 19,782 | 14,225 | 5,557 | 14.9 | 10.7 | 4.2 | 2.03 | 18.0 |
| 1969 | 1,345,000 | 20,781 | 15,150 | 5,631 | 15.5 | 11.3 | 4.2 | 2.11 | 16.7 |
| 1970 | 1,360,000 | 21,552 | 15,186 | 6,366 | 15.8 | 11.2 | 4.7 | 2.16 | 17.7 |
| 1971 | 1,377,000 | 22,118 | 15,038 | 7,080 | 16.1 | 10.9 | 5.1 | 2.19 | 17.5 |
| 1972 | 1,393,000 | 21,757 | 15,520 | 6,237 | 15.6 | 11.1 | 4.5 | 2.14 | 15.9 |
| 1973 | 1,406,000 | 21,239 | 15,573 | 5,666 | 15.1 | 11.1 | 4.0 | 2.07 | 15.9 |
| 1974 | 1,418,000 | 21,461 | 15,393 | 6,068 | 15.1 | 10.9 | 4.3 | 2.07 | 17.6 |
| 1975 | 1,429,000 | 21,360 | 16,572 | 4,788 | 14.9 | 11.6 | 3.4 | 2.04 | 18.2 |
| 1976 | 1,440,000 | 21,801 | 17,351 | 4,450 | 15.1 | 12.0 | 3.1 | 2.06 | 17.5 |
| 1977 | 1,450,000 | 21,977 | 17,094 | 4,883 | 15.2 | 11.8 | 3.4 | 2.06 | 17.5 |
| 1978 | 1,460,000 | 21,842 | 17,812 | 4,030 | 15.0 | 12.2 | 2.8 | 2.02 | 16.5 |
| 1979 | 1,468,000 | 21,879 | 18,062 | 3,817 | 14.9 | 12.3 | 2.6 | 2.01 | 18.3 |
| 1980 | 1,477,000 | 22,204 | 18,199 | 4,005 | 15.0 | 12.3 | 2.7 | 2.02 | 17.1 |
| 1981 | 1,488,000 | 22,937 | 18,349 | 4,588 | 15.4 | 12.3 | 3.1 | 2.07 | 17.0 |
| 1982 | 1,498,000 | 23,128 | 17,893 | 5,235 | 15.4 | 11.9 | 3.5 | 2.08 | 17.2 |
| 1983 | 1,509,000 | 24,155 | 18,190 | 5,965 | 16.0 | 12.1 | 4.0 | 2.16 | 16.1 |
| 1984 | 1,519,000 | 24,234 | 19,086 | 5,148 | 16.0 | 12.6 | 3.4 | 2.17 | 13.6 |
| 1985 | 1,529,000 | 23,630 | 19,343 | 4,287 | 15.5 | 12.7 | 2.8 | 2.12 | 14.1 |
| 1986 | 1,540,000 | 24,106 | 17,986 | 6,120 | 15.7 | 11.7 | 4.0 | 2.17 | 15.9 |
| 1987 | 1,552,000 | 25,086 | 18,279 | 6,807 | 16.2 | 11.8 | 4.4 | 2.26 | 16.0 |
| 1988 | 1,562,000 | 25,060 | 18,551 | 6,509 | 16.0 | 11.9 | 4.2 | 2.26 | 12.4 |
| 1989 | 1,568,000 | 24,318 | 18,536 | 5,762 | 15.5 | 11.8 | 3.7 | 2.22 | 14.8 |
| 1990 | 1,569,000 | 22,304 | 19,531 | 2,778 | 14.2 | 12.4 | 1.8 | 2.05 | 12.3 |
| 1991 | 1,561,000 | 19,413 | 19,715 | −302 | 12.4 | 12.6 | −0.2 | 1.80 | 13.3 |
| 1992 | 1,533,000 | 18,038 | 20,126 | −2,088 | 11.8 | 13.1 | −1.4 | 1.71 | 15.7 |
| 1993 | 1,494,000 | 15,253 | 21,286 | −6,033 | 10.2 | 14.2 | −4.0 | 1.49 | 15.6 |
| 1994 | 1,463,000 | 14,176 | 22,212 | −8,036 | 9.7 | 15.2 | −5.5 | 1.42 | 14.4 |
| 1995 | 1,437,000 | 13,509 | 20,828 | −7,319 | 9.4 | 14.5 | −5.1 | 1.38 | 14.9 |
| 1996 | 1,416,000 | 13,242 | 19,020 | −5,778 | 9.4 | 13.4 | −4.1 | 1.37 | 10.5 |
| 1997 | 1,400,000 | 12,577 | 18,572 | −5,995 | 9.0 | 13.3 | −4.3 | 1.32 | 10.0 |
| 1998 | 1,386,000 | 12,167 | 19,445 | −7,278 | 8.8 | 14.0 | −5.3 | 1.28 | 9.4 |
| 1999 | 1,376,000 | 12,425 | 18,447 | −6,022 | 9.0 | 13.4 | −4.4 | 1.32 | 9.6 |
| 20001 | 1,397,000 | 13,067 | 18,403 | −5,336 | 9.4 | 13.2 | −3.8 | 1.35 | 8.4 |
| 2001 | 1,388,000 | 12,632 | 18,516 | −5,884 | 9.1 | 13.2 | −4.2 | 1.31 | 8.8 |
| 2002 | 1,379,000 | 13,001 | 18,355 | −5,354 | 9.4 | 13.3 | −3.9 | 1.36 | 5.7 |
| 2003 | 1,371,000 | 13,036 | 18,152 | −5,116 | 9.5 | 13.2 | −3.7 | 1.36 | 7.0 |
| 2004 | 1,363,000 | 13,992 | 17,685 | −3,693 | 10.3 | 13.0 | −2.7 | 1.47 | 6.4 |
| 2005 | 1,355,000 | 14,350 | 17,316 | −2,966 | 10.6 | 12.8 | −2.2 | 1.52 | 5.4 |
| 2006 | 1,347,000 | 14,877 | 17,316 | −2,439 | 11.0 | 12.9 | −1.8 | 1.58 | 4.4 |
| 2007 | 1,341,000 | 15,775 | 17,409 | −1,634 | 11.8 | 13.0 | −1.2 | 1.69 | 5.0 |
| 2008 | 1,337,000 | 16,028 | 16,675 | −647 | 12.0 | 12.5 | −0.5 | 1.72 | 5.0 |
| 2009 | 1,335,000 | 15,763 | 16,081 | −318 | 11.8 | 12.1 | −0.2 | 1.70 | 3.6 |
| 2010 | 1,332,000 | 15,825 | 15,790 | 35 | 11.9 | 11.9 | 0.0 | 1.72 | 3.3 |
| 2011 | 1,327,000 | 14,679 | 15,244 | −565 | 11.0 | 11.4 | −0.4 | 1.61 | 2.5 |
| 2012 | 1,323,000 | 14,056 | 15,450 | −1,394 | 10.6 | 11.7 | −1.1 | 1.56 | 3.6 |
| 2013 | 1,318,000 | 13,531 | 15,244 | −1,713 | 10.3 | 11.6 | −1.3 | 1.52 | 2.1 |
| 2014 | 1,314,000 | 13,551 | 15,484 | −1,933 | 10.3 | 11.8 | −1.5 | 1.54 | 2.7 |
| 2015 | 1,314,000 | 13,907 | 15,243 | −1,336 | 10.6 | 11.6 | −1.0 | 1.58 | 2.5 |
| 2016 | 1,316,000 | 14,053 | 15,392 | −1,339 | 10.7 | 11.7 | −1.0 | 1.60 | 2.3 |
| 2017 | 1,317,000 | 13,784 | 15,543 | −1,759 | 10.5 | 11.8 | −1.3 | 1.59 | 2.3 |
| 2018 | 1,322,000 | 14,367 | 15,751 | −1,384 | 10.9 | 11.9 | −1.0 | 1.67 | 1.6 |
| 2019 | 1,327,000 | 14,099 | 15,401 | −1,302 | 10.6 | 11.6 | −1.0 | 1.66 | 1.6 |
| 2020 | 1,329,000 | 13,209 | 15,811 | −2,602 | 9.9 | 11.9 | −2.0 | 1.58 | 1.4 |
1 Population figures from 2000 on were revised based on the 2011 Estonian census and various registers.[44]
According to the data of Statistics Estonia, 1,330,068 persons lived in Estonia on 1 January 2021 (1,328,889 at 1 January 2020).[8] In 2020, the population decreased by 2,602 persons due to negative natural increase and increased by 3,782 persons as a result of positive net migration – 16,209 persons immigrated to Estonia and 12,427 persons emigrated from Estonia.[8]
Current vital statistics[]
Preliminary data, based on registration:[45][46]
| Period | Live births | Deaths | Natural increase |
|---|---|---|---|
| January - August 2020 | 8,893 | 10,342 | -1,449 |
| January - August 2021 | 8,884 | 12,079 | -3,195 |
| Difference |
See also[]
| Wikimedia Commons has media related to Demographics of Estonia. |
- Estonization
- Baltic Germans
- Estonian Swedes
- Russians in Estonia
- Võros
- Aging of Europe
References[]
- ^ Heath, Michael. "Aussie Beer Drinking Market Goes Flat, Slumping to 65-Year Low". Bloomberg L.P. Retrieved 11 September 2013.
- ^ Esslemont, Tom (2011-08-26). "Spirituality in Estonia - the world's 'least religious' country". BBC News. Retrieved 2018-04-27.
- ^ Welch, Derek (2018-04-01). "Europe is Moving Away from Organized Religion - World Religion News". World Religion News. Retrieved 2018-04-27.
- ^ "Religion in Estonia". Retrieved 2018-04-27.
- ^ Jump up to: a b c d "Population by sex and age group, 1 January". Statistics Estonia. Archived from the original on 2019-05-20. Retrieved 2010-03-29.
- ^ "Archived copy". Archived from the original on 2016-08-28. Retrieved 2016-08-27.CS1 maint: archived copy as title (link)
- ^ "PHC2011 - History of Population Censuses in Estonia". stat.ee.
- ^ Jump up to: a b c "There were again fewer births than deaths, with population figure boosted by immigration". www.stat.ee. Statistics Estonia. 2021-05-12.
- ^ Jump up to: a b "Births, deaths and natural increase". Statistics Estonia. 2009-05-12. Retrieved 2009-09-30.
- ^ Jump up to: a b "Migration by administrative unit/type of settlement, sex and type of migration". Statistics Estonia. 2010-05-26. Retrieved 2010-08-23.
- ^ "1,294,455 permanent residents enumerated in the census". 12 December 2012. Statistics Estonia. Retrieved 16 January 2013.
- ^ "General information". Update 10 January 2008. Statistics Estonia. Retrieved 16 January 2013.
- ^ Estonian population growth continues in 2019 due to immigration
- ^ "The population increase was influenced by external migration". 4 May 2016. Statistics Estonia. Retrieved 14 June 2016.
- ^ "Immigration exceeds emigration in Estonia for first time since reindependence". ERR. 23 May 2016. Retrieved 14 June 2016.
- ^ "The population of Estonia decreased last year". 15 January 2016. Statistics Estonia. Retrieved 14 June 2016.
- ^ Jump up to: a b c "Main demographic indicators". Statistics Estonia. Retrieved 3 January 2013.
- ^ "Estonia Life expectancy at birth". Index Mundi. Retrieved 3 January 2013.
- ^ "World Population Prospects - Population Division". United Nations. Retrieved 2018-08-26.
- ^ "Growth in life expectancy has slowed down, but Estonian people live a longer healthy life". Statistics Estonia. 25 August 2021.
- ^ "We live longer but not healthier". Statistics Estonia. 27 August 2020.
- ^ "Life expectancy has increased for men and women in Estonia". ERR news. 27 August 2020.
- ^ Jump up to: a b "Population by Country of Birth. Statistics Estonia;". andmed.stat.ee; forms RV069 and RV 069U.
- ^ "TOWARDS AN INDEX OF ETHNIC FRACTIONALIZATION" (PDF). University of Malaya. 2008-10-17. Archived from the original (PDF) on 2011-08-13. Retrieved 2010-10-11.
- ^ Jump up to: a b c "Population by sex, ethnic nationality and county, 1 January". Statistics Estonia. 2008-10-17. Archived from the original on 2017-12-01. Retrieved 2009-10-05.
- ^ Encyclopaedia Judaica. 6. 1971.
- ^ "Demoscope Weekly - Annex. Statistical indicators reference". Demoscope.ru. Retrieved 7 November 2017.
- ^ Jump up to: a b c "Ethnic nationality. Mother tongue and command of foreign languages. Dialects". pub.stat.ee.
- ^ "Population by sex, ethnic nationality and county". stat.ee.
- ^ Jump up to: a b Eesti rahvastik rahvaloenduste andmetel (Population of Estonia by population censuses) (PDF) (in Estonian and English). 2. Eesti Statistikaamet (Statistical Office of Estonia). 1996. ISBN 9985-826-44-2. Retrieved 2009-10-05.
- ^ "Citizenship". Estonia.eu. 2010-07-02. Archived from the original on 2012-05-31. Retrieved 2010-08-20.
- ^ Mart Rannut. "Keeleaasta 2012." Sirp, 1-24-2013. (in Estonian)
- ^ Jump up to: a b "Ethnic nationality. Mother tongue. Command of foreign languages". pub.stat.ee.
- ^ "POPULATION, 31. DECEMBER 2011 by Religion, Place of residence and Sex". Statistics Estonia. 31 December 2011. Retrieved 9 January 2014.
- ^ "PHC 2011: over a quarter of the population are affiliated with a particular religion". Statistics Estonia. 29 April 2013. Retrieved 9 January 2014.
- ^ Biotechnology report 2010 Archived December 15, 2010, at the Wayback Machine p.383
- ^ Crabtree, Steve; Pelham, Brett (February 9, 2009). "What Alabamians and Iranians Have in Common". Gallup. Retrieved 21 February 2010.
- ^ "Statistical database: Population Census 2000 – Religious affiliation". Statistics Estonia. 22 October 2002. Archived from the original on 15 May 2011. Retrieved 18 February 2011.
- ^ Ahto Kaasik. "Old estonian religions". Maavalla Koda. Retrieved 3 January 2013.
- ^ Barry, Ellen (2008-11-09). "Some Estonians return to pre-Christian animist traditions". The New York Times.
- ^ "Archived copy". Archived from the original on 2014-01-09. Retrieved 2013-01-07.CS1 maint: archived copy as title (link)
- ^ "Статистический ежегодник Российской Империи (Издание ЦСК ) - Проект "Исторические Материалы"". Istmat.info. Retrieved 7 November 2017.
- ^ "Statistics Estonia".
- ^ "Statistics Estonia revised the population figures for the years 2000–2013 - Statistics Estonia". Stat.ee. Retrieved 7 November 2017.
- ^ "Vital Events". Statistical Database: Population. Statistics of Estonia. Retrieved 14 September 2021.
- ^ "News". News (in Estonian). Estonian Ministry of the Interior. Retrieved 14 September 2021.

- Demographics of Estonia