Demographics of Kazakhstan
| Demographics of Kazakhstan | |
|---|---|
 Kazakhstan population pyramid in 2020 | |
| Population | 18,985,000 (June 1, 2021)[1] |
| Density | 5.94/km2 |
| Growth rate | 13.5/1,000 population (2010 est.) |
| Birth rate | 22.4 births/1,000 population (2010 est.) |
| Death rate | 8.9 deaths/1,000 population (2010 est.) |
| Life expectancy | 72.25 years |
| • male | 67.12 years |
| • female | 77.06 years (2021 est.) |
| Fertility rate | 2.65 children born/woman (2010 est.) |
| Infant mortality rate | 18.4 deaths/1,000 live births |
| Age structure | |
| 0–14 years | 21.8% (male 1,717,469/female 1,643,920) |
| 15–64 years | 70.2% (male 5,279,292/female 5,534,607) |
| 65 and over | 7.9% (male 426,494/female 797,655) (2009 est.) |
| Sex ratio | |
| At birth | 0.94 male(s)/female |
| Under 15 | 1.04 male(s)/female |
| 15–64 years | 0.95 male(s)/female |
| 65 and over | 0.54 male(s)/female |
| Nationality | |
| Nationality | Kazakhstani(s), Kazakh(s) |
| Major ethnic | Kazakh, Russian |
| Minor ethnic | Uzbek, Ukrainian, Uyghur, Tatar, German |
| Language | |
| Official | Kazakh, Russian |
| Spoken | Kazakh, Russian, and others |
The demographics of Kazakhstan enumerate the demographic features of the population of Kazakhstan, including population growth, population density, ethnicity, education level, health, economic status, religious affiliations, and other aspects of the population. Some use the word Kazakh to refer to the Kazakh ethnic group and language (autochthonous to Kazakhstan as well as parts of Russia, China and Mongolia) and Kazakhstani to refer to Kazakhstan and its citizens regardless of ethnicity,[2][3] but it is common to use Kazakh in both senses.[4][5][6]
Demographic trends[]
Official estimates put the population of Kazakhstan at 18,137,300 as of December 2017, of which 44% is rural and 56% urban population.[7] The 2009 population estimate is 6.8% higher than the population reported in the last census from January 1999 (slightly less than 15 million). These estimates have been confirmed by the 2009 population census, and this means that the decline in population that began after 1989 has been arrested and reversed.
The proportion of men makes up 48.3%, the proportion of women 51.7%. The proportion of Kazakhs makes up 63.6%, Russians 23.7%, Uzbeks 2.9%, Ukrainians 2.1%, Uygur 1.4%, Tatars 1.3%, Germans 1.1%, others 3.9%. Note that a large percentage of the population are of mixed ethnicity.
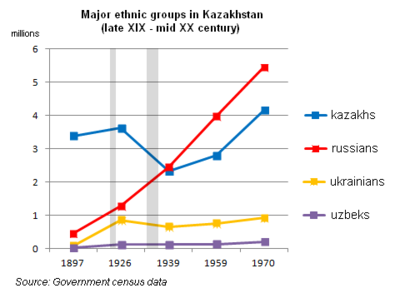
The first census in Kazakhstan was conducted under Russian Imperial rule in 1897, which estimated population at round 4 million people. Following censuses showed a growth until 1939, where numbers showed a decrease to 6,081 thousand relative to the previous census done 13 years earlier, due to famines of 1922 and 1933.
But since 1939 population has steadily increased to 16.5 million in the 1989, according to corresponding year census. Official estimates indicate that the population continued to increase after 1989, peaking out at 17 million in 1993 and then declining to 15 million in the 1999 census. The downward trend continued through 2002, when the estimated population bottomed out at 14.9 million, and then resumed its growth.[8] Significant numbers of Russians returned to Russia. Kazakhstan underwent significant urbanization during the first 50 years of the Soviet era, as the share of rural population declined from more than 90% in the 1920s to less than 50% since the 1970s.[9]
Population of Kazakhstan 1897–2018[]
| Year (January) | Population (thousands) | Rural, % | Urban, % | Source |
|---|---|---|---|---|
| 1897 | 4,000 | n/a | n/a | census |
| 1926 | 6,198 | n/a | n/a | census |
| 1939 | 6,081 | 72 | 28 | census |
| 1959 | 9,295 | 56 | 44 | census |
| 1970 | 13,001 | 50 | 50 | census |
| 1979 | 14,685 | 46 | 54 | census |
| 1989 | 16,537 | 43 | 57 | census |
| 1999 | 14,953 | 43 | 57 | census |
| 2009 | 15,982 | 46 | 54 | census |
| 2018 | 18,137 | 44 | 56 | estimate |
- Data sources: Population 1897 from Russian Empire Census. Population 1926 from First All-Union Census of the Soviet Union. Population 1939–1999 from demoscope.ru,[8] 2002–2008 from Kazakhstan Statistical Agency web site.[10] Rural/urban shares 1939–1993 from statistical yearbooks, print editions,[9] 2002–2008 from Kazakhstan Statistical Agency web site.[10] 2009–2014 from Kazakhstan Statistical Agency web site.[11]
As of 2003, there were discrepancies between Western sources regarding the population of Kazakhstan. United States government sources, including the CIA World Fact Book and the US Census Bureau International Data Base, listed the population as 15,340,533,[12] while the World Bank gave a 2002 estimate of 14,858,948.[13] This discrepancy was presumably due to difficulties in measurement caused by the large migratory population in Kazakhstan, emigration, and low population density - only about 5.5 persons per km2 in an area the size of Western Europe.
Vital statistics[]
Births and deaths[]
| Average population | Live births1 | Deaths1 | Natural change1 | Crude birth rate (per 1000) | Crude death rate (per 1000) | Natural change (per 1000) | Fertility rates | |
|---|---|---|---|---|---|---|---|---|
| 1950 | 6,703,000 | 254,169 | 79,005 | 175,164 | 37.9 | 11.8 | 26.1 | |
| 1951 | 6,946,000 | 272,354 | 80,553 | 191,801 | 39.2 | 11.6 | 27.6 | |
| 1952 | 7,133,000 | 265,235 | 85,241 | 179,994 | 37.2 | 12.0 | 25.2 | |
| 1953 | 7,271,000 | 262,758 | 73,930 | 188,828 | 36.1 | 10.2 | 26.0 | |
| 1954 | 7,528,000 | 278,420 | 76,092 | 202,328 | 37.0 | 10.1 | 26.9 | |
| 1955 | 7,992,000 | 299,854 | 73,283 | 226,571 | 37.5 | 9.2 | 28.3 | |
| 1956 | 8,426,000 | 305,430 | 64,807 | 240,623 | 36.3 | 7.7 | 28.6 | |
| 1957 | 8,722,000 | 326,766 | 68,050 | 258,716 | 37.5 | 7.8 | 29.7 | |
| 1958 | 9,077,000 | 336,020 | 62,680 | 273,340 | 37.0 | 6.9 | 30.1 | |
| 1959 | 9,516,000 | 349,794 | 69,602 | 280,192 | 36.8 | 7.3 | 29.4 | |
| 1960 | 9,996,000 | 372,595 | 65,667 | 306,928 | 37.2 | 6.6 | 30.7 | |
| 1961 | 10,480,000 | 377,789 | 68,610 | 309,179 | 36.1 | 6.5 | 29.5 | |
| 1962 | 10,958,000 | 369,002 | 70,952 | 298,050 | 33.7 | 6.5 | 27.2 | |
| 1963 | 11,321,000 | 346,084 | 67,218 | 278,866 | 30.6 | 5.9 | 24.6 | |
| 1964 | 11,610,000 | 324,412 | 66,197 | 258,215 | 27.9 | 5.7 | 22.2 | |
| 1965 | 11,909,000 | 314,533 | 69,803 | 244,730 | 26.4 | 5.9 | 20.6 | |
| 1966 | 12,185,000 | 307,905 | 69,402 | 238,503 | 25.3 | 5.7 | 19.6 | |
| 1967 | 12,456,000 | 301,715 | 71,824 | 229,891 | 24.2 | 5.8 | 18.5 | |
| 1968 | 12,694,000 | 296,882 | 73,496 | 223,386 | 23.4 | 5.8 | 17.6 | |
| 1969 | 12,901,000 | 297,129 | 78,660 | 218,469 | 23.0 | 6.1 | 16.9 | |
| 1970 | 13,106,000 | 301,451 | 77,619 | 223,832 | 23.0 | 5.9 | 17.1 | |
| 1971 | 13,321,000 | 317,423 | 79,881 | 237,542 | 23.8 | 6.0 | 17.8 | |
| 1972 | 13,534,000 | 318,551 | 85,122 | 233,429 | 23.5 | 6.3 | 17.2 | |
| 1973 | 13,742,000 | 321,075 | 90,282 | 230,793 | 23.4 | 6.6 | 16.8 | |
| 1974 | 13,955,000 | 338,291 | 93,582 | 244,709 | 24.2 | 6.7 | 17.5 | |
| 1975 | 14,136,000 | 343,668 | 101,865 | 241,803 | 24.3 | 7.2 | 17.1 | |
| 1976 | 14,279,000 | 350,362 | 103,892 | 246,470 | 24.5 | 7.3 | 17.3 | |
| 1977 | 14,425,000 | 349,379 | 105,376 | 244,003 | 24.2 | 7.3 | 16.9 | |
| 1978 | 14,589,000 | 355,337 | 107,293 | 248,044 | 24.4 | 7.4 | 17.0 | |
| 1979 | 14,743,000 | 354,320 | 113,687 | 240,633 | 24.0 | 7.7 | 16.3 | |
| 1980 | 14,884,000 | 356,013 | 119,078 | 236,935 | 23.9 | 8.0 | 15.9 | |
| 1981 | 15,033,000 | 367,950 | 120,974 | 246,976 | 24.5 | 8.0 | 16.4 | |
| 1982 | 15,185,000 | 373,416 | 120,165 | 253,251 | 24.6 | 7.9 | 16.7 | |
| 1983 | 15,334,000 | 378,577 | 123,807 | 254,770 | 24.7 | 8.1 | 16.6 | |
| 1984 | 15,481,000 | 399,403 | 129,796 | 269,607 | 25.8 | 8.4 | 17.4 | |
| 1985 | 15,623,000 | 396,929 | 126,786 | 270,143 | 25.4 | 8.1 | 17.3 | |
| 1986 | 15,776,000 | 410,846 | 119,149 | 291,697 | 26.0 | 7.6 | 18.5 | |
| 1987 | 15,948,000 | 417,139 | 122,835 | 294,304 | 26.2 | 7.7 | 18.5 | |
| 1988 | 16,188,000 | 407,116 | 126,898 | 280,218 | 25.3 | 7.9 | 17.4 | |
| 1989 | 16,243,000 | 382,269 | 126,378 | 255,891 | 23.5 | 7.8 | 15.8 | |
| 1990 | 16,328,000 | 362,081 | 128,576 | 233,505 | 22.2 | 7.9 | 14.3 | |
| 1991 | 16,405,000 | 353,174 | 134,324 | 218,850 | 21.5 | 8.2 | 13.3 | 2.67 |
| 1992 | 16,439,000 | 337,612 | 137,518 | 200,094 | 20.5 | 8.4 | 12.2 | 2.62 |
| 1993 | 16,381,000 | 315,482 | 156,070 | 159,412 | 19.3 | 9.5 | 9.7 | 2.54 |
| 1994 | 16,146,000 | 305,624 | 160,339 | 145,285 | 18.9 | 9.9 | 9.0 | 2.43 |
| 1995 | 15,816,000 | 276,125 | 168,656 | 107,469 | 17.5 | 10.7 | 6.8 | 2.21 |
| 1996 | 15,578,000 | 253,175 | 166,028 | 87,147 | 16.3 | 10.7 | 5.6 | 2.02 |
| 1997 | 15,334,000 | 232,356 | 160,138 | 72,218 | 15.2 | 10.4 | 4.7 | 1.93 |
| 1998 | 15,072,000 | 222,380 | 154,314 | 68,066 | 14.8 | 10.2 | 4.5 | 1.81 |
| 1999 | 14,939,000 | 217,578 | 147,416 | 70,162 | 14.6 | 9.9 | 4.7 | 1.79 |
| 2000 | 14,915,000 | 222,054 | 149,778 | 72,276 | 14.9 | 10.0 | 4.8 | 1.88 |
| 2001 | 14,910,000 | 221,487 | 147,876 | 73,611 | 14.9 | 9.9 | 4.9 | 1.84 |
| 2002 | 14,931,000 | 227,171 | 149,381 | 77,790 | 15.2 | 10.0 | 5.2 | 1.88 |
| 2003 | 15,002,000 | 247,946 | 155,277 | 92,669 | 16.5 | 10.4 | 6.2 | 2.03 |
| 2004 | 15,126,000 | 273,028 | 152,250 | 120,778 | 18.0 | 10.1 | 8.0 | 2.21 |
| 2005 | 15,281,000 | 278,977 | 157,121 | 121,856 | 18.3 | 10.3 | 8.0 | 2.22 |
| 2006 | 15,463,000 | 301,756 | 157,210 | 144,546 | 19.5 | 10.2 | 9.3 | 2.36 |
| 2007 | 15,659,000 | 321,963 | 158,297 | 163,666 | 20.6 | 10.1 | 10.5 | 2.47 |
| 2008 | 15,870,000 | 356,575 | 152,706 | 203,869 | 22.5 | 9.6 | 12.8 | 2.68 |
| 2009 | 16,093,000 | 356,378 | 143,238 | 213,140 | 22.1 | 8.9 | 13.2 | 2.55 |
| 2010 | 16,322,000 | 367,942 | 146,370 | 221,572 | 22.5 | 8.9 | 13.6 | 2.60 |
| 2011 | 16,557,000 | 372,801 | 144,944 | 227,857 | 22.5 | 8.7 | 13.8 | 2.59 |
| 2012 | 16,791,000 | 381,005 | 142,880 | 238,125 | 22.7 | 8.5 | 14.2 | 2.62 |
| 2013 | 17,035,000 | 393,421 | 137,630 | 255,791 | 22.7 | 8.0 | 14.7 | 2.64 |
| 2014 | 17,289,000 | 401,066 | 132,236 | 268,830 | 23.1 | 7.6 | 15.5 | 2.76 |
| 2015 | 17,557,000 | 398,561 | 131,867 | 266,694 | 22.7 | 7.5 | 15.2 | 2.73 |
| 2016 | 17,818,000 | 400,940 | 132,373 | 277,567 | 22.5 | 7.4 | 15.6 | 2.80 |
| 2017 | 18,014,000 | 390,520 | 130,033 | 260,487 | 21.7 | 7.2 | 14.5 | 2.73 |
| 2018 | 18,137,000 | 397,947 | 130,515 | 267,432 | 21.8 | 7.1 | 14.7 | 2.84 |
| 2019 | 18,396,000 | 403,064 | 133,489 | 269,575 | 21.8 | 7.2 | 14.6 | 2.90 |
| 2020 | 18,632,000 | 425,625 | 162,613 | 263,012 | 22.4 | 8.6 | 13.8 | 3.13 |
1 Births and deaths until 1979 are estimates.
Current vital statistics[]
| Period | Live births | Deaths | Natural increase |
|---|---|---|---|
| January - June 2020 | 197,265 | 64,968 | +132,297 |
| January - June 2021 | 216,218 | 76,563 | +139,655 |
| Difference |
Structure of the population [19][]
Structure of the population (01.01.2021) (Estimates) :
| Age Group | Male | Female | Total | % |
|---|---|---|---|---|
| Total | 9 160 399 | 9 719 153 | 18 879 552 | 100 |
| 0-15 | 2 980 297 | 2 809 236 | 5 789 533 | 30.7 |
| 16-62(59) | 5 524 137 | 5 485 235 | 11 009 372 | 58.3 |
| 63(60)+ | 655 965 | 1 424 682 | 2 080 647 | 11.0 |
The age group under 15 is considered below the working age, while the age group over 63(60) is above the working age (63 years for men, 60 for women).
Total fertility rate[]
Total fertility rate by regions of Kazakhstan: Mangystau - 3.80, South Kazakhstan - 3.71, Kyzylorda - 3.42, Atyrau - 3.29, Jambyl - 3.20, Aqtobe - 2.70, Almaty (province) - 2.65, Almaty (city) - 2.65, City of Astana - 2.44, West Kazakhstan - 2.29, Aqmola - 2.19, East Kazakhstan - 2.07, Qaragandy - 2.04, Pavlodar - 1.98, North Kazakhstan - 1.72, Qostanay - 1.70, Republic of Kazakhstan - 2.65. Thus it can be seen that fertility rate is higher in more traditionalist and religious south and west, and lower in the north and east, where the percentage of Slavic and German population is still relatively high.[20][21][22]
According to the Kazakhstan Demographic and Health Survey in 1999, the TFR for Kazakhs was 2.5 and that for Russians was 1.38. TFR in 1989 for Kazakhs & Russians were 3.58 and 2.24 respectively.[23]
| Total fertility rate per woman by ethnicity | 1989 | 1995 | 1999 | 2000 | 2001 | 2002 | 2003 | 2004 | 2005 | 2006 |
|---|---|---|---|---|---|---|---|---|---|---|
| Kazakh women | 3.58 | 3.11 | 2.50 | 2.12 | 2.11 | 2.14 | 2.30 | 2.52 | 2.54 | 2.73 |
| Russian women | 2.24 | 1.69 | 1.38 | 1.18 | 1.17 | 1.21 | 1.30 | 1.36 | 1.35 | 1.38 |
| Ukrainian women | 1.60 | 1.59 | 1.60 | 1.71 | 1.76 | 1.73 | 1.80 | |||
| Uzbek women | 2.90 | 2.92 | 2.88 | 3.10 | 3.39 | 3.32 | 3.43 |
Life expectancy at birth[]
| Period | Life expectancy in Years |
Period | Life expectancy in Years |
|---|---|---|---|
| 1950–1955 | 55.1 | 1985–1990 | 67.5 |
| 1955–1960 | 57.3 | 1990–1995 | 65.5 |
| 1960–1965 | 59.5 | 1995–2000 | 63.0 |
| 1965–1970 | 61.7 | 2000–2005 | 64.6 |
| 1970–1975 | 63.3 | 2005–2010 | 66.0 |
| 1975–1980 | 64.3 | 2010–2015 | 69.1 |
| 1980–1985 | 65.9 |
Source: UN World Population Prospects[25]
Ethnic groups[]
History of ethnic composition[]
Kazakhstan's dominant ethnic group Kazakhs, traces its origin to 15th century, when a number of Turkic and some Mongol tribes united to establish the Kazakh Khanate, a successor of Golden Horde. With cohesive culture and national identity, they constituted absolute majority on the land until Russian colonization.
Russian advancement into the territory of Kazakhstan began in the late 18th century, when the Kazakhs nominally accepted Russian rule in exchange for protection against repeated attacks by the western Mongolian Kalmyks. In the 1890s, Russian peasants began to settle the fertile lands of northern Kazakhstan, causing many Kazakhs to move eastwards into Chinese territory in search of new grazing grounds. The 1906 completion of the Trans-Aral Railway between Orenburg and Tashkent further facilitated Russian colonization.[27][28] The first collectivized farms opened in Kazakhstan in 1921, populated primarily by Russians and Soviet deportees. In 1930, as part of the first Five Year Plan, the Kazakh Central Committee decreed the sedentarization of nomads and their incorporation into collectivized farms. This movement resulted in devastating famine, claiming the lives of an estimated 40% of ethnic Kazakhs (1.5 million), between 1930 and 1933.[29] Hundreds of thousands also fled to China, Iran and Afghanistan. The famine rendered Kazakhs a minority within Kazakhstan, and only after the republic gained independence in 1991 did Kazakhs recover a slim demographic majority within Kazakhstan.[27]
Demographics would continue to shift in the 1950-1960s, wherein as part of Nikita Khrushchev's Virgin Lands Campaign, hundreds of thousands of Soviet deportees were relocated to the Kazakh steppes in order to farm. As recognized in the 1959 census, the Kazaks became a minority for the first time in history, comprising just 30% of the total population of Kazakhstan. Russians numbered 42.7%.[30]
According to the 2009 census, the ethnic composition of Kazakhstan is approximately: 63.1% Kazakh, 23.7% Russian, 2.9% Uzbek, 2.1% Ukrainian, 1.4% Uyghur, 1.3% Tatar, 1.1% German, 1% Kyrgyz, and <1% Korean, Turkish, Azerbaijani, Belarusian, Dungan, Kurdish, Tajik, Polish, Chechen.[31]
| Ethnic group |
census 18971 | census 19262 | census 19393 | census 19594 | census 19705 | census 19796 | census 19897 | census 19998 | ||||||||
|---|---|---|---|---|---|---|---|---|---|---|---|---|---|---|---|---|
| Number | % | Number | % | Number | % | Number | % | Number | % | Number | % | Number | % | Number | % | |
| Kazakhs | 3,392,751 | 82.9 | 3,627,612 | 58.5 | 2,327,625 | 37.8 | 2,794,966 | 30.0 | 4,161,164 | 32.4 | 5,289,349 | 36.0 | 6,534,616 | 39.7 | 8,011,452 | 53.5 |
| Russians | 454,402 | 11.1 | 1,275,055 | 20.6 | 2,458,687 | 40.0 | 3,974,229 | 42.7 | 5,499,826 | 42.8 | 5,991,205 | 40.8 | 6,227,549 | 37.8 | 4,480,675 | 29.9 |
| Uzbeks | 29,564 | 1.3 | 129,407 | 2.1 | 120,655 | 2.0 | 136,570 | 1.5 | 207,514 | 1.6 | 263,295 | 1.8 | 332,017 | 2.0 | ||
| Ukrainians | 860,201 | 13.9 | 658,319 | 10.7 | 762,131 | 8.2 | 930,158 | 7.2 | 897,964 | 6.1 | 896,240 | 5.4 | ||||
| Uygurs | 11,631 | 0.2 | 35,409 | 0.6 | 59,840 | 0.6 | 120,784 | 0.9 | 147,943 | 1.0 | 185,301 | 1.1 | ||||
| Tatars | 55,984 | 1.1 | 79,758 | 1.3 | 108,127 | 1.8 | 191,802 | 2.1 | 281,849 | 2.2 | 312,626 | 2.1 | 327,982 | 2.0 | ||
| Germans | 51,094 | 0.8 | 92,571 | 1.5 | 659,800 | 7.1 | 839,649 | 6.5 | 900,207 | 6.1 | 957,518 | 5.8 | ||||
| Koreans | 42 | 0.0 | 96,453 | 1.6 | 74,019 | 0.8 | 78,078 | 0.6 | 91,984 | 0.6 | 103,315 | 0.6 | ||||
| Turks | 46 | 0.0 | 523 | 0.0 | 9,916 | 0.1 | 18,397 | 0.1 | 25,820 | 0.2 | 49,567 | 0.3 | ||||
| Azerbaijanis | 20 | 0.0 | 12,996 | 0.2 | 38,362 | 0.4 | 56,166 | 0.4 | 73,345 | 0.5 | 90,083 | 0.5 | ||||
| Belarusians | 25,584 | 0.4 | 31,614 | 0.5 | 107,463 | 1.2 | 197,592 | 1.5 | 181,491 | 1.2 | 182,601 | 1.1 | ||||
| Poles | 3,742 | 0.1 | 54,809 | 0.9 | 53,102 | 0.6 | 61,355 | 0.5 | 61,136 | 0.4 | 59,956 | 0.4 | ||||
| Chechens | 3 | 0.0 | 2,639 | 0.0 | 130,232 | 1.4 | 34,492 | 0.3 | 38,256 | 0.3 | 49,507 | 0.3 | ||||
| Dungans | 8,455 | 0.1 | 7,415 | 0.1 | 9,980 | 0.1 | 17,283 | 0.1 | 22,491 | 0.2 | 30,165 | 0.2 | ||||
| Tajiks | 7,599 | 0.1 | 11,229 | 0.2 | 8,075 | 0.1 | 7,166 | 0.1 | 19,293 | 0.1 | 25,514 | 0.2 | ||||
| Kurds | 2,387 | 0.0 | 6,109 | 0.1 | 12,299 | 0.1 | 17,692 | 0.1 | 25,425 | 0.2 | ||||||
| Kyrgyz | 10,200 | 0.2 | 5,033 | 0.1 | 6,810 | 0.1 | 9,474 | 0.1 | 9,352 | 0.1 | 14,112 | 0.1 | ||||
| Others | 108,016 | 1.7 | 124,611 | 2.0 | 286,441 | 3.1 | 315,347 | 2.5 | 340,834 | 2.3 | 372,996 | 2.3 | ||||
| Total | 6,198,465 | 6,151,102 | 9,309,847 | 12,848,573 | 14,684,283 | 16,464,464 | 14,981,281 | |||||||||
| 1 Excluding the Kara-Kalpak AO; source:.[32] 2 Source:.[33] 3 Source:.[34] 4 Source:.[35] 5 Source:.[36] 6 Source:.[37] 7 Source:[38] | ||||||||||||||||
| Ethnic group |
census 20098 | 20149 | 202010 | |||
|---|---|---|---|---|---|---|
| Number | % | Number | % | Number | % | |
| Kazakhs | 10,096,763 | 63.1 | 11,244,547 | 65.5 | 12,764,821 | 68.5 |
| Russians | 3,793,764 | 23.7 | 3,685,009 | 21.5 | 3,512,925 | 18.9 |
| Uzbeks | 456,997 | 2.9 | 521,252 | 3.0 | 605,137 | 3.3 |
| Uygurs | 224,713 | 1.4 | 246,777 | 1.4 | 274,509 | 1.5 |
| Ukrainians | 333,031 | 2.1 | 301,346 | 1.8 | 263,962 | 1.4 |
| Tatars | 204,229 | 1.3 | 203,108 | 1.2 | 200,545 | 1.1 |
| Germans | 178,409 | 1.1 | 181,928 | 1.1 | 176,107 | 0.9 |
| Turks | 97,015 | 0.6 | 104,792 | 0.6 | 113,421 | 0.6 |
| Azerbaijanis | 85,292 | 0.5 | 98,646 | 0.6 | 112,547 | 0.6 |
| Koreans | 100,385 | 0.6 | 105,400 | 0.6 | 108,551 | 0.6 |
| Dungans | 51,944 | 0.3 | 62,029 | 0.4 | 74,409 | 0.4 |
| Belarusians | 66,476 | 0.4 | 60,295 | 0.4 | 53,440 | 0.3 |
| Tajiks | 36,277 | 0.2 | 42,143 | 0.3 | 50,121 | 0.3 |
| Kurds | 38,325 | 0.2 | 42,312 | 0.3 | 47,153 | 0.3 |
| Chechens | 31,431 | 0.2 | 32,252 | 0.2 | 33,507 | 0.2 |
| Poles | 34,057 | 0.2 | 32,661 | 0.2 | 29,728 | 0.2 |
| Kyrgyz | 23,274 | 0.2 | 29,803 | 0.2 | ||
| Others | 157,215 | 1.0 | 194,222 | 1.0 | ||
| Total | 16,009,597 | 17,160,774 | 18,631,779 | |||
| 8 Source: 9 Source:[39]10 Source:[40] | ||||||
Religions[]
References[]
- ^ https://vlast.kz/novosti/45695-cislennost-naselenia-kazahstana-vplotnuu-priblizilas-k-19-mln.html
- ^ Schreiber, Dagmar and Tredinnick, Jeremy. Kazakhstan. Odyssey Publications, 2010, p. 82.
- ^ "Kazakhstan". U.S. Department of State. Retrieved 18 March 2015.
- ^ UK Foreign and Commonwealth Office, Kazakhstan, 2 Feb 2011 Archived 6 October 2011 at the Wayback Machine.
- ^ "News & featured articles". Retrieved 18 March 2015.
- ^ Ambassador Erlan A Idissov, Embassy of the Republic of Kazakhstan to the USA.
- ^ "2017 жылдың басынан 2018 жылдың 1 қаңтарына дейінгі Қазақстан Республикасы халық санының өзгеруі туралы"., Statistical Agency of the Republic of Kazakhstan (in Russian)
- ^ Jump up to: a b Population dynamics and ethnic composition of Kazakhstan in the second half of the 20th century, Demoscope Weekly, No. 103-104, 3–16 March 2003 (in Russian)
- ^ Jump up to: a b Statistical Yearbook of Kazakhstan, Almaty, various years since 1980 (in Russian)
- ^ Jump up to: a b Population and social policy Archived 2009-07-13 at the Wayback Machine, Statistical Agency of the Republic of Kazakhstan (in Russian)
- ^ [1] Statistical Agency of the Republic of Kazakhstan (in Russian)
- ^ CIA Factbook (Kazakhstan) Retrieved on May 2, 2008
- ^ "World DataBank>World Development Indicators". databank.worldbank.org. Retrieved 31 January 2017.
- ^ http://unstats.un.org/unsd/demographic/products/dyb/dyb2.htm#2001 United nations. Demographic Yearbooks
- ^ "Халық". Retrieved 18 March 2015.
- ^ Естественное движение населения республик СССР, 1935 [Natural population growth of the Republics of the USSR, 1935] (in Russian). Demoscope.ru. Archived from the original on 2 April 2015. Retrieved 31 March 2015.
- ^ "О демографической ситуации в Республике Казахстан". www.stat.gov.kz.
- ^ "Демографическая статистика".
- ^ http://stat.gov.kz/official/industry/61/statistics/5
- ^ "Archived copy". Archived from the original on 2009-07-13. Retrieved 2009-07-28.CS1 maint: archived copy as title (link)
- ^ Spoorenberg, Thomas (2013). "Fertility changes in Central Asia since 1980". Asian Population Studies. 9 (1): 50–77. doi:10.1080/17441730.2012.752238. S2CID 154532617.
- ^ Spoorenberg, Thomas (2015). "Explaining recent fertility increase in Central Asia". Asian Population Studies. 11 (2): 115–133. doi:10.1080/17441730.2015.1027275. S2CID 153924060.
- ^ "Kazakhstan: Demographic and Health Survey, 1999 - Final Report, Chapter 4: Fertility" (PDF).
- ^ "ETHNIC DIFFERENTIATION OF FERTILITY IN KAZAKHSTAN" (PDF).
- ^ "World Population Prospects – Population Division – United Nations". Archived from the original on 2016-09-19. Retrieved 2017-07-15.
- ^ "Archived copy" (PDF). Archived from the original (PDF) on 2017-11-27. Retrieved 2018-04-19.CS1 maint: archived copy as title (link)
- ^ Jump up to: a b Olcott, M. B. (1995). The Kazakhs. Stanford, California: Stanford University Press.
- ^ Pierce, A. R. (1960) Russian Central Asia, 1867-1917: A study in colonial rule. Berkeley: University of California Press.
- ^ Pianciola, N. (2001). The collectivization famine in Kazakhstan, 1931–1933. Harvard Ukrainian Studies, 25(3/4), 237–251. Retrieved from https://www.jstor.org/stable/41036834
- ^ Zardykhan, Z. (2004). Russians in Kazakhstan and demographic change: Imperial legacy and the Kazakh way of nation building. Asian Ethnicity, 5(1), 61–79.
- ^ Central Intelligence Agency. (2014). Kazakhstan. In The World Factbook 2013-14. Retrieved from https://www.cia.gov/the-world-factbook/countries/kazakhstan/
- ^ "Äåìîñêîï Weekly - Ïðèëîæåíèå. Ñïðàâî÷íèê ñòàòèñòè÷åñêèõ ïîêàçàòåëåé". Archived from the original on 21 March 2016. Retrieved 18 March 2015.
- ^ "Äåìîñêîï Weekly - Ïðèëîæåíèå. Ñïðàâî÷íèê ñòàòèñòè÷åñêèõ ïîêàçàòåëåé". Retrieved 18 March 2015.
- ^ "Äåìîñêîï Weekly - Ïðèëîæåíèå. Ñïðàâî÷íèê ñòàòèñòè÷åñêèõ ïîêàçàòåëåé". Archived from the original on 16 March 2010. Retrieved 18 March 2015.
- ^ "Äåìîñêîï Weekly - Ïðèëîæåíèå. Ñïðàâî÷íèê ñòàòèñòè÷åñêèõ ïîêàçàòåëåé". Archived from the original on 3 December 2009. Retrieved 18 March 2015.
- ^ "Äåìîñêîï Weekly - Ïðèëîæåíèå. Ñïðàâî÷íèê ñòàòèñòè÷åñêèõ ïîêàçàòåëåé". Archived from the original on 24 March 2010. Retrieved 18 March 2015.
- ^ "Äåìîñêîï Weekly - Ïðèëîæåíèå. Ñïðàâî÷íèê ñòàòèñòè÷åñêèõ ïîêàçàòåëåé". Archived from the original on 16 March 2010. Retrieved 18 March 2015.
- ^ http://www.stat.kz/p_perepis/Documents/Перепись%20рус.pdf[dead link]
- ^ "2014 жылғы мұрағат". www.stat.gov.kz.
- ^ "Численность населения Республики Казахстан по отдельным этносам на начало 2020 года". Комитет по статистике Министерства национальной экономики Республики Казахстан. Retrieved 27 April 2020.
- ^ "Religious Composition by Country, 2010-2050". Pew Research Center's Religion & Public Life Project. 2015-04-02. Retrieved 2020-10-29.
Bibliography[]
- Rasuly-Paleczek, Gabriele; Katschnig, Julia (2005), Central Asia on Display: Proceedings of the VIIth Conference of the European Society for Central Asian Studies, LIT Verlag Münster, ISBN 978-3-8258-8309-6.
External links[]
For current data, use these sites.
- Population and social policy, Statistical Agency of the Republic of Kazakhstan (kaz
- World Bank Database
- CIA World Fact Book page on Kazakhstan
- US Census Bureau International Data Base
- countrystudies.us
- WESP population statistics
- Russians left behind in Central Asia
| show Demographics of Asia |
|---|

- Demographics of Kazakhstan