Demographics of Egypt

| This article is part of a series on |
| Life in Egypt |
|---|
 |
| Culture |
|
| Society |
|
| Politics |
|
| Economy |
|
|
Egypt portal |

Egypt is the most populous country in North Africa and the third-most populous on the African continent, after Nigeria and Ethiopia.[1] About 95%[2] of the country's 102 million people (July 2021)[3] live along the banks of the Nile and in the Nile Delta, which fans out north of Cairo; and along the Suez Canal. These regions are among the world's most densely populated, containing an average of over 1,540 per km², as compared to 96 persons per km² for the country as a whole.
Small communities spread throughout the desert regions of Egypt are clustered around historic trade and transportation routes. The government has tried with mixed success to encourage migration to newly irrigated land reclaimed from the desert. However, the proportion of the population living in rural areas has continued to decrease as people move to the megacities in search of employment and a higher standard of living.
According to the Peterson Institute for International Economics and other proponents of demographic structural approach (cliodynamics), the basic problem Egypt has is an unemployment rate driven by a demographic youth bulge: with the number of new people entering the job force at about 4% a year, unemployment in Egypt is almost 10 times as high for college graduates as it is for people who have gone through elementary school, particularly educated urban youth, who comprised most of the people that were seen out in the streets during the Egyptian revolution of 2011. An estimated 51.2% of Egyptians are under the age of 25, with just 4.3% over the age of 65, making it one of the most youthful populations in the world.[4][5]
Population[]
Egypt has a population of 92,000,000 (2016).[6][7] According to the OECD/World Bank statistics population growth in Egypt from 1990 to 2008 was 23.7 million and 41%.[8]
Age distribution[]
Data taken from Central Agency for Public Mobilization and Statistics.[9]
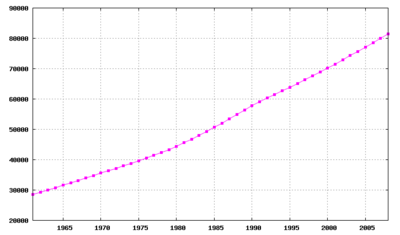
| Year | Pop. | ±% p.a. |
|---|---|---|
| 1 | 4,000,000 | — |
| 1000 | 8,000,000 | +0.07% |
| 1500 | 7,300,000 | −0.02% |
| 1805 | 4,000,000 | −0.20% |
| 1882 | 6,712,000 | +0.67% |
| 1897 | 9,669,000 | +2.46% |
| 1907 | 11,190,000 | +1.47% |
| 1917 | 12,718,000 | +1.29% |
| 1927 | 14,178,000 | +1.09% |
| 1937 | 15,921,000 | +1.17% |
| 1947 | 18,967,000 | +1.77% |
| 1960 | 26,085,000 | +2.48% |
| 1966 | 30,076,000 | +2.40% |
| 1976 | 36,626,000 | +1.99% |
| 1986 | 48,254,000 | +2.80% |
| 1996 | 59,312,000 | +2.08% |
| 2006 | 72,798,000 | +2.07% |
| 2017 | 93,287,000 | +2.28% |
| Source: Population in Egypt[11] | ||
Population Estimates by Sex and Age Group (1 January 2015):
| Age Group | Male | Female | Total | % |
|---|---|---|---|---|
| 0–4 | 5 168 230 | 4 791 812 | 9 960 042 | 11,3 |
| 5–9 | 4 790 338 | 4 456 493 | 9 246 831 | 10,5 |
| 10–14 | 4 279 072 | 4 013 008 | 8 292 080 | 9,4 |
| 15–19 | 4 367 988 | 4 131 991 | 8 499 979 | 9,7 |
| 20–24 | 4 623 621 | 4 424 043 | 9 047 664 | 10,3 |
| 25–29 | 4 334 645 | 4 175 258 | 8 509 903 | 9,7 |
| 30–34 | 3 456 601 | 3 364 004 | 6 820 605 | 7,8 |
| 35–39 | 2 711 932 | 2 639 282 | 5 351 214 | 6,1 |
| 40–44 | 2 422 954 | 2 379 682 | 4 802 636 | 5,5 |
| 45–49 | 2 222 893 | 2 184 980 | 4 407 873 | 5,0 |
| 50–54 | 1 922 803 | 1 903 745 | 3 826 548 | 4,4 |
| 55–59 | 1 567 139 | 1 557 610 | 3 124 749 | 3,6 |
| 60–64 | 1 144 789 | 1 146 574 | 2 291 363 | 2,6 |
| 65–69 | 800 241 | 811 254 | 1 611 495 | 1,8 |
| 70–74 | 522 379 | 540 837 | 1 063 216 | 1,2 |
| 75+ | 544 608 | 562 470 | 1 107 078 | 1,3 |
| Total | 44 880 233 | 43 083 043 | 87 963 276 | 100 |
| Age group | Male | Female | Total | Percent |
|---|---|---|---|---|
| 0–14 | 14 237 640 | 13 261 313 | 27 498 953 | 31,26 |
| 15–64 | 28 775 365 | 27 907 169 | 56 682 534 | 64,44 |
| 65+ | 1 867 228 | 1 914 561 | 3 781 789 | 4,30 |
Historical and Present Population Distribution:
| Age group | 2015/01/01 | 2013/07/01 | 2013/01/01 | 2012/07/01 | 2010/07/01 | 2006 | 1996 | 1986 | 1976 |
|---|---|---|---|---|---|---|---|---|---|
| 0–14 | 31.26 (27,498,953) | 31.09 (26,313,927) | 31.1 (26,014,000) | 31.1 (25,592,000) | 31.7 (24,979,000) | 31.7 | 37.8 | 40.1 | 40 |
| 15–64 | 64.44 (56,682,534) | 64.50 (54,582,985) | 64.49 (53,959,000) | 64.48 (53,085,000) | 64.6 (50,805,000) | 64.6 | 58.7 | 56.6 | 56.4 |
| 65+ | 4.30 (3,781,789) | 4.41 (3,732,070) | 4.41 (3,688,000) | 4.42 (3,628,000) | 3.7 (2,944,000) | 3.7 | 3.5 | 3.3 | 3.6 |
Egyptians abroad[]
Egyptians have a long history of mobility, primarily across the Arab world, but emigration became much more popular once it was recognised as a right in the 1971 Constitution.[12] According to the International Organization for Migration, an estimated 2.7 million Egyptians live abroad and contribute actively to the development of their country through remittances (US$7.8 billion in 2009), circulation of human and social capital, as well as investment. Approximately 70% of Egyptian migrants live in Arab countries (923,600 in Saudi Arabia, 332,600 in Libya, 226,850 in Jordan, 190,550 in Kuwait with the rest elsewhere in the region) and the remaining 30% are living mostly North America (318,000 in the United States, 110,000 in Canada) and Europe (90,000 in Italy).[13]
Urban and Rural Population[]
Figures from CAPMAS:[14]
| Midyear
Population |
Urban Population (in thousands) | Urban Population (per cent) | Rural Population (in thousands) | Rural Population (per cent) | |
|---|---|---|---|---|---|
| 1990 | 51 911 | 22 519 | 43.4 | 29 392 | 56.6 |
| 1991 | 52 985 | 22 908 | 43.2 | 30 077 | 56.8 |
| 1992 | 54 082 | 23 366 | 43.2 | 30 716 | 56.8 |
| 1993 | 55 201 | 23 804 | 43.1 | 31 397 | 56.9 |
| 1994 | 56 344 | 24 276 | 43.1 | 32 068 | 56.9 |
| 1995 | 57 642 | 24 709 | 42.9 | 32 933 | 57.1 |
| 1996 | 58 835 | 25 053 | 42.6 | 33 782 | 57.4 |
| 1997 | 60 053 | 25 578 | 42.6 | 34 475 | 57.4 |
| 1998 | 61 296 | 26 104 | 42.6 | 35 192 | 57.4 |
| 1999 | 62 565 | 26 559 | 42.5 | 36 006 | 57.5 |
| 2000 | 63 860 | 27 132 | 42.5 | 36 728 | 57.5 |
| 2001 | 65 182 | 28 118 | 43.1 | 37 064 | 56.9 |
| 2002 | 66 628 | 28 554 | 42.9 | 38 074 | 57.1 |
| 2003 | 67 965 | 29 130 | 42.9 | 38 835 | 57.1 |
| 2004 | 69 304 | 29 653 | 42.8 | 39 651 | 57.2 |
| 2005 | 70 653 | 30 187 | 42.7 | 40 466 | 57.3 |
| 2006 | 72 009 | 30 585 | 42.5 | 41 424 | 57.5 |
| 2007 | 73 644 | 31 720 | 43.1 | 41 924 | 56.9 |
| 2008 | 75 194 | 32 249 | 42.9 | 42 945 | 57.1 |
| 2009 | 76 925 | 33 083 | 43.0 | 43 842 | 57.0 |
| 2010 | 78 685 | 33 804 | 43.0 | 44 881 | 57.0 |
| 2011 | 80 530 | 34 489 | 42.8 | 46 041 | 57.2 |
| 2012 | 82 550 | 35 373 | 42.9 | 47 177 | 57.1 |
| 2013 | 84 629 | 36 213 | 42.8 | 48 416 | 57.2 |
| 2014 | 86 814 | 37 095 | 42.7 | 49 719 | 57.3 |
Future Population Projections[]
The Central Agency for Public Mobilization and Statistics (CAPMAS) had released high/medium/low population projections for 2011–2031 based on Final Results of 2006 Population Census.[14] The 2020 high variant was 92.6 million, the medium – 91.0 million, the low – 90.0 million. The 2030 high variant is 104.4 million, the medium – 101.7 million, the low – 99.8 million. However the information could be misleading as the 2013 population figure of 84.6 million is higher than the projected high of 83 million. In fact, due to an unexpected rise in the fertility rate (from 3.0 to 3.5), the population already surpassed 91 million on 5 June 2016 while reaching 92 million on 30 November, average population age remaining stable despite a rising life expectancy.
Vital statistics[]
| Midyear population | Live births | Deaths | Natural change | Crude birth rate (per 1000) | Crude death rate (per 1000) | Natural change (per 1000) | Total fertility rate | |
|---|---|---|---|---|---|---|---|---|
| 1934 | 15,449,000 | 651,663 | 429,851 | 221,812 | 42.2 | 27.8 | 14.4 | |
| 1935 | 15,624,000 | 645,760 | 412,197 | 233,563 | 41.3 | 26.4 | 14.9 | |
| 1936 | 15,801,000 | 698,186 | 455,832 | 242,354 | 44.2 | 28.8 | 15.3 | |
| 1937 | 16,009,000 | 694,086 | 434,208 | 259,878 | 43.4 | 27.1 | 16.2 | |
| 1938 | 16,300,000 | 704,376 | 429,248 | 275,128 | 43.2 | 26.3 | 16.9 | |
| 1939 | 16,598,000 | 696,746 | 429,033 | 267,713 | 42.0 | 25.8 | 16.1 | |
| 1940 | 16,900,000 | 697,700 | 444,448 | 253,252 | 41.3 | 26.3 | 15.0 | |
| 1941 | 17,208,000 | 695,016 | 440,981 | 254,035 | 40.4 | 25.6 | 14.8 | |
| 1942 | 17,522,000 | 658,324 | 494,358 | 163,966 | 37.6 | 28.2 | 9.4 | |
| 1943 | 17,842,000 | 689,771 | 492,644 | 197,127 | 38.7 | 27.6 | 11.0 | |
| 1944 | 18,167,000 | 722,166 | 472,234 | 249,932 | 39.8 | 26.0 | 13.8 | |
| 1945 | 18,498,000 | 787,502 | 512,003 | 275,499 | 42.6 | 27.7 | 14.9 | |
| 1946 | 18,835,000 | 776,000 | 484,000 | 292,000 | 41.2 | 25.7 | 15.5 | |
| 1947 | 19,197,000 | 834,557 | 408,577 | 425,980 | 43.5 | 21.3 | 22.2 | |
| 1948 | 19,529,000 | 832,728 | 397,976 | 434,752 | 42.6 | 20.4 | 22.3 | |
| 1949 | 19,989,000 | 831,310 | 410,524 | 420,786 | 41.6 | 20.5 | 21.1 | |
| 1950 | 21,514,000 | 904,941 | 388,944 | 515,997 | 44.2 | 19.0 | 25.2 | |
| 1951 | 22,020,000 | 934,584 | 402,158 | 532,426 | 44.6 | 19.2 | 25.4 | |
| 1952 | 22,562,000 | 969,443 | 380,633 | 588,810 | 45.2 | 17.8 | 27.5 | |
| 1953 | 23,138,000 | 934,830 | 429,097 | 505,733 | 42.6 | 19.6 | 23.0 | |
| 1954 | 23,747,000 | 957,158 | 401,306 | 555,852 | 42.6 | 17.9 | 24.7 | |
| 1955 | 24,387,000 | 926,500 | 405,663 | 520,837 | 40.3 | 17.6 | 22.7 | |
| 1956 | 25,057,000 | 958,880 | 384,974 | 573,906 | 40.7 | 16.4 | 24.4 | |
| 1957 | 25,756,000 | 914,494 | 429,512 | 484,982 | 38.0 | 17.8 | 20.1 | |
| 1958 | 26,480,000 | 1,013,743 | 409,197 | 604,546 | 41.1 | 16.6 | 24.5 | |
| 1959 | 27,228,000 | 1,078,947 | 411,188 | 667,759 | 42.8 | 16.3 | 26.5 | |
| 1960 | 27,998,000 | 1,113,888 | 437,822 | 676,066 | 43.0 | 16.9 | 26.1 | |
| 1961 | 28,786,000 | 1,166,620 | 420,158 | 746,462 | 43.9 | 15.8 | 28.1 | |
| 1962 | 29,591,000 | 1,125,798 | 486,699 | 639,099 | 41.3 | 17.9 | 23.4 | |
| 1963 | 30,410,000 | 1,196,388 | 431,673 | 764,715 | 42.8 | 15.4 | 27.4 | |
| 1964 | 31,242,000 | 1,205,785 | 449,375 | 756,410 | 42.1 | 15.7 | 26.4 | |
| 1965 | 32,084,000 | 1,220,658 | 411,636 | 809,022 | 41.5 | 14.0 | 27.5 | |
| 1966 | 32,937,000 | 1,234,976 | 477,021 | 757,955 | 41.0 | 15.8 | 25.1 | |
| 1967 | 33,799,000 | 1,210,214 | 440,161 | 770,053 | 39.2 | 14.2 | 24.9 | |
| 1968 | 34,660,000 | 1,206,585 | 509,430 | 697,155 | 38.1 | 16.1 | 22.0 | |
| 1969 | 35,511,000 | 1,197,245 | 468,017 | 729,228 | 36.8 | 14.4 | 22.4 | |
| 1970 | 36,342,000 | 1,161,539 | 500,626 | 660,913 | 34.9 | 15.0 | 19.8 | |
| 1971 | 37,152,000 | 1,186,350 | 445,192 | 741,158 | 34.8 | 13.1 | 21.8 | |
| 1972 | 37,945,000 | 1,187,286 | 499,628 | 687,658 | 34.1 | 14.3 | 19.7 | |
| 1973 | 38,734,000 | 1,259,004 | 459,816 | 799,188 | 35.3 | 12.9 | 22.4 | |
| 1974 | 39,534,000 | 1,287,614 | 457,620 | 829,994 | 35.4 | 12.6 | 22.8 | |
| 1975 | 40,359,000 | 1,331,799 | 456,041 | 875,758 | 36.0 | 12.3 | 23.7 | |
| 1976 | 41,213,000 | 1,378,917 | 444,228 | 934,689 | 36.4 | 11.7 | 24.7 | |
| 1977 | 42,094,000 | 1,447,402 | 457,558 | 989,844 | 37.3 | 11.8 | 25.5 | |
| 1978 | 43,006,000 | 1,479,698 | 415,605 | 1,064,093 | 37.2 | 10.5 | 26.8 | |
| 1979 | 43,951,000 | 1,633,674 | 444,753 | 1,188,921 | 40.0 | 10.9 | 29.1 | |
| 1980 | 44,932,000 | 1,569,247 | 421,227 | 1,148,020 | 37.3 | 10.0 | 27.3 | 5.3 |
| 1981 | 45,946,000 | 1,593,698 | 432,264 | 1,161,434 | 36.8 | 10.0 | 26.8 | |
| 1982 | 46,991,000 | 1,601,265 | 441,621 | 1,159,644 | 34.1 | 9.4 | 24.7 | |
| 1983 | 48,072,000 | 1,666,915 | 412,700 | 1,254,215 | 34.7 | 8.6 | 26.1 | |
| 1984 | 49,190,000 | 1,797,206 | 400,600 | 1,396,606 | 36.5 | 8.1 | 28.4 | 4.9 |
| 1985 | 50,347,000 | 1,903,022 | 442,258 | 1,460,764 | 37.8 | 8.8 | 29.0 | |
| 1986 | 51,545,000 | 1,907,975 | 455,888 | 1,452,087 | 37.0 | 8.8 | 28.2 | |
| 1987 | 52,777,000 | 1,902,604 | 466,161 | 1,436,443 | 36.0 | 8.8 | 27.2 | |
| 1988 | 54,011,000 | 1,912,765 | 427,018 | 1,485,747 | 35.4 | 7.9 | 27.5 | 4.4 |
| 1989 | 55,207,000 | 1,722,934 | 414,214 | 1,308,720 | 31.2 | 7.5 | 23.7 | |
| 1990 | 51,911,000 | 1,687,000 | 393,250 | 1,293,750 | 32.5 | 7.6 | 24.9 | |
| 1991 | 52,985,000 | 1,636,551 | 391,588 | 1,244,963 | 30.9 | 7.4 | 23.5 | 4.1 |
| 1992 | 54,082,000 | 1,496,866 | 382,465 | 1,114,401 | 27.7 | 7.1 | 20.6 | |
| 1993 | 55,201,000 | 1,600,549 | 380,000 | 1,220,549 | 29.0 | 6.9 | 22.1 | |
| 1994 | 56,344,000 | 1,610,652 | 385,296 | 1,225,356 | 28.6 | 6.8 | 21.7 | |
| 1995 | 57,642,000 | 1,604,835 | 384,548 | 1,220,287 | 27.8 | 6.7 | 21.2 | 3.6 |
| 1996 | 58,835,000 | 1,662,065 | 379,983 | 1,282,082 | 28.2 | 6.5 | 21.8 | |
| 1997 | 60,053,000 | 1,654,695 | 389,301 | 1,265,394 | 27.6 | 6.5 | 21.1 | 3.3 |
| 1998 | 61,296,000 | 1,687,252 | 399,772 | 1,287,480 | 27.5 | 6.5 | 21.0 | 3.4 |
| 1999 | 62,565,000 | 1,693,025 | 401,433 | 1,291,592 | 27.1 | 6.4 | 20.6 | |
| 2000 | 63,860,000 | 1,751,854 | 404,699 | 1,347,155 | 27.4 | 6.3 | 21.1 | 3.5 |
| 2001 | 65,182,000 | 1,741,308 | 404,531 | 1,336,777 | 26.7 | 6.2 | 20.5 | |
| 2002 | 66,628,000 | 1,766,589 | 424,034 | 1,342,555 | 26.5 | 6.4 | 20.2 | |
| 2003 | 67,965,000 | 1,777,418 | 440,149 | 1,337,269 | 26.2 | 6.5 | 19.7 | 3.2 |
| 2004 | 69,304,000 | 1,779,500 | 440,790 | 1,338,710 | 25.7 | 6.4 | 19.3 | |
| 2005 | 70,653,000 | 1,800,972 | 450,646 | 1,350,326 | 25.5 | 6.4 | 19.1 | 3.1 |
| 2006 | 72,009,000 | 1,853,746 | 451,863 | 1,401,883 | 25.7 | 6.3 | 19.5 | |
| 2007 | 74,828,000 | 1,949,569 | 450,596 | 1,498,973 | 26.5 | 6.1 | 20.4 | |
| 2008 | 76,651,000 | 2,050,704 | 461,934 | 1,588,770 | 27.4 | 5.9 | 21.5 | 3.0 |
| 2009 | 78,522,000 | 2,217,409 | 476,592 | 1,740,817 | 28.8 | 6.2 | 22.6 | |
| 2010 | 80,443,000 | 2,261,409 | 483,385 | 1,778,024 | 28.7 | 6.1 | 22.6 | |
| 2011 | 82,410,000 | 2,442,094 | 493,086 | 1,949,008 | 30.3 | 6.1 | 24.2 | |
| 2012 | 84,418,000 | 2,629,769 | 529,247 | 2,100,522 | 31.9 | 6.4 | 25.5 | |
| 2013 | 86,460,000 | 2,621,902 | 511,000 | 2,110,719 | 31.0 | 6.0 | 25.0 | |
| 2014 | 88,530,000 | 2,720,495 | 531,864 | 2,188,631 | 31.3 | 6.1 | 25.2 | 3.5 |
| 2015 | 90,624,000 | 2,685,276 | 573,129 | 2,123,102 | 30.2 | 6.5 | 23.7 | |
| 2016 | 92,737,000 | 2,600,173 | 556,148 | 2,044,025 | 28.6 | 6.1 | 22.5 | |
| 2017 | 95,203,000 | 2,557,400 | 547,200 | 1,971,115 | 26.8 | 5.6 | 20.1 | 3.1 |
| 2018 | 97,147,000 | 2,382,362 | 560,308 | 1,822,054 | 24.5 | 5.8 | 18.7 | 2.9 (E) |
| 2019 | 98,902,000 | 2,311,753 | 570,260 | 1,741,493 | 23.2 | 5.7 | 17.5 | 2.77 (E) |
| 2020 | 100,604,000 | 2,271,802 | 663,670 | 1,608,132 | 22.6 | 6.6 | 16.0 |
Monthly changes[]
| Period | Live births | Deaths | Natural increase |
|---|---|---|---|
| March 2020 | 180,300 | 48,400 | +131,900 |
| March 2021 | 168,700 | 61,600 | +107,100 |
| Difference |
Fertility Rate (The Demographic Health Survey)[]
Fertility Rate (TFR) (Wanted Fertility Rate) and CBR (Crude Birth Rate):[19]
| Year | CBR (Total) | TFR (Total) | CBR (Urban) | TFR (Urban) | CBR (Rural) | TFR (Rural) |
|---|---|---|---|---|---|---|
| 1992 | 29,7 | 3,93 (2,7) | 23,3 | 2,92 (2,0) | 35,0 | 4,91 (3,4) |
| 1995 | 28,0 | 3,63 (2,6) | 23,9 | 3,01 (2,2) | 31,4 | 4,19 (2,9) |
| 1997 | 3,3 | 2,7 | 3,7 | |||
| 1998 | 27 | 3,4 | 23 | 2,8 | 31 | 3,9 |
| 2000 | 27,8 | 3,53 (2,9) | 24,8 | 3,09 (2,6) | 30,1 | 3,88 (3,1) |
| 2003 | 26,3 | 3,2 (2,5) | 21,7 | 2,6 (2,1) | 29,8 | 3,6 (2,9) |
| 2005 | 27,1 | 3,1 (2,3) | 23,6 | 2,7 (2,1) | 29,6 | 3,4 (2,5) |
| 2008 | 26,6 | 3,0 (2,4) | 23,3 | 2,7 (2,2) | 29,1 | 3,2 (2,5) |
| 2014 | 29,1 | 3,5 (2,8) | 23,3 | 2,9 (2,4) | 32,7 | 3,8 (3,0) |
Life expectancy at birth[]
Average Life expectancy at age 0 of the total population.[20]
| Period | Life expectancy in Years |
Period | Life expectancy in Years |
|---|---|---|---|
| 1950–1955 | 41.1 | 1985–1990 | 63.5 |
| 1955–1960 | 46.4 | 1990–1995 | 65.4 |
| 1960–1965 | 49.3 | 1995–2000 | 68.0 |
| 1965–1970 | 51.6 | 2000–2005 | 69.0 |
| 1970–1975 | 53.0 | 2005–2010 | 69.9 |
| 1975–1980 | 56.8 | 2010–2015 | 70.8 |
| 1980–1985 | 59.9 |
Demographics by Governorate[]
Urban and Rural Population of Governorates[]
Sinai
Data taken from CAPMAS:[21]
| Governorate | % Urban | Population (2017) | Rural | Urban |
|---|---|---|---|---|
| Alexandria | 98.7 | 5,163,750 | 68,293 | 5,095,457 |
| Aswan | 41.1 | 1,473,975 | 868,820 | 605,155 |
| Asyut | 25.9 | 4,383,289 | 3,248,225 | 1,135,064 |
| Beheira | 18.2 | 6,171,613 | 5,050,630 | 1,120,983 |
| Beni Suef | 20.1 | 3,154,100 | 2,438,134 | 715,966 |
| Cairo | 100.0 | 9,539,673 | 0 | 9,539,673 |
| Dakahlia | 28.3 | 6,492,381 | 4,656,592 | 1,835,789 |
| Damietta | 39.4 | 1,496,765 | 907,542 | 589,223 |
| Faiyum | 23.0 | 3,596,954 | 2,768,329 | 828,625 |
| Gharbia | 28.1 | 4,999,633 | 3,594,336 | 1,405,297 |
| Giza | 61.1 | 8,632,021 | 3,365,818 | 5,266,203 |
| Ismailia | 44.5 | 1,303,993 | 724,046 | 579,947 |
| Kafr el-Sheikh | 23.9 | 3,362,185 | 2,557,058 | 805,127 |
| Luxor | 40.4 | 1,250,209 | 744,669 | 505,540 |
| Matruh | 62.7 | 425,624 | 158,546 | 267,078 |
| Minya | 18.0 | 5,497,095 | 4,507,931 | 989,164 |
| Monufia | 20.7 | 4,301,601 | 3,410,855 | 890,746 |
| New Valley | 46.0 | 241,247 | 130,253 | 110,994 |
| North Sinai | 62.9 | 450,328 | 167,217 | 283,111 |
| Port Said | 100.0 | 749,371 | 0 | 749,371 |
| Qalyubia | 42.7 | 5,627,420 | 3,224,929 | 2,402,491 |
| Qena | 18.8 | 3,164,281 | 2,569,795 | 594,486 |
| Red Sea | 96.5 | 359,888 | 12,516 | 347,372 |
| Sharqia | 24.9 | 7,163,824 | 5,422,698 | 1,741,126 |
| Sohag | 21.2 | 4,967,409 | 3,913,109 | 1,054,300 |
| South Sinai | 53.5 | 102,018 | 48,079 | 53,939 |
| Suez | 100.0 | 728,180 | 0 | 728,180 |
| Total | 42.2 | 94,798,827 | 54,558,420 | 40,240,407 |
Population Density by Governorate[]
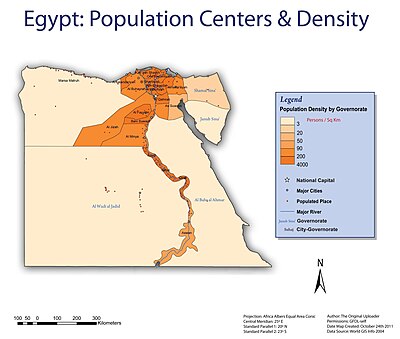
Data taken from CAPMAS:[21] Information for population is in thousands, pop density – persons/km2 and area is in km2.
| Governorate | Population in thousands (2014-07-01) | Pop. Density (Inhabited Area) | Pop. Density (Total Area) | % Inhabited to Total | Inhabited Area | Total Area |
|---|---|---|---|---|---|---|
| Alexandria | 4,761 | 2,841.5 | 2,070.0 | 72.8 | 1,675.50 | 2,300.00 |
| Aswan | 1,412 | 13,477.1 | 22.5 | 0.2 | 104.77 | 62,726.00 |
| Asyut | 4,181 | 2,656.3 | 161.3 | 6.1 | 1,574.00 | 25,926.00 |
| Beheira | 5,720 | 806.3 | 582.1 | 72.2 | 7,093.84 | 9,826.00 |
| Beni Suef | 2,812 | 2,053.4 | 256.7 | 12.5 | 1,369.41 | 10,954.00 |
| Cairo | 9,184 | 48,235.3 | 2,976.8 | 6.2 | 190.40 | 3,085.12 |
| Dakahlia | 5,881 | 1,662.1 | 1,662.1 | 100.0 | 3,538.23 | 3,538.23 |
| Damietta | 1,316 | 1,968.7 | 1,445.7 | 73.4 | 668.47 | 910.26 |
| Faiyum | 3,118 | 1,680.0 | 513.8 | 30.6 | 1,856.00 | 6,068.00 |
| Gharbia | 4,698 | 2,418.7 | 2,418.7 | 100.0 | 1,942.34 | 1,942.34 |
| Giza | 7,487 | 6,286.3 | 567.9 | 9.0 | 1,191.00 | 13,184.00 |
| Ismailia | 1,162 | 229.3 | 229.3 | 100.0 | 5,066.97 | 5,066.97 |
| Kafr el-Sheikh | 3,132 | 903.5 | 903.5 | 100.0 | 3,466.69 | 3,466.69 |
| Luxor | 1,132 | 4,992.7 | 469.8 | 9.4 | 226.73 | 2,409.68 |
| Matruh | 437 | 111.4 | 2.6 | 2.4 | 3,921.40 | 166,563.00 |
| Minya | 5,076 | 2,104.8 | 157.3 | 7.5 | 2,411.65 | 32,279.00 |
| Monufia | 3,890 | 1,596.9 | 1,556.6 | 97.5 | 2,435.93 | 2,499.00 |
| New Valley | 222 | 205.1 | 0.5 | 0.2 | 1,082.24 | 440,098.00 |
| North Sinai | 428 | 203.7 | 14.8 | 7.2 | 2,100.84 | 28,992.00 |
| Port Said | 660 | 499.7 | 490.7 | 98.2 | 1,320.68 | 1,344.96 |
| Qalyubia | 5,044 | 4,702.1 | 4,486.4 | 95.4 | 1,072.72 | 1,124.28 |
| Qena | 3,001 | 1,724.1 | 277.9 | 16.1 | 1,740.63 | 10,798.00 |
| Red Sea | 341 | 4,794.0 | 2.9 | 0.1 | 71.13 | 119,099.13 |
| Sharqia | 6,402 | 1,343.7 | 1,303.6 | 97.0 | 4,764.28 | 4,911.00 |
| Sohag | 4,536 | 2,845.8 | 411.5 | 14.5 | 1,593.92 | 11,022.00 |
| South Sinai | 166 | 9.9 | 5.3 | 53.7 | 16,791.00 | 31,272.00 |
| Suez | 615 | 68.3 | 68.3 | 100.0 | 9,002.21 | 9,002.21 |
| Total | 86,814 | 1109.1 | 85.9 | 7.8 | 78272.98 | 1010407.87 |
Ethnic groups[]
The CIA World Factbook lists Egyptians as 99.7%, and "other" as 0.3% (2006 census).[23] "Other" refers to people who are not citizens of Egypt, who come to Egypt to work for international companies, diplomats, etc.
The vast majority of the population of Egypt consists of Egyptians including Copts, Egyptians make up 95% of the population.[24] The vast majority of Egyptians are native speakers of Egyptian Arabic.
Minorities in Egypt include the Copts who represent around 10% of the entire population[a] and live all over the country, the Berber-speaking community of the Siwa Oasis (Siwis) and the Nubian people clustered along the Nile in the southernmost part of Egypt. There are also sizable minorities of Beja and Dom. There are also refugees mainly composed of Sudanese, and the over all refugees are estimated to be around 3–5 million,[30] those from war-zone areas like Iraq, Ethiopia, Somalia, South Sudan, and Eritrea.[30]
The country was also host to many different communities during the colonial period, including Greeks, Italians, and also from war-torn areas; the Lebanese, Syro-Lebanese, and other minority groups like Jews, Armenians, Turks and Albanians, though most either left or were compelled to leave after political developments in the 1950s. The country still hosts some 90,000 refugees and asylum seekers, mostly Palestinians and Sudanese.
Other sources[citation needed] give more detailed statistics, including the Beja[31](ca. 1 million), the Nubians (ca. 300,000 in 1996), Dom (ca. 230,000 in 1996), Berbers (Siwis) (ca. 5,000).
Languages[]
Arabic is the official language of Egypt, with the vast majority of Egyptians speaking Egyptian Arabic. In The Upper Nile valley, Sa'idi Arabic is prevalent. The Coptic language is used in the Coptic church for the majority of prayers, hymns, masses, and meditations. English is widely understood. Siwa language used in ethnic Berber tribal areas in the western desert (Siwa), and Nubian language is widely used among the ethnic Nubians in the southern areas.
Religions[]
According to the CIA World Factbook, approximately 90% of the population is Muslim and 10% is Christian (9% Coptic Orthodox Church, 1% other Christian).[a]
- Muslim 90%[24] (Mostly Sunni)
- Christianity 10%[a]
- Baháʼí: fewer than 2,000 individuals (< 0.003%)
- Judaism: fewer than 200 individuals[34]
Education[]
The literacy rate in modern Egyptian society is highly debated. Education is free through university and compulsory from ages six through 15, though enforcement may be lax. Rates for primary and secondary education have strengthened in recent years. The vast majority of children enter primary school though a significant number drop out. There are approx. 200,000 primary and secondary schools with some 10 million students, 13 major universities with more than 500,000 students, and 67 teacher colleges. Major universities include Cairo University (100,000 students), Ain Shams University, Alexandria University, the 1,000-year-old Al-Azhar University, one of the world's major centers of Islamic learning and the AUC (American University in Cairo), . The former first lady has created many project towards the advancement of Egyptian education and the efforts to force education to the remaining 7–9% of students who drop out illegally. Child labor is a contributing factor to these dropouts but it is considered a serious crime to work children under the legal age and charges are taken very seriously at this time.
CIA World Factbook demographic statistics[]

The following demographic statistics are from the CIA World Factbook, unless otherwise indicated.
Infant mortality rate[]
- 22.41 deaths/1,000 live births (2014 est.)
Life expectancy at birth[]
- total population: 72.7 years
- male: 71.4 years
- female: 74.2 years (2016 est.)
Nationality[]
- noun: Egyptian(s)
- adjective: Egyptian
Literacy[]
- definition: age 15 and over can read and write
- total population: 73.85%
- male: 82.1% (2015 est.)[36]
- female: 65.6% (2015 est.)[37]
Genetics[]
Y-Chromosome[]
Listed here are the human Y-chromosome DNA haplogroups in Egypt.[38]
| Haplogroup | n | A | B | E1a | E1b1a | E1b1b1 | E1b1b1a | E1b1b1a1 | E1b1b1a1b | E1b1b1a2 | E1b1b1a3 | E1b1b1a4 | E1b1b1b | E1b1b1c | F | G | I | J1 | J2 | K | L | O | P,R | Q | R1a | R1b1a | R1b1b | R2 | T |
| Marker | M33 | M2 | M35 | M78 | V12 | V32 | V13 | V22 | V65 | M81 | M34 | M89 | M201 | V88 | M269 | M70 | |||||||||||||
| Egypt | 370 | 1.35 | - | 0.54 | 2.43 | 3.24 | 0.81 | 7.03 | 1.62 | 0.81 | 9.19 | 2.43 | 11.89 | 6.76 | 1.08 | 5.68 | 0.54 | 20.81 | 6.75 | 0.27 | 0.81 | 0.27 | 0.54 | 0.27 | 2.16 | 2.97 | 2.97 | 0.54 | 6.22 |
See also[]
- Health in Egypt
- List of cities in Egypt
- Population history of Egypt
Notes[]
- ^ Jump up to: a b c In 2017, the Wall Street Journal reported that "the vast majority of Egypt's estimated 9.5 million Christians, approximately 10% of the country's population, are Orthodox Copts."[25] In 2019, the Associated Press cited an estimate of 10 million Copts in Egypt.[26] In 2015, the Wall Street Journal reported: "The Egyptian government estimates about 5 million Copts, but the Coptic Orthodox Church says 15-18 million. Reliable numbers are hard to find but estimates suggest they make up somewhere between 6% and 18% of the population."[27] In 2004, BBC News reported that Copts were 5–10% of the Egyptian population.[28] The CIA World Factbook reported a 2015 estimate that 10% of the Egyptian population is Christian (including both Copts and non-Copts).[29]
References[]
 This article incorporates public domain material from the CIA World Factbook document: "2006 edition".
- This article incorporates public domain material from the United States Department of State website https://www.state.gov/countries-areas/. (U.S. Bilateral Relations Fact Sheets)
- ^ "الجهاز المركزي للتعبئة العامة والإحصاء". www.capmas.gov.eg. Archived from the original on 11 May 2011. Retrieved 19 April 2015.
- ^ "Egypt Facts". National Geographic.
- ^ "population clock". Egypt Central Agency for Public Mobilization And Statistics.
- ^ Korotayev A., Zinkina J. Egyptian Revolution: A Demographic Structural Analysis. Entelequia. Revista Interdisciplinar 13 (2011): 139–169.
- ^ "The long-term economic challenges Egypt must overcome". Marketplace. 1 February 2011. Archived from the original on 4 February 2011. Retrieved 1 February 2011.
- ^ "Egypt's Population Increases 1 Million in Six Months to Reach 92 Million".
- ^ "Official Population Clock". Retrieved 20 May 2015.
- ^ CO2 Emissions from Fuel Combustion Population 1971–2008 (pdf Archived 6 January 2012 at the Wayback Machine pages 83–85) IEA (OECD/ World Bank) original population ref e.g. in IEA Key World Energy Statistics 2010 p. 57)
- ^ "Archived copy". Archived from the original on 25 May 2013. Retrieved 26 January 2014.CS1 maint: archived copy as title (link)
- ^ "Demographic and Health Survey 2014" (PDF). DHS. Retrieved 1 August 2015.
- ^ "Population in Censuses by Sex & Sex Ratio (1882–2006)" (PDF). Egypt State Information Service.
- ^ Tsourapas, Gerasimos (2019). The Politics of Migration in Modern Egypt: Strategies for Regime Survival in Autocracies. Cambridge: Cambridge University Press. ISBN 9781108475549. OCLC 1080638597.
- ^ "IOM Migration and Development in Egypt Facts and Figures" (PDF). Archived from the original (PDF) on 5 February 2011. Retrieved 21 July 2010.
- ^ Jump up to: a b "Statistical Yearbook – Population". 20 May 2015.
- ^ "Demographic Yearbook 2019". United Nations.
- ^ "Central Agency for Public Mobilization and Statistics".
- ^ "Unknown". Archived from the original on 21 December 2018. Retrieved 26 April 2015. Cite uses generic title (help)
- ^ "Informatics bulletin".
- ^ [1]
- ^ "World Population Prospects – Population Division – United Nations". esa.un.org. Archived from the original on 19 September 2016. Retrieved 26 August 2018.
- ^ Jump up to: a b "Egypt in Figures 2017". CAPMAS. Retrieved 1 March 2020.
- ^ "Africa :: EGYPT". CIA The World Factbook.
- ^ "CIA World Factbook – Egypt".
- ^ Jump up to: a b The World Factbook
- ^ Francis X. Rocca & Dahlia Kholaif, Pope Francis Calls on Egypt’s Catholics to Embrace Forgiveness, Wall Street Journal (April 29, 2017).
- ^ Noha Elhennawy, Egyptian woman fights unequal Islamic inheritance laws, Associated Press (November 15, 2019).
- ^ "Five Things to Know About Egypt's Coptic Christians". Wall Street Journal. 16 February 2015.
- ^ "Egyptian Coptic protesters freed". BBC News. 22 December 2004.
- ^ "Egypt". The World Factbook. Central Intelligence Agency.
- ^ Jump up to: a b "Who are the 5 million refugees and immigrants in Egypt?". brookings.edu. 4 October 2016.
- ^ "2.2 million and extend into Egypt, Sudan and Eritrea", refworld.com
- ^ International Religious Freedom Report for 2014 US Department of State
- ^ International Religious Freedom Report 2006 – Egypt
- ^ Jump up to: a b International Religious Freedom Report 2007 – Egypt
- ^ CIA World Factbook – Egypt
- ^ [2][permanent dead link]
- ^ [3][permanent dead link]
- ^ Bekada A, Fregel R, Cabrera VM, Larruga JM, Pestano J, et al. (2013) Introducing the Algerian Mitochondrial DNA and Y-Chromosome Profiles into the North African Landscape. PLoS ONE 8(2): e56775. doi:10.1371/journal.pone.0056775
External links[]
| Wikimedia Commons has media related to Demographics of Egypt. |
| show |
|---|
| show Demographics of Asia |
|---|
- Demographics of Egypt