Demographics of Gabon
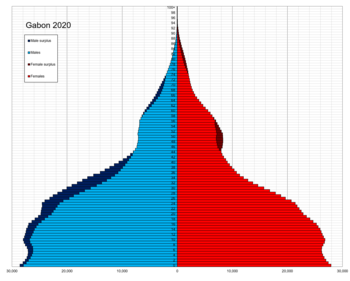
The Demographics of Gabon is the makeup of the population of Gabon. As of 2020, Gabon has a population of 2,225,287. Gabon's population is relatively young with 35.5% of its population under 15 years of age and only 4.3% of its population over 65 years old. Gabon has a nearly even split between males and females with 0.99 males for every female in the population. In the age range of 15–65, the ration is exactly 1 male to 1 female. The life expectancy of Gabon is lower than the world average. Gabon's population's life expectancy at birth is 53.11 years while the world average is 67.2 years as of 2010. Ethnically, the biggest group in Gabon are the Fang people with over 500,000 people, or about a third of Gabon's population, belonging to this ethnic group. The biggest religion in Gabon is Christianity, with between 55–75% of the population of Gabon being Christian.
Population[]
According to the 2019 revision of the World Population Prospects[1][2] the total population was 2,119,275 in 2018, compared to only 469,000 in 1950. The proportion of children below the age of 15 in 2010 was 35.5%, 60.2% was between 15 and 65 years of age, while 4.3% was 65 years or older .[3]
| Total population | Population aged 0–14 (%) | Population aged 15–64 (%) | Population aged 65+ (%) | |
|---|---|---|---|---|
| 1950 | 469 000 | 28.4 | 64.3 | 7.3 |
| 1955 | 476 000 | 29.4 | 63.5 | 7.1 |
| 1960 | 486 000 | 30.3 | 62.6 | 7.1 |
| 1965 | 502 000 | 31.9 | 61.1 | 7.1 |
| 1970 | 530 000 | 33.0 | 59.9 | 7.1 |
| 1975 | 595 000 | 35.2 | 58.0 | 6.8 |
| 1980 | 683 000 | 37.7 | 55.9 | 6.4 |
| 1985 | 794 000 | 40.0 | 54.0 | 6.0 |
| 1990 | 929 000 | 41.4 | 53.0 | 5.6 |
| 1995 | 1 087 000 | 42.0 | 52.8 | 5.1 |
| 2000 | 1 235 000 | 41.0 | 54.3 | 4.8 |
| 2005 | 1 371 000 | 38.6 | 57.0 | 4.4 |
| 2010 | 1 505 000 | 35.5 | 60.2 | 4.3 |
Structure of the population (DHS 2012; males 19,318, females 20,636, total 39,955):
| Age group | Male (%) | Female (%) | Total (%) |
|---|---|---|---|
| 0–4 | 16.0 | 14.3 | 15.1 |
| 5–9 | 12.4 | 12.4 | 12.4 |
| 10–14 | 12.0 | 12.5 | 12.3 |
| 15–19 | 9.6 | 9.9 | 9.7 |
| 20–24 | 7.6 | 9.6 | 8.7 |
| 25–29 | 7.5 | 8.4 | 8.0 |
| 30–34 | 7.8 | 7.0 | 7.4 |
| 35–39 | 6.6 | 5.4 | 5.9 |
| 40–44 | 5.4 | 4.4 | 4.9 |
| 45–49 | 4.1 | 3.3 | 3.7 |
| 50–54 | 3.4 | 4.2 | 3.8 |
| 55–59 | 2.0 | 2.3 | 2.1 |
| 60–64 | 2.6 | 1.7 | 2.1 |
| 65–69 | 1.1 | 1.4 | 1.2 |
| 70–74 | 0.9 | 1.3 | 1.1 |
| 75–79 | 0.6 | 0.7 | 0.6 |
| 80+ | 0.5 | 1.3 | 0.9 |
| Age group | Male (%) | Female (%) | Total (%) |
|---|---|---|---|
| 0–14 | 40.4 | 39.2 | 39.8 |
| 15–64 | 56.5 | 56.1 | 56.4 |
| 65+ | 3.1 | 4.7 | 3.8 |
Vital statistics[]
Registration of vital events is in Gabon not complete. The Population Department of the United Nations prepared the following estimates. [3]
| Period | Live births per year | Deaths per year | Natural change per year | CBR* | CDR* | NC* | TFR* | IMR* |
|---|---|---|---|---|---|---|---|---|
| 1950–1955 | 14,000 | 13,000 | 1,000 | 30.5 | 27.7 | 2.8 | 4.00 | 179 |
| 1955–1960 | 14,000 | 12,000 | 2,000 | 30.1 | 25.9 | 4.2 | 4.00 | 167 |
| 1960–1965 | 15,000 | 12,000 | 3,000 | 31.4 | 24.8 | 6.5 | 4.25 | 158 |
| 1965–1970 | 17,000 | 11,000 | 6,000 | 32.5 | 21.7 | 10.7 | 4.50 | 134 |
| 1970–1975 | 20,000 | 11,000 | 9,000 | 35.4 | 19.1 | 16.3 | 4.90 | 114 |
| 1975–1980 | 24,000 | 10,000 | 13,000 | 37.5 | 16.4 | 21.0 | 5.10 | 95 |
| 1980–1985 | 28,000 | 10,000 | 18,000 | 38.4 | 13.7 | 24.7 | 5.20 | 78 |
| 1985–1990 | 33,000 | 10,000 | 23,000 | 38.1 | 11.3 | 26.8 | 5.15 | 63 |
| 1990–1995 | 38,000 | 11,000 | 28,000 | 38.0 | 10.5 | 27.4 | 5.10 | 59 |
| 1995–2000 | 39,000 | 12,000 | 27,000 | 33.2 | 10.2 | 23.0 | 4.37 | 58 |
| 2000–2005 | 39,000 | 14,000 | 25,000 | 29.7 | 10.4 | 19.3 | 3.78 | 58 |
| 2005–2010 | 39,000 | 13,000 | 26,000 | 27.4 | 9.4 | 18.0 | 3.35 | 51 |
| * CBR = crude birth rate (per 1000); CDR = crude death rate (per 1000); NC = natural change (per 1000); IMR = infant mortality rate per 1000 births; TFR = total fertility rate (number of children per woman) | ||||||||
Fertility and births[]
Total Fertility Rate (TFR) (Wanted Fertility Rate) and Crude Birth Rate (CBR):[4]
| Year | CBR (Total) | TFR (Total) | CBR (Urban) | TFR (Urban) | CBR (Rural) | TFR (Rural) |
|---|---|---|---|---|---|---|
| 2000 | 33.1 | 4.3 (3.5) | 33.3 | 3.9 (3.2) | 32.4 | 5.7 (4.7) |
| 2012 | 33.3 | 4.1 (3.2) | 33.2 | 3.9 (3.0) | 33.4 | 6.1 (4.6) |
Fertility data as of 2012 (DHS Program):[5]
| Province | Total fertility rate | Percentage of women age 15–49 currently pregnant | Mean number of children ever born to women age 40–49 |
|---|---|---|---|
| Libreville/Port-Gentil | 3.5 | 9.3 | 4.4 |
| Estuaire (except Libreville) | 4.1 | 8.6 | 5.2 |
| Haut-Ogooué | 4.9 | 10.3 | 5.8 |
| Moyen-Ogooué | 4.9 | 8.9 | 5.4 |
| Ngounié | 5.7 | 10.9 | 6.0 |
| Nyanga | 5.7 | 10.7 | 6.2 |
| Ogooué Maritime (except Port-Gentil) | 4.8 | 9.8 | 4.6 |
| Ogooué-Ivindo | 6.7 | 14.0 | 6.6 |
| Ogooué-Lolo | 5.3 | 11.3 | 5.9 |
| Woleu-N’tem | 5.0 | 9.8 | 4.7 |
Life expectancy[]
| Period | Life expectancy in Years[6] |
|---|---|
| 1950–1955 | 37.00 |
| 1955–1960 | |
| 1960–1965 | |
| 1965–1970 | |
| 1970–1975 | |
| 1975–1980 | |
| 1980–1985 | |
| 1985–1990 | |
| 1990–1995 | |
| 1995–2000 | |
| 2000–2005 | |
| 2005–2010 | |
| 2010–2015 |
Other demographics statistics[]
Demographic statistics according to the World Population Review in 2019.[7]
- One birth every 9 minutes
- One death every 35 minutes
- One net migrant every 480 minutes
- Net gain of one person every 12 minutes
The following demographic statistics are from the CIA World Factbook.[8]
Population[]
- 2,119,036 (July 2018 est.)
Age structure[]

- 0-14 years: 37.45% (male 405,676 /female 387,900)
- 15-24 years: 22.08% (male 245,490 /female 222,343)
- 25-54 years: 31.6% (male 355,348 /female 314,344)
- 55-64 years: 4.96% (male 54,679 /female 50,356)
- 65 years and over: 3.91% (male 40,721 /female 42,179) (2018 est.)
Median age[]
- total: 20.5 years. Country comparison to the world: 187th
- male: 20.8 years
- female: 20.2 years (2018 est.)
Birth rate[]
- 26.5 births/1,000 population (2018 est.) Country comparison to the world: 46th
Death rate[]
- 6.2 deaths/1,000 population (2018 est.) Country comparison to the world: 157th
Total fertility rate[]
- 3.52 children born/woman (2018 est.) Country comparison to the world: 42nd
Population growth rate[]
- 2.73% (2018 est.) Country comparison to the world: 15th
Mother's mean age at first birth[]
- 20.3 years (2012 est.)
- note: median age at first birth among women 25-29
Contraceptive prevalence rate[]
- 31.1% (2012)
Net migration rate[]
- -2 migrant(s)/1,000 population (2017 est.) Country comparison to the world: 161st
Dependency ratios[]
- total dependency ratio: 67.4 (2015 est.)
- youth dependency ratio: 59.9 (2015 est.)
- elderly dependency ratio: 7.6 (2015 est.)
- potential support ratio: 13.2 (2015 est.)
Religions[]
- Roman Catholic 42.3%, Protestant 12.3%, other Christian 27.4%, Muslim 9.8%, animist 0.6%, other 0.5%, none/no answer 7.1% (2012 est.)
Urbanization[]
- urban population: 89.4% of total population (2018)
- rate of urbanization: 2.61% annual rate of change (2015-20 est.)
Life expectancy at birth[]
- total population: 68.1346 years (2018 est.)
- male: 66.3 years (2018 est.)
- female: 69.6 years (2018 est.)
Literacy[]
definition: age 15 and over can read and write (2015 est.)
- total population: 83.2% (2015 est.)
- male: 85.3% (2015 est.)
- female: 81% (2015 est.)
Unemployment, youth ages 15-24[]
- total: 35.7% (2010 est.)
- male: 30.5% (2010 est.)
- female: 41.9% (2010 est.)
Ethnic groups[]
Broad ethnic groups are:
- Bantu groups including four major groupings (Fang, Eshira, Punu, Teke)
- Other Africans, notably 'forest people' (pygmy, now sedentary) such as the Babongo tribe
- Europeans, including 10,700 French and 11,000 persons of dual nationality

2012 Census[9][]
| Groups | Percentage |
|---|---|
| Gabonese-born | 80.1% |
| Fang | 23.2% |
| Shira-Punu/Vili | 18.9% |
| Nzabi-Duma | 11.3% |
| Mbede-Teke | 6.9% |
| Myene | 5% |
| Kola-Kele | 4.9% |
| Okande-Tsogo | 2.1% |
| Pygmy | 0.3% |
| Other Gabonese Groups | 7.5% |
| Other | 19.9% |
| Cameroonian | 4.6% |
| Malian | 2.4% |
| Beninese | 2.1% |
| Acquired Gabonese Nationality | 1.6% |
| Togolese | 1.6% |
| Senegalese | 1.1% |
| Congolese (Brazzaville) | 1% |
| Other (Includes Congolese (Kinshasa), Equatorial Guinean, Nigerian ) | 5.5% |
Language and religion[]
Religions:[10] Roman Catholic 41.9%, Protestant 13.7%, other Christian 32.4%, Islam 6.4%, Animist 0.3%, other 0.3%, None/No Answer 5% (2012 est.)
Languages: French (official since colonial rule), Fang, Myene, , Bapounou/Eschira,
Literacy:
[10]
definition:
age 15 and over can read and write
total population:
83.2%
male:
85.3%
female:
81% (2015 est.)
References[]
| Wikimedia Commons has media related to Demographics of Gabon. |
- ^ ""World Population prospects – Population division"". population.un.org. United Nations Department of Economic and Social Affairs, Population Division. Retrieved November 9, 2019.
- ^ ""Overall total population" – World Population Prospects: The 2019 Revision" (xslx). population.un.org (custom data acquired via website). United Nations Department of Economic and Social Affairs, Population Division. Retrieved November 9, 2019.
- ^ a b "Population Division of the Department of Economic and Social Affairs of the United Nations Secretariat, World Population Prospects: The 2010 Revision". Esa.un.org. Retrieved 7 November 2017.
- ^ "MEASURE DHS: Demographic and Health Surveys". Microdata.worldbank.org. Retrieved 7 November 2017.
- ^ "Enquête Démographique et de Santé 2012" (PDF). Dhsprogram.com. Retrieved 7 November 2017.
- ^ "World Population Prospects - Population Division - United Nations". esa.un.org. Retrieved 2018-08-26.
- ^ "Gabon Population 2019", World Population Review
- ^ "The World FactBook - Eswatini", The World Factbook, July 12, 2018
 This article incorporates text from this source, which is in the public domain.
- ^ "Africa :: Gabon — The World Factbook - Central Intelligence Agency". www.cia.gov. Retrieved 2020-10-06.
- ^ a b "Africa :: GABON". CIA The World Factbook.
![]() This article incorporates public domain material from the CIA World Factbook document: "2006 edition".
This article incorporates public domain material from the CIA World Factbook document: "2006 edition".
| History |
|  | |
|---|---|---|---|
| Geography |
| ||
| Politics | |||
| Economy | |||
| Society |
| ||
- Demographics of Gabon
- Gabonese society