Demographics of Libya
| Regions with significant populations | |
|---|---|
| 6,754,507 (2018)[1] | |
| 350,000 (2016)[2] | |
| 350,000 (2016)[3] | |
| 50,600 (2019)[4] | |
| 20,000 (2017) | |
| 16,000[5] | |
| 14,827[5] | |
| 5,515[6][7] | |
| 2,269[8] | |
| 3,622 (2017) | |
| 2,979 (2000)[9] | |
| Languages | |
| Libyan, Berber (Nafusi, Tamasheq, Awjila), Teda, Greek, Turkish, Italian and English (main foreign) | |
| Religion | |
| Sunni Islam | |
This article is about Libyans (ليبيون) and their population density, ethnicity, education level, health of the populace, economic status, and religious affiliations, as well as other aspects of the Libyan population. No complete population or vital statistics registration exists in Libya.[citation needed] Of the over 6,000,000 Libyans that lived in Libya prior to the Libyan Crisis, more than a million were immigrants.[citation needed] The estimates in this article are from the 2019 revision of the World Population Prospects[10][11] which was prepared by the Population Division of the Department of Economic and Social Affairs of the United Nations Secretariat, unless otherwise indicated.[12]

The Libyan population resides in the country of Libya, a territory located on the Mediterranean coast of North Africa, to the west of and adjacent to Egypt. Most Libyans live in Tripoli. It is the capital of the country and first in terms of urban population, as well as Benghazi, Libya's second largest city.
History[]

Historically Berber, over the centuries, Libya has been occupied by the Phoenicians, Greeks, Romans, Arabs, and Italians. The Phoenicians had a big impact on Libya. Many of the coastal towns and cities of Libya were founded by the Phoenicians as trade outposts within the southern Mediterranean coast in order to facilitate the Phoenician business activities in the area. Starting in the 8th century BC, Libya was under the rule of the Phoenician Carthage.[clarification needed] After the Romans defeated Carthage in the Third Punic War, Libya became a Roman province under the name of Tripolitania until the 7th century AD when Libya was conquered by the Arab Muslims as part of the Arab conquest of North Africa. Centuries after that, the Ottoman Empire conquered Libya in 1551. It remained in control of its territory until 1911 when the country was conquered by Italy. In the 18th century Libya was used as the base for various pirates.the story of the , an Arab group from present-day Libia who dominated northern Lake Chad in the 19th century,. Since the Middle Ages, the populations of this region have shared close political, economic and social ties maintained by the mobility specific to the nomadic way of life. These relationships, fluid due to the difficulties of surviving in this difficult environment, have always been structured in turn, through conflict and cooperation, both of which produced rapidly changing alliances. In the middle of the 18th century, the carved out a vast area of influence for themselves in Sirte and Fezzan by force of arms and by their alliances with neighboring peoples and the Libian administration. Defeated by the Ottoman administration in Tripoli at the end of the 1830s, the survivors of the took refuge in the Lake Chad basin where they reconstituted the conditions for their success in Libia; they controlled trans-Saharan trade and maintained their links with Libian society. Despite the limits imposed on their action by the French colonization of Chad and the Italian colonization of Libia; the retained regional influence during colonial times and appear to maintain it today. In the Second World War Libya was one of the main battlegrounds of North Africa. During the war, the territory was under an Anglo-French military government until it was overrun by the Axis Powers, who, in turn, were defeated by the Allies in 1943.
In 1951, the country was granted independence by the United Nations, being governed by King Idris. In 1969, a military coup led by Muammar Gaddafi resulted in the overthrow of King Idris I. Gaddafi then established an anti-Western leadership. In 1970, Gaddafi ordered all British and American military bases closed.
The Libyan population has increased rapidly after 1969. They were only 2 million in 1968, and 5 million in 2006.[citation needed]. Many migrant workers came to Libya since 1969. Among the workers were construction workers and laborers from Tunisia, teachers and laborers from Egypt, teachers from Palestine, and doctors and nurses from Yugoslavia and Bulgaria. 1,000,000 workers, mainly from other neighboring African countries like Sudan, Niger, Chad and Mali, migrated to Libya in the 1990s, after changes were made to Libya's Pan-African policies.[13]
Gaddafi used money from the sale of oil to improve the living conditions of the population and to assist Palestinian guerrillas in their fight against the Israelis. In 1979, Libya fought in Uganda to assist the government of Idi Amin in the Ugandan Civil War, and in 1981, fought in the Libyan-Chadian War. Libya had occupied the Aozou Strip; however, in 1990 the International Court of Justice submitted the case and allowed the full recuperation of territory to Chad.
In September 2008, Italy and Libya signed a memorandum by which Italy would pay $5 billion over the next 20 years to compensate Libya for its dominion over Libya for its reign of 30 years.[14]
Since 2011, the country is swept by Libyan Civil War, which broke out between the Anti-Gaddafi rebels and the Pro-Gaddafi government in 2011, culminating in the death and overthrow of Gaddafi. Nevertheless, even today Libya still continues to generate problems within the area and beyond, greatly affecting its population and the migrant route to Europe.
Population[]

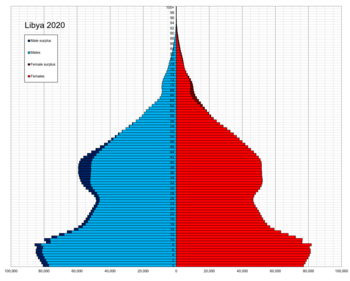
Libya has a small population residing in a large land area. Population density is about 50 persons per km² (130/sq. mi.) in the two northern regions of Tripolitania and Cyrenaica, but falls to less than one person per km² (2.7/sq. mi.) elsewhere. Ninety percent of the people live in less than 10% of the area, primarily along the coast. About 90%[15] of the population is urban, mostly concentrated in the four largest cities, Tripoli, Benghazi, Misrata and Bayda. As of 2019, twenty-eight percent of the population is estimated to be under the age of 15, but this proportion has decreased considerably during the past decades.[16]
| Total population (x 1000) | Population aged 0–14 (%) | Population aged 15–64 (%) | Population aged 65+ (%) | |
|---|---|---|---|---|
| 1801 | ~ 3 000 | -- | -- | -- |
| 1825 | ~ 3 059 | -- | -- | -- |
| 1850 | ~ 2 700 | -- | -- | -- |
| 1870 | ~ 2 400 | -- | -- | -- |
| 1910 | ~ 1 600 | -- | -- | -- |
| 1950 | 1 029 | 41.9 | 53.4 | 4.7 |
| 1955 | 1 126 | 43.0 | 52.7 | 4.3 |
| 1960 | 1 349 | 43.3 | 52.7 | 4.0 |
| 1965 | 1 623 | 43.4 | 53.0 | 3.6 |
| 1970 | 1 994 | 45.2 | 52.1 | 2.7 |
| 1975 | 2 466 | 46.5 | 51.3 | 2.2 |
| 1980 | 3 063 | 47.0 | 50.7 | 2.2 |
| 1985 | 3 850 | 47.3 | 50.5 | 2.3 |
| 1990 | 4 334 | 43.5 | 53.9 | 2.6 |
| 1995 | 4 775 | 38.3 | 58.8 | 2.9 |
| 2000 | 5 231 | 32.4 | 64.2 | 3.4 |
| 2005 | 5 770 | 30.6 | 65.6 | 3.8 |
| 2010 | 6 355 | 30.4 | 65.3 | 4.3 |
[citation needed]
Population History[]
Population census[]
Eight population censuses have been carried out in Libya, the first in 1931 and the most recent one in 2006.[17][18] The population multiplied sixfold between 1931 and 2006.
| Year | Males (thousands) | Females (thousands) | Total population (thousands) | Average annual growth rate (%) |
|---|---|---|---|---|
| 1931 | 704 | |||
| 1936 | 463 | 386 | 849 | 3.8 |
| 1954 | 564 | 524 | 1,089 | 1.4 |
| 1964 (July 31) | 813 | 751 | 1,564 | 3.7 |
| 1973 (July 31) | 1,192 | 1,057 | 2,249 | 4.1 |
| 1984 (July 31) | 1,954 | 1,689 | 3,643 | 4.5 |
| 1995 (August 11) | 2,237 | 2,168 | 4,405 | 1.7 |
| 2006 (April 15) | 2,934 | 2,723 | 5,658 | 2.3 |
Vital statistics[]
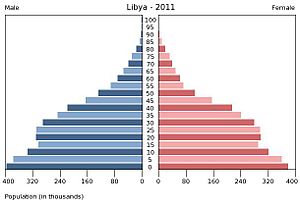
During the past 60 years the demographic situation of Libya changed considerably. Since the 1950s, life expectancy increased steadily and the infant mortality rates decreased. As the fertility rates remained high until the 1980s (the number of births tripled between 1950–55 and 1980–85), population growth was very high for three decades. However, after 1985 a fast decrease in fertility was observed from over 7 children per woman in the beginning of the 1980s to less than 3 in 2005-2010.[citation needed] Because of this decrease in fertility the population growth slowed down and also the proportion of Libyans under the age of 15 decreased from 47% in 1985 to 30% in 2010.[citation needed]
Births and deaths[]
| Period | Births | Deaths | Difference | CBR* | CDR* | NC* | IMR* | TFR* |
|---|---|---|---|---|---|---|---|---|
| 1950–1955 | 52,000 | 24,000 | 28,000 | 48.0 | 22.5 | 25.5 | 185.0 | 6.9 |
| 1955–1960 | 60,000 | 25,000 | 35,000 | 48.5 | 19.9 | 28.6 | 170.0 | 7.0 |
| 1960–1965 | 73,000 | 27,000 | 46,000 | 49.0 | 18.3 | 30.7 | 150.0 | 7.2 |
| 1965–1970 | 90,000 | 30,000 | 60,000 | 49.5 | 16.8 | 32.7 | 125.0 | 7.5 |
| 1970–1975 | 109,000 | 33,000 | 76,000 | 49.0 | 14.8 | 34.2 | 105.0 | 7.6 |
| 1975–1980 | 131,000 | 35,000 | 96,000 | 47.3 | 12.7 | 34.6 | 68.0 | 7.4 |
| 1980–1985 | 158,000 | 38,000 | 120,000 | 45.6 | 10.9 | 34.7 | 50.0 | 7.2 |
| 1985–1990 | 123,000 | 22,000 | 101,000 | 29.9 | 5.3 | 24.6 | 38.0 | 5.7 |
| 1990–1995 | 113,000 | 20,000 | 93,000 | 24.7 | 4.5 | 20.2 | 28.3 | 4.1 |
| 1995–2000 | 115,000 | 20,000 | 95,000 | 23.0 | 4.0 | 19.0 | 20.5 | 3.3 |
| 2000–2005 | 134,000 | 22,000 | 112,000 | 24.3 | 4.0 | 20.3 | 17.7 | 3.0 |
| 2005–2010 | 145,000 | 24,000 | 121,000 | 24.0 | 4.0 | 20.0 | 15.0 | 2.7 |
Births and deaths[19]
| Year | Population | Live births | Deaths | Natural increase | Crude birth rate | Crude death rate | Rate of natural increase | TFR |
|---|---|---|---|---|---|---|---|---|
| 1977 | 2,371,370 | 110,743 | 14,677 | 96,066 | 46.7 | 6.2 | 40.5 | |
| 1978 | 2,472,018 | 112,724 | 14,326 | 98,398 | 45.6 | 5.8 | 39.8 | |
| 1979 | 2,574,955 | 115,358 | 15,609 | 99,749 | 44.8 | 6.1 | 38.7 | |
| 1980 | 2,682,970 | 108,392 | 14,689 | 93,703 | 40.4 | 5.5 | 34.9 | |
| 1981 | 2,793,573 | 112,581 | 15,428 | 97,153 | 40.3 | 5.5 | 34.8 | |
| 1982 | 2,912,602 | 143,300 | 20,235 | 123,065 | 49.2 | 6.9 | 42.3 | |
| 1983 | 3,038,697 | 149,200 | 21,770 | 127,430 | 49.1 | 7.2 | 41.9 | |
| 1984 | 3,209,052 | 148,900 | 22,660 | 126,240 | 46.4 | 7.1 | 39.3 | |
| 1985 | 3,250,546 | 154,726 | 23,540 | 131,186 | 47.6 | 7.2 | 40.4 | |
| 1986 | 3,341,975 | 160,749 | 24,460 | 136,289 | 48.1 | 7.3 | 40.8 | |
| 1987 | 3,436,626 | 167,020 | 25,529 | 141,491 | 48.6 | 7.4 | 41.2 | |
| 1988 | 3,613,432 | 173,530 | 26,410 | 147,120 | 49.1 | 7.5 | 42.6 | |
| 1989 | 3,715,901 | 180,255 | 27,440 | 152,815 | 49.6 | 7.5 | 43.1 | |
| 1990 | 3,821,276 | 187,300 | 28,510 | 158,790 | 50.1 | 7.6 | 42.5 | |
| 1991 | 3,929,641 | 177,810 | 29,621 | 148,189 | 46.3 | 7.7 | 38.6 | |
| 1992 | 4,041,081 | 182,530 | 32,977 | 149,553 | 46.2 | 8.3 | 37.9 | |
| 1993 | 4,153,682 | 102,918 | 13,241 | 89,677 | 25.3 | 3.3 | 22.0 | |
| 1994 | 4,273,535 | 98,423 | 14,036 | 84,387 | 23.6 | 3.4 | 20.2 | |
| 1995 | 4,389,739 | 88,779 | 13,538 | 75,241 | 20.3 | 3.1 | 17.2 | |
| 1996 | 4,429,305 | 90,428 | 12,281 | 78,147 | 20.5 | 2.8 | 17.7 | |
| 1997 | 4,510,406 | 85,358 | 14,660 | 70,698 | 19.0 | 3.3 | 15.7 | |
| 1998 | 4,592,539 | 91,722 | 14,895 | 76,827 | 20.1 | 3.3 | 16.8 | |
| 1999 | 4,676,398 | 93,775 | 16,293 | 77,482 | 20.1 | 3.5 | 16.6 | |
| 2000 | 4,762,025 | 96,773 | 16,865 | 79,908 | 20.4 | 3.6 | 16.8 | |
| 2001 | 4,848,740 | 99,187 | 18,334 | 80,853 | 20.6 | 3.8 | 16.8 | |
| 2002 | 4,937,281 | 109,084 | 18,770 | 90,314 | 22.2 | 3.8 | 18.4 | |
| 2003 | 5,027,438 | 110,488 | 20,418 | 90,070 | 22.1 | 4.1 | 18.0 | |
| 2004 | 5,119,497 | 119,633 | 15,765 | 103,868 | 23.5 | 3.1 | 20.4 | |
| 2005 | 5,212,984 | 120,999 | 16,425 | 104,574 | 23.3 | 3.2 | 20.1 | |
| 2006 | 5,298,152 | 124,541 | 17,975 | 106,566 | 23.3 | 3.4 | 19.9 | |
| 2007 | 5,408,381 | 128,337 | 20,044 | 108,293 | 23.7 | 3.7 | 20.0 | |
| 2008 | 5,504,918 | 132,826 | 21,481 | 111,345 | ||||
| 2009 | 5,607,675 | 134,682 | 22,859 | 111,823 | 22.0 | 3.7 | ||
| 2010 | 5,687,248 | 148,385 | 26,426 | 121,959 | ||||
| 2011 | 5,788,481 | 150,448 | 29,890 | 120,558 | ||||
| 2012 | 202,265 | |||||||
| 2013 | 230,715 | |||||||
| 2014 | 234,006 | |||||||
| 2015 | 208,978 | |||||||
| 2019 | 6,777,452 | ~125,000 | ~34,500 | 18.5 | 5.1 | 2.2 |
Life expectancy at birth[]
- 1950-1955: 42.85 years
- 1955-1960: 45.4 years
- 1960-1965: 48.1 years
- 1965-1970: 50.5 years
- 1970-1975: 52.8 years
- 1975-1980: 56.45 years
- 1980-1985: 60.2 years
- 1985-1990: 63.5 years
- 1990-1995: 65.85 years
- 1995-2000: 67.2 years
- 2000-2005: 68.8 years
- 2005-2010: 69.9 years
CIA World Factbook demographic statistics[]
The following demographic statistics are from the CIA World Factbook, unless otherwise indicated.[20]
Vital statistics[]
Population
- 6,754,507 (July 2018 est.)
Age structure
- 0-14 years: 25.53% (male 882,099/ female 842,320)
- 15-24 years: 16.81% (male 582,247/ female 553,004)
- 25-54 years: 47.47% (male 1,684,019/ female 1,522,027)
- 55-64 years: 5.77% (male 197,196/ female 192,320)
- 65 years and over: 4.43% (male 147,168/ female 152,107) (2018 est.)
Median age
- total: 29.4 years
- male: 29.5 years
- female: 29.2 years (2018 est.)
Population growth rate
- 1.45% (2018 est.)
Birth rate
- 17.2 births/1,000 population (2018 est.)
Death rate
- 3.7 deaths/1,000 population (2018 est.)
Net migration rate
- 0.9 migrant(s)/1,000 population (2018 est.)
Total fertility rate
- 3.71 children born/woman (2000 est.)
- 3.01 children born/woman (2010 est.)
- 2.12 children born/woman (2012 est.)
- 2.03 children born/woman (2018 est.)
Urbanization
- urban population: 80.1% of total population (2018)
- rate of urbanization: 1.68% annual rate of change (2015-20 est.)
Sex ratio
- at birth: 1.05 male(s)/female
- 0–14 years: 1.05 male(s)/female
- 15–24 years: 1.06 male(s)/female
- 25–54 years: 1.1 male(s)/female
- 55–64 years: 1.04 male(s)/female
- 65 years and over: 1.01 male(s)/female
- total population: 1.07 male(s)/female (2017 est.)
Infant mortality rate
- total: 10.5 deaths/1,000 live births
- male: 11.3 deaths/1,000 live births
- female: 9.6 deaths/1,000 live births (2018 est.)
Life expectancy at birth
- total population: 76.9 years
- male: 75.1 years
- female: 78.7 years (2018 est.)
Ethnic and tribal groups[]

Ethnic groups[]
Although the CIA World Factbook claims that Libya's population is 97% Arab and Berber,[21] the 1936 census, which allowed citizens to declare their ethnicity, showed a more diverse population:
| Ethnic group | Population | % of Libya's total population |
|---|---|---|
| Arab | 2,316,902 | 34% |
| Arab-Berber | 1,585,902 | 28% |
| Berbers | 1,170,174 | 26.4% |
| Turks | 15,062 | 1.7% |
| Black | 30,079 | 4% |
| White | 22,530 | 3% |
| Others | 29,634 | 4% |
| Libya, Total | 5,150,851 | 100% |
The population of Libya is primarily of Arab and Berber ancestral origin.[23] Among the non-Arabized Berber groups are the nomadic Tuareg, who inhabit the southern areas as well as parts of Algeria, Mali, Niger and Burkina Faso. A few other tribal groups that still speak the native Berber languages are concentrated in the northwestern portion of Tripolitania. In the southeast, there are small populations of Toubou (Tibbu). They occupy between a quarter and a third of the country and also inhabit Niger and Chad. Among foreign residents, the largest groups are from other African nations, including citizens of other North African nations (primarily Egyptians) and West Africans.
Tribal groups[]
Libyan society is to a large extent structured along tribal lines, with more than 20 major tribal groups.[24]
The major tribal groups of Libya in 2011 were listed:[24]
- : , , , , , ,
- : Warfalla, , Al-Zintan, ,
- : , , , , , Al-Zuwayya,
- Sirte Beduin:, Qadhadhfa, Al-Magarha, , , , ,
- Fezzan:, , ; Toubou, Tuareg
- Kufra: Al-Zuwayya; Toubou
Some of the ancient Berber tribes include: Adyrmachidae, Auschisae, Es'bet, Temeh’u, Teh’nu, Rebu, Kehek, KeyKesh, Imukehek, Meshwesh, Macetae, Macatutae, Nasamones, Nitriotae, and Tautamaei.[13]
As of 2012 the major tribal groups of Libya, by region, were as follows:[25]
- Tripolitania: alawana-Souk El Joma'a, AL-Mahameed, Warfalla, Tarhona, Misurata tribes, Al-Jawary, Siyan Tribe, The Warshfana tribes, Zawia Groups, Ghryan Tribes, AL-Asabea, Al-Fwatir, Awlad Busayf, Zintan, Al-jbalya, Zwara, Alajelat, Al-Nawael tribe, Alalqa tribe, Al-Rijban, al Mashashi, Amaym.
- Cyrenaica: AJ-JWAZY, Al-Awagir, Magharba, Al-Abaydat, Drasa, Al-Barasa, Al-Fawakhir, Zuwayya, Majabra, Awama, Minfa, Taraki, alawana, Shwa'ir and in Kufra Zuwayya; Toubou.
- Sirte: Awlad-Suleiman, Qadhadhfa, Magharba, Al-Hosoon, Ferrjan
- Fezzan: Awlad Suleiman, Al-Riyyah, Magarha, Al-Zuwaid, Al-Hutman, Al-Hassawna; Toubou, Tuareg.
- Kufra: Zuwayya; Toubou.
Foreign population[]
This section does not cite any sources. (June 2020) |

The foreign population is estimated at 3%, most of whom are migrant workers in the oil industry from Tunisia and Egypt, but also including small numbers of Greeks, Maltese, Italians, Pakistanis, Palestinians, Turks, Indians, and people from former Yugoslavia. Due to the Libyan Civil War, most of these migrant workers have returned to their homelands or simply left the country for a different one.
However, according to news accounts in Allafrica.com, and the Libya Herald, between 1 million and 2 million Egyptians are resident in Libya and the Sudanese number in the hundreds of thousands. If this is correct, the foreign population could be as high as 30% of the country, as simultaneously at least two million Libyans have fled since the NATO intervention of 2011, toppling the previous Libyan government.
Genetics[]
Y-chromosome[]
Analysis of Y-chromosome have found three Y-chromosome lineages (E1b1b-M81, J-M267 and E1b1b-M78) at high frequency in Libya like in other North African populations. Some studies suggest a Paleolithic component for E-M81 and E-M78, while other studies point to a Neolithic origin. E1b1b-M78 has probably emerged in the Egypt/Libya area and is today widely distributed in North Africa, East Africa, and West Asia. E1b1b-M81 show high frequencies in Northwestern Africa and a high prevalence among Berbers (it is sometimes referred to as a genetic "Berber marker"). Its frequency declines towards Egypt and the Levant. On the other hand, E-M78 and E-M123 are frequent in the Levant and Egypt and decline towards Northwest Africa. Another common paternal lineage in Libya and North Africa is haplogroup J through its subtypes J1 (M267) and J2 (M172). J1 is prevalent in some North African and all Levantine groups and found at high frequencies in the Arabian Peninsula. It has been previously associated with the Islamic expansion. J2 is sporadically detected in North Africa and Iberia and is very frequent in the Levant/Anatolia/Iran region. Its spread in the Mediterranean is believed to have been facilitated by the maritime trading culture of the Phoenicians (1550 BC- 300 BC). E-M2 is the predominant lineage in Western Africa.
Listed here are the human Y-chromosome DNA haplogroups in Libya.[26]
| Hg | Libya (n=215) |
| E-M81 | 35.88% |
| J-M267 | 30.53% |
| E-M78 | 11.07% |
| E-M2 | 8.78% |
| G-M201 | 4.20% |
| J-M172 | 3.44% |
| R* | 3.43% |
| E-M123 | 1.53% |
| E* | 0.76% |
| R-M17 | 0.38% |
Religions[]
The vast majority Libyans are nominally Sunni Muslim. Almost 3% of the population is Christian, with some local Christian church adherents in Eastern Libya - the Copts. A small Jewish community historically lived in Libya since antiquity (see History of the Jews in Libya), but the almost the entire Jewish community in Libya eventually fled the country for Italy, Israel, or the United States, particularly after anti-Jewish riots in the wake of the 1967 Six-Day War between Arab countries and Israel. The final Jew in Libya, Esmeralda Meghnagi, died in 2002 ending the several millennia long Jewish ancestral body in Libya.[27]
Culture[]
Cuisine[]
Libyan cuisine is heavily influenced by Mediterranean, Arabic and North African (Berber cuisine) traditions. Notable dishes include Shorba Arabiya, or Arabian soup, which is a thick, highly spiced soup.[28] Like other Maghrebi countries, couscous and tajine are traditional of Libya. Bazeen is a traditional Libyan food, made from a mix of barley flour and a small amount of plain flour.
Music[]
Libyan origin instruments are the Zukra (a bagpipe), a flute (made of bamboo), the tambourine, the oud (a fretless lute) and the darbuka (a goblet drum held sideways and played with the fingers). Bedouin poet-singers had a great influence on the musical folklore of Libya, particularly the style of , the camel driver's song.
Language[]
The official language of Libya is Standard Arabic, while the most prevalent spoken language is Libyan Arabic. Berber is also common, spoken by about 300,000 Libyans. Arabic varieties are partly spoken by immigrant workers and partly by local Libyan populations. These varieties include Egyptian, Tunisian, Sudanese, Moroccan, Ta'izzi-Adeni, Hassaniyya and South Levantine Arabic.
Berber languages are primarily still spoken by the Tuareg, a rural Berber population inhabiting Libya's south.[29]
Indigenous minority languages in Libya:[30]
- : ~300.000 speakers
- Domari: ~20.000 speakers
- Tripoli: ~50.000 speakers
Non-Arabic languages had largely been spoken by foreign workers (who had been massively employed in Libya in various infrastructure projects prior to the 2011 civil war), and those languages with more than 10,000 speakers included Punjabi, Urdu, Mandarin, Cantonese, Korean, Sinhala, Bengal, Tamil, Tagalog, French, Italian, Ukrainian, Serbian, and English.
See also[]
References[]
| Wikimedia Commons has media related to Demographics of Libya. |
- ^ "Libya". CIA World Factbook. Retrieved 20 September 2015.
- ^ "الشؤون الاجتماعية : هذا عدد الليبيين المقيمين بتونس". Retrieved 7 October 2018.
- ^ "Libyans in Egypt losing hope of returning home". Retrieved 7 October 2018.
- ^ "Jews, by Country of Origin and Age" (PDF). Retrieved 13 March 2021.
- ^ Jump up to: a b EU Migration Policy Centre. "Migration Facts Libya April 2013" (PDF). Retrieved 26 December 2016.
- ^ Statistics Canada (8 May 2013). "2011 National Household Survey: Data tables". Retrieved 11 February 2014.
- ^ "Libyan Canadians cast ballots in first post-Gadhafi election - iPolitics". ipolitics.ca. 3 July 2012. Retrieved 1 April 2018.
- ^ Serbian Government. "MMIGRATION PROFILE OF THE REPUBLIC OF SERBIA FOR 2014" (PDF). Archived from the original (PDF) on 6 December 2017. Retrieved 11 April 2016.
- ^ https://www.census.gov/population/socdemo/ancestry/ancestry_q_by_DAC_2000.xls
- ^ ""World Population prospects – Population division"". population.un.org. United Nations Department of Economic and Social Affairs, Population Division. Retrieved November 9, 2019.
- ^ ""Overall total population" – World Population Prospects: The 2019 Revision" (xslx). population.un.org (custom data acquired via website). United Nations Department of Economic and Social Affairs, Population Division. Retrieved November 9, 2019.
- ^ World Population Prospects: The 2010 Revision Archived May 6, 2011, at the Wayback Machine
- ^ Jump up to: a b http://www.temehu.com/Libyan-People.htm Temehu. Libyan people and Ethnic tribes. Retrieved 4 January 2011.
- ^ http://www.hejleh.com/countries/libya.html The Country & People of Libya. Posted 2003. Retrieved January 4, 2012, to 23:53 pm.
- ^ "Save BIG with $9.99 .COMs from GoDaddy!". Go Daddy. Archived from the original on 6 June 2017. Retrieved 1 April 2018.
- ^ "Population ages 0-14 (% of total population) - Libya | Data". data.worldbank.org. Retrieved 2021-05-07.
- ^ B.R. Mitchell. International historical statistics: Africa, Asia & Oceania 1750-2000.
- ^ "United nations. Demographic Yearbooks 1948-2008". un.org. Retrieved 1 April 2018.
- ^ "United Nations Statistics Division - Demographic and Social Statistics". un.org. Retrieved 1 April 2018.
- ^ "The World Factbook — Central Intelligence Agency". www.cia.gov. Retrieved 1 April 2018.
- ^ Jump up to: a b "Africa :: LIBYA". CIA The World Factbook.
- ^ Pan, Chia-Lin (1949), "The Population of Libya", Population Studies, 3 (1): 100–125, doi:10.1080/00324728.1949.10416359
- ^ "Population of Libya". Fanack.com. Retrieved 2019-06-27.
- ^ Jump up to: a b Editorial, Reuters. "UPDATE 1-FACTBOX-Tribal ties key to Gaddafi rule". reuters.com. Archived from the original on 16 July 2011. Retrieved 1 April 2018.
- ^ Souhail Karam, Jon Hemming, Tribal ties key to Gaddafi rule, Reuters (2011)[1]
- ^ Karima Fadhlaoui-Zid et al. (2013) Genome-Wide and Paternal Diversity Reveal a Recent Origin of Human Populations in North Africa. PLoS One. 2013; 8(11): e80293. See Table S2
- ^ "Jews of Libya".
- ^ Served as "starter", the soup is mentioned in the New York Times
- ^ "Libyan People". www.libyaweb.com. Retrieved 1 April 2018.
- ^ (in English) Ethnologue report for Libya, Languages of Libya
| show Libya |
|---|

- Demographics of Libya