Demographics of Namibia
This article is about the demographic features of the population of Namibia, including population density, ethnicity, education level, health of the populace, economic status, religious affiliations and other aspects of the population.
Population[]


Census results[]
| Year | Pop. | ±% p.a. |
|---|---|---|
| 1921 | 228,916 | — |
| 1936 | 320,457 | +2.27% |
| 1946 | 362,464 | +1.24% |
| 1951 | 439,081 | +3.91% |
| 1970 | 761,010 | +2.94% |
| 1981 | 1,033,196 | +2.82% |
| 1991 | 1,409,915 | +3.16% |
| 2001 | 1,830,330 | +2.64% |
| 2011 | 2,113,077 | +1.45% |
As required by the Namibian Statistics Act #66 of 1976, and in accordance with United Nations recommendations, a census is conducted every ten years. After Namibian independence the first Population and Housing Census was carried out in 1991, further rounds followed in 2001 and 2011.[1] The data collection method is to count every person resident in Namibia wherever they happen to be. This is called the de facto method.[2] For enumeration purposes the country is demarcated into 4,042 enumeration areas. These areas overlap with constituency boundaries in order to get reliable data for election purposes as well.[3]
The 2011 Population and Housing Census counted 2,113,077 inhabitants of Namibia. Between 2001 and 2011 the annual population growth was 1.4%, down from 2.6% in the previous ten–year period.[4]
In 2011 the total fertility rate was 3.6 children per woman, down from 4.1 in 2001.
UN estimates[]
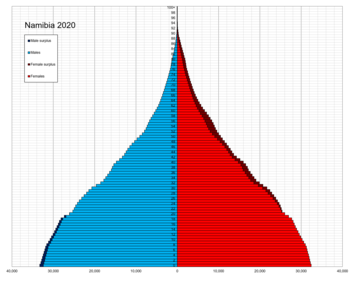
According to the 2019 revision of the World Population Prospects[5][6] the total population was 2,448,301 in 2018, compared to only 485 000 in 1950. The proportion of children below the age of 15 in 2010 was 36.4%, 59.9% was between 15 and 65 years of age, while 3.7% was 65 years or older .[7]
| Total population | Population aged 0–14 (%) | Population aged 15–64 (%) | Population aged 65+ (%) | |
|---|---|---|---|---|
| 1950 | 485 000 | 38.8 | 57.1 | 4.1 |
| 1955 | 538 000 | 40.5 | 55.6 | 4.0 |
| 1960 | 603 000 | 41.6 | 54.7 | 3.7 |
| 1965 | 683 000 | 42.5 | 53.9 | 3.6 |
| 1970 | 780 000 | 43.1 | 53.3 | 3.6 |
| 1975 | 906 000 | 44.3 | 52.2 | 3.5 |
| 1980 | 1 013 000 | 46.6 | 49.9 | 3.5 |
| 1985 | 1 150 000 | 47.0 | 49.5 | 3.5 |
| 1990 | 1 415 000 | 43.7 | 53 | 3.4 |
| 1995 | 1 651 000 | 42 | 54.6 | 3.4 |
| 2000 | 1 896 000 | 40.3 | 56.3 | 3.4 |
| 2005 | 2 080 000 | 38.9 | 57.6 | 3.4 |
| 2010 | 2 283 000 | 36.4 | 59.9 | 3.7 |
Vital statistics[]
Registration of vital events in Namibia is not complete. The Population Departement of the United Nations prepared the following estimates. [7]
| Period | Live births per year | Deaths per year | Natural change per year | CBR* | CDR* | NC* | TFR* | IMR* |
|---|---|---|---|---|---|---|---|---|
| 1950-1955 | 22 000 | 12 000 | 10 000 | 43.4 | 22.9 | 20.4 | 6.00 | 172 |
| 1955-1960 | 24 000 | 11 000 | 13 000 | 42.7 | 19.9 | 22.8 | 6.10 | 149 |
| 1960-1965 | 27 000 | 11 000 | 16 000 | 42.3 | 17.4 | 24.9 | 6.20 | 130 |
| 1965-1970 | 31 000 | 11 000 | 20 000 | 42.4 | 15.4 | 27.0 | 6.30 | 115 |
| 1970-1975 | 37 000 | 12 000 | 26 000 | 44.2 | 13.8 | 30.4 | 6.60 | 101 |
| 1975-1980 | 42 000 | 12 000 | 30 000 | 43.8 | 12.1 | 31.6 | 6.60 | 88 |
| 1980-1985 | 45 000 | 11 000 | 33 000 | 41.2 | 10.4 | 30.8 | 6.20 | 75 |
| 1985-1990 | 50 000 | 12 000 | 38 000 | 39.1 | 9.5 | 29.6 | 5.55 | 69 |
| 1990-1995 | 56 000 | 14 000 | 43 000 | 36.7 | 8.9 | 27.8 | 4.91 | 62 |
| 1995-2000 | 58 000 | 17 000 | 42 000 | 32.9 | 9.3 | 23.6 | 4.29 | 55 |
| 2000-2005 | 59 000 | 21 000 | 38 000 | 29.9 | 10.6 | 19.3 | 3.81 | 48 |
| 2005-2010 | 60 000 | 19 000 | 41 000 | 27.4 | 8.6 | 18.8 | 3.40 | 38 |
| * CBR = crude birth rate (per 1000); CDR = crude death rate (per 1000); NC = natural change (per 1000); IMR = infant mortality rate per 1000 births; TFR = total fertility rate (number of children per woman) | ||||||||
Births and deaths[8]
| Year | Population | Live births | Deaths | Natural increase | Crude birth rate | Crude death rate | Rate of natural increase | TFR |
|---|---|---|---|---|---|---|---|---|
| 1991 | 1,409,920 | 60,731 | 43.1 | 6.1 | ||||
| 2001 | 1,830,330 | 37,592 | 4.1 | |||||
| 2011 | 2,113,077 | 62,046 | 22,668 | 39,378 | 29.4 | 10.7 | 18.7 | 3.6 |
Fertility and births[]
Total Fertility Rate (TFR) (followed by wanted fertility rate in brackets) and Crude Birth Rate (CBR):[9]
| Year | CBR (Total) | TFR (Total) | CBR (Urban) | TFR (Urban) | CBR (Rural) | TFR (Rural) |
|---|---|---|---|---|---|---|
| 1992 | 42 | 5,4 (4,8) | 43 | 4,0 (3,4) | 42 | 6,3 (5,8) |
| 2000 | 30,5 | 4,2 (3,4) | 29,9 | 3,1 (2,4) | 30,8 | 5,1 (4,2) |
| 2006-2007 | 29,2 | 3,6 (2,7) | 28,8 | 2,8 (2,2) | 29,6 | 4,3 (3,3) |
| 2013 | 29,5 | 3,6 (2,9) | 30,0 | 2,9 (2,4) | 29,3 | 4,7 (3,5) |
Fertility data as of 2013 (DHS Program):[10]
| Region | Total fertility rate | Percentage of women age 15-49 currently pregnant | Mean number of children ever born to women age 40-49 |
|---|---|---|---|
| Zambezi | 4.2 | 4.5 | 4.4 |
| Erongo | 2.9 | 6.1 | 3.3 |
| Hardap | 3.7 | 3.8 | 3.4 |
| Karas | 3.4 | 6.4 | 3.4 |
| Kavango | 4.6 | 6.8 | 5.4 |
| Khomas | 2.6 | 6.4 | 2.7 |
| Kunene | 4.5 | 8.5 | 4.6 |
| Ohangwena | 5.3 | 9.8 | 5.2 |
| Omaheke | 4.6 | 8.6 | 4.2 |
| Omusati | 4.2 | 6.3 | 3.6 |
| Oshana | 2.7 | 6.2 | 3.1 |
| Oshikoto | 4.2 | 5.7 | 4.0 |
| Otjozondjupa | 4.1 | 5.4 | 4.0 |
Life expectancy at birth[]
Life expectancy from 1950 to 2015 (UN World Population Prospects):[11]
| Period | Life expectancy in Years |
|---|---|
| 1950–1955 | 41.75 |
| 1955–1960 | |
| 1960–1965 | |
| 1965–1970 | |
| 1970–1975 | |
| 1975–1980 | |
| 1980–1985 | |
| 1985–1990 | |
| 1990–1995 | |
| 1995–2000 | |
| 2000–2005 | |
| 2005–2010 | |
| 2010–2015 |
Ethnic groups[]
The majority of the Namibian population is of Bantu-speaking origin—mostly of the Ovambo ethnicity, which forms about half of the population—residing mainly in the north of the country, although many are now resident in towns throughout Namibia. Other ethnic groups are the Herero and Himba people, who speak a similar language, and the Damara, who speak the same "click" language as the Nama.
In addition to the Bantu majority, there are large groups of Khoisan (such as Nama and San), who are descendants of the original inhabitants of Southern Africa. The country also contains some descendants of refugees from Angola. There are also two smaller groups of people with mixed racial origins, called "Coloureds" and "Basters", who together make up 8.0% (with the Coloureds outnumbering the Basters two to one). There is a substantial Chinese minority in Namibia; it stood at 40,000 in 2006.[12]

Whites (mainly of Afrikaner, German, British and Portuguese origin) make up between 4.0 and 7.0% of the population. Although their proportion of the population decreased after independence due to emigration and lower birth rates, they still form the second-largest population of European ancestry, both in terms of percentage and actual numbers, in Sub-Saharan Africa (after South Africa).[13] The majority of Namibian whites and nearly all those who are of mixed race, speak Afrikaans and share similar origins, culture, and religion as the white and coloured populations of South Africa. A large minority of whites (around 30,000) trace their family origins back to the German settlers who colonised Namibia prior to the British confiscation of German lands after World War I, and they maintain German cultural and educational institutions. Nearly all Portuguese settlers came to the country from the former Portuguese colony of Angola.[14] The 1960 census reported 526,004 persons in what was then South West Africa, including 73,464 whites (14%).[15]
Languages[]
- Oshiwambo - 48.9%[16]
- Khoekhoegowab - 11.3%
- Afrikaans - 10.4%
- Otjiherero - 8.6%
- RuKwangali - 8.5%
- siLozi - 4.8%
- English (official language) - 3.4%
- Setswana - 0.3%
- Other African languages - 2.3%
- Other - 1.7%


Religion[]
Missionary work during the 19th century drew many Namibians to Christianity, especially Lutheranism. While most Namibian Christians are Lutheran, there also are Roman Catholic, Methodist, Anglican, African Methodist Episcopal, and Dutch Reformed Christians represented.
Other demographic statistics[]
Modern education and medical care have been extended in varying degrees to most rural areas in recent years. The literacy rate of Africans is generally low except in sections where missionary and government education efforts have been concentrated, such as Ovamboland. The Africans speak various indigenous languages.
Demographic statistics according to the World Population Review in 2019.[17]
- One birth every 7 minutes
- One death every 29 minutes
- One net migrant every 1440 minutes
- Net gain of one person every 10 minutes
The following demographic are from the CIA World Factbook[18] unless otherwise indicated.
Population[]
- 2,533,224 (July 2018 est.)
Age structure[]

- 0-14 years: 36.54% (male 467,392 /female 458,190)
- 15-24 years: 20.34% (male 257,190 /female 257,984)
- 25-54 years: 34.74% (male 421,849 /female 458,118)
- 55-64 years: 4.46% (male 50,459 /female 62,478)
- 65 years and over: 3.93% (male 42,381 /female 57,183) (2018 est.)
Birth rate[]
- 25.33 births/1,000 population (2021 est.) Country comparison to the world: 45th
Death rate[]
- 7.07 deaths/1,000 population (2021 est.) Country comparison to the world: 117th
Total fertility rate[]
- 3.03 children born/woman (2021 est.) Country comparison to the world: 48th
Median age[]
- total: 21.8 years. country comparison to the world: 183rd
- male: 21.1 years
- female: 22.6 years (2021 est.)
Population growth rate[]
- 1.83% (2020 est.) Country comparison to the world: 45th
Mother's mean age at first birth[]
- 21.5 years (2013 est.)
- note: median age at first birth among women 25-29[clarification needed]
Contraceptive prevalence rate[]
- 56.1% (2013)
Net migration rate[]
- 0 migrant(s)/1,000 population (2017 est.) Country comparison to the world: 94th
Dependency ratios[]
- total dependency ratio: 68.1 (2015 est.)
- youth dependency ratio: 62.2 (2015 est.)
- elderly dependency ratio: 5.8 (2015 est.)
- potential support ratio: 17.1 (2015 est.)
Urbanization[]
- urban population: 50% of total population (2018)
- rate of urbanization: 4.2% annual rate of change (2015-20 est.)
Sex ratio[]
at birth:
1.03 male(s)/female (2017 est.)
under 15 years:
1.02 male(s)/female (2017 est.)
15–64 years:
0.99 male(s)/female (2017 est.)
65 years and over:
0.75 male(s)/female (2017 est.)
total population:
0.96 male(s)/female (2017 est.)
Life expectancy at birth[]
- total population: 65.87 years (2021 est.) Country comparison to the world: 197th
- male: 63.9 years (2021 est.)
- female: 67.9 years (2021 est.)
HIV/AIDS[]
adult prevalence rate: 12.7% (2019 est.) Country comparison to the world: 6th
people living with HIV/AIDS: 210,000 (2019 est.)
deaths: 3,000 (2019 est.)
Nationality[]
noun:
Namibian(s)
adjective:
Namibian
Literacy[]
definition: age 15 and over can read and write (2015 est.)
- total population: 91.5% (2018 est.)
- male: 91.6% (2018 est.)
- female: 91.4% (2018 est.)
Unemployment, youth ages 15-24[]
- total: 38% (2016 est.)
- male: 37.5% (2016 est.)
- female: 38.5% (2016 est.)
References[]
- ^ "Census Summary Results". National Planning Commission of Namibia. Archived from the original on 11 January 2012. Retrieved 21 February 2012.
- ^ Kapitako, Alvine (8 August 2011). "Namibia: 2011 Census Officially Launched". New Era. via allafrica.com.
- ^ "Methodology". National Planning Commission of Namibia. Archived from the original on 11 January 2012. Retrieved 21 February 2012.
- ^ Duddy, Jo Maré (28 March 2013). "Census gives snapshot of Namibia's population". The Namibian.
- ^ ""World Population prospects – Population division"". population.un.org. United Nations Department of Economic and Social Affairs, Population Division. Retrieved November 9, 2019.
- ^ ""Overall total population" – World Population Prospects: The 2019 Revision" (xslx). population.un.org (custom data acquired via website). United Nations Department of Economic and Social Affairs, Population Division. Retrieved November 9, 2019.
- ^ Jump up to: a b Population Division of the Department of Economic and Social Affairs of the United Nations Secretariat, World Population Prospects: The 2010 Revision Archived May 6, 2011, at the Wayback Machine
- ^ "Publications - Namibia Statistics Agency".
- ^ "MEASURE DHS: Demographic and Health Surveys". microdata.worldbank.org.
- ^ "Namibia Demographic and Health Survey 2013" (PDF). Namibia Demographic and Health Survey. 2013.
- ^ "World Population Prospects – Population Division – United Nations". Retrieved 2017-07-15.
- ^ Malia Politzer (August 2008). "China and Africa: Stronger Economic Ties Mean More Migration". Migration Information Source. Retrieved 10 September 2013.
- ^ Central Intelligence Agency (2009). "Namibia". The World Factbook. Retrieved 23 January 2010.
- ^ "Flight from Angola". The Economist. 16 August 1975. Retrieved 10 September 2013.
- ^ Singh, Lalita Prasad (1980). The United Nations and Namibia. East African Publishing House.
- ^ Jump up to: a b c d "Africa :: NAMIBIA". CIA The World Factbook.
- ^ "Namibia Population 2019", World Population Review
- ^ "The World FactBook - Namibia", The World Factbook, March 4, 2021
 This article incorporates text from this source, which is in the public domain.
External links[]
| Wikimedia Commons has media related to Demographics of Namibia. |
- Demographics of Namibia