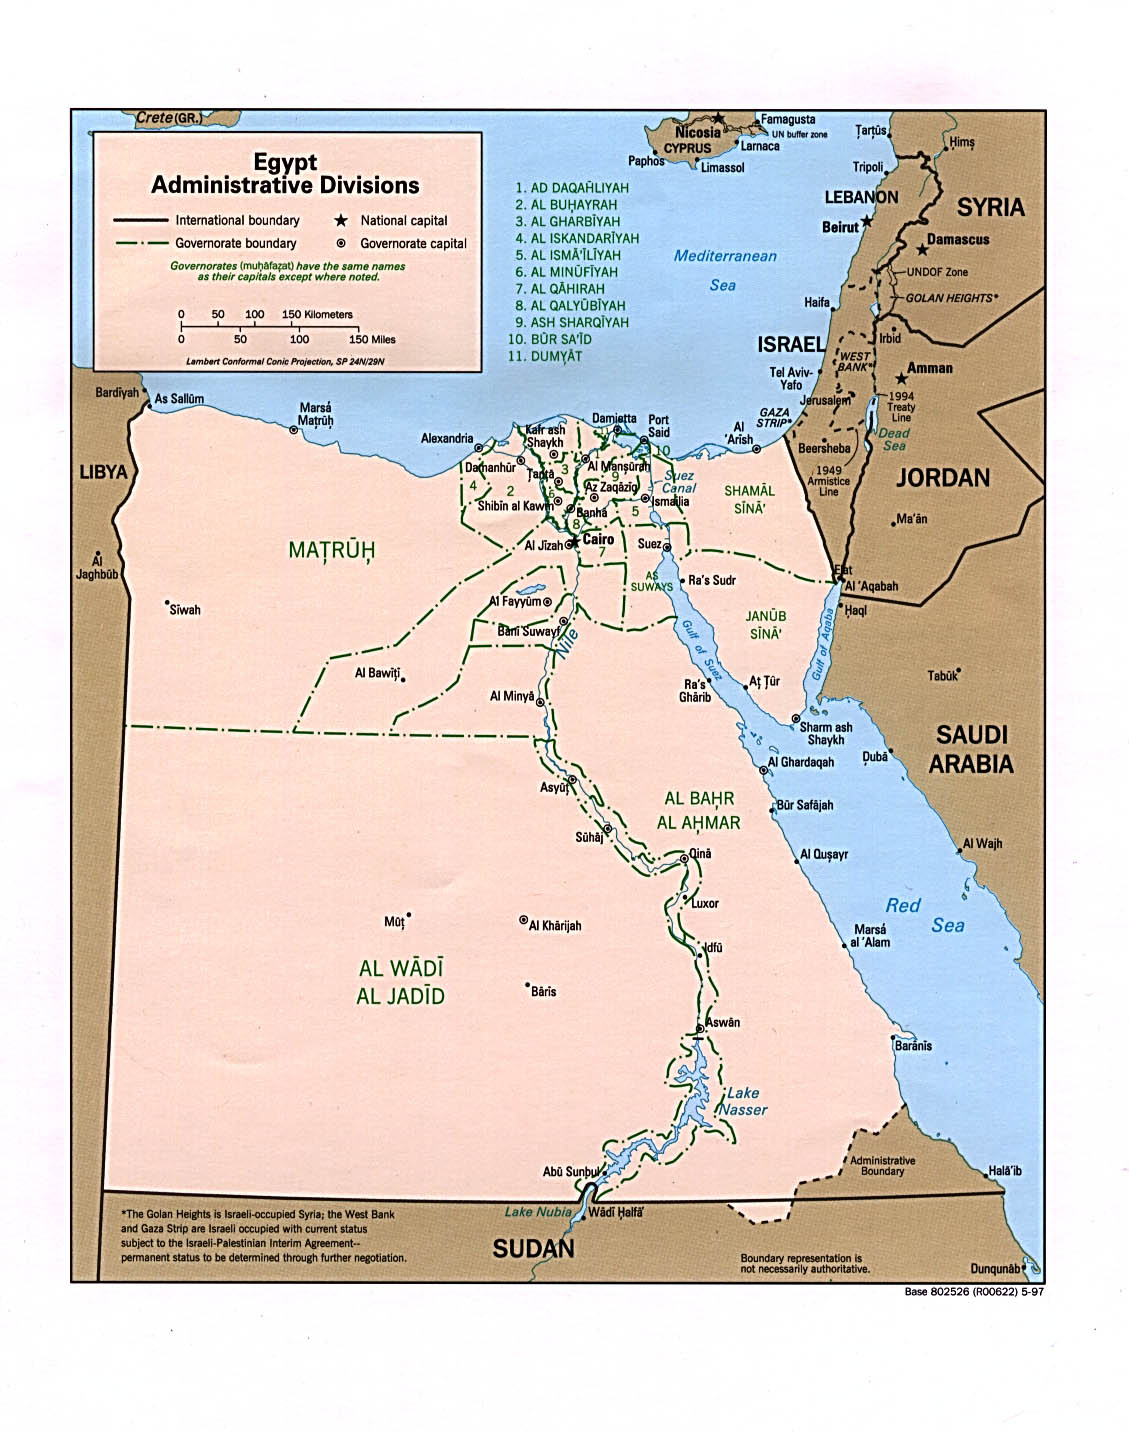
Governorates of Egypt
Politics of Egypt |
|---|
 |
|
|
| Constitution (history) |
| Political parties (former) |
|
For administrative purposes, Egypt is divided into twenty-seven governorates (محافظة muḥāfaẓah; Egyptian Arabic pronunciation: [moˈħɑfzˤɑ]; genitive case: muḥāfaẓat [moˈħɑfzˤet]; plural: محافظات muḥāfaẓāt [moħɑfˈzˤɑːt]).[1] Egyptian governorates are the top tier of the country's jurisdiction hierarchy. A governorate is administered by a governor, who is appointed by the President of Egypt and serves at the president's discretion. Most governorates have a population density of less than one thousand per km2, while the three largest have a population density of less than three per km2.
Overview[]
Governorates are either fully "urban" or a mixture of "urban" and "rural." The official distinction between "urban" and "rural" is reflected in the lower tiers: that is, fully urban governorates have no regions (markaz), as the markaz is, natively, a conglomeration of villages. Moreover, governorates may comprise just one city, as in the case of Cairo Governorate or Alexandria Governorate. Hence, these one-city governorates are only divided into districts (urban neighborhoods). Cairo Governorate consists of 41 districts; Alexandria Governorate consists of 7.
Two new governorates were created in April 2008: Helwan and 6th of October.[2] In April 2011, however, the 6th of October and Helwan governorates were again incorporated into the Giza and Cairo Governorates, respectively.[3] Luxor was created in December 2009, to be the 29th governorate of Egypt, but with the abolition of the 6th of October and Helwan governorates, the number of governorates has decreased to 27.[4]
History[]
Before the 1952 Egyptian revolution, state penetration of the rural areas was limited by the power of local notables. Under Nasser, land reform reduced those notables' socioeconomic dominance, and the peasants were incorporated into cooperatives which transferred mass dependence from landlords to the government. The extension of officials into the countryside permitted the regime to bring development and services to the village. The local branches of the ruling party, the Arab Socialist Union (ASU), fostered a certain peasant political activism and coopted the local notables — in particular the village headmen — and checked their independence from the regime.[5]
State penetration did not retreat under Sadat and Mubarak. The earlier effort to mobilize peasants and deliver services disappeared as the local party and cooperative withered, but administrative controls over the peasants remained intact. The local power of the old families and the headmen revived but more at the expense of peasants than of the state. The district police station balanced the notables, and the system of local government (the mayor and council) integrated them into the regime.[5]
Until 1979, local government enjoyed limited power in Egypt's highly centralized state. Under the central government, there were twenty-six governorates, which were subdivided into regions (conglomeration of villages; named in Arabic: مركز markaz "center", plural: مراكز marākiz), each of which was further subdivided into towns or villages.[5] At each level, there was a governing structure that combined representative councils and government-appointed executive organs headed by governors, district officers, and mayors, respectively. Governors were appointed by the president, and they, in turn, appointed subordinate executive officers. The coercive backbone of the state apparatus ran downward from the Ministry of Interior through the governors' executive organs to the district police station and the village headman.[5]
Sadat took several measures to decentralize power to the provinces and towns. Governors acquired more authority under Law Number 43 of 1979, which reduced the administrative and budgetary controls of the central government over the provinces. The elected councils acquired, at least formally, the right to approve or disapprove the local budget. In an effort to reduce local demands on the central treasury, local government was given wider powers to raise local taxes. Local representative councils became vehicles of pressure for government spending, and the soaring deficits of local government bodies had to be covered by the central government. Local government was encouraged to enter into joint ventures with private investors, and these ventures stimulated an alliance between government officials and the local rich that paralleled the infitah alliance at the national level. Under Mubarak, decentralization and local autonomy became more of a reality, and local policies often reflected special local conditions. Thus, officials in Upper Egypt often bowed to the powerful Islamic movement there, while those in the port cities struck alliances with importers."[5]
List of Governorates of Egypt[]

| Name | Area (km2) | Population (2015) | Population (2019) | Population density (2015) | Capital |
|---|---|---|---|---|---|
| 2,300 | 4,812,186 | 5,299,718 | 2,092 | Alexandria | |
| 62,726 | 1,431,488 | 1,532,400 | 23 | Aswan | |
| 25,926 | 4,245,215 | 4,587,577 | 164 | Asyut | |
| 9,826 | 5,804,262 | 6,404,210 | 591 | Damanhur | |
| 10,954 | 2,856,812 | 3,288,219 | 261 | Beni Suef | |
| 3,085 | 9,278,441 | 9,788,739 | 3,008 | Cairo | |
| 3,538 | 5,949,001 | 6,679,368 | 1,681 | Mansoura | |
| 910 | 1,330,843 | 1,539,075 | 1,462 | Damietta | |
| 6,068 | 3,170,150 | 3,747,942 | 522 | Faiyum | |
| 1,942 | 4,751,865 | 5,146,411 | 2,447 | Tanta | |
| 13,184 | 7,585,115 | 8,915,164 | 575 | Giza | |
| 5,067 | 1,178,641 | 1,352,548 | 233 | Ismailia | |
| 3,467 | 3,172,753 | 3,478,267 | 915 | Kafr El Sheikh | |
| 2,410 | 1,147,058 | 1,296,540 | 476 | Luxor | |
| 166,563 | 447,846 | 461,847 | 2.7 | Marsa Matruh | |
| 32,279 | 5,156,702 | 5,745,212 | 160 | Minya | |
| 2,499 | 3,941,293 | 4,441,717 | 1,577 | Shibin El Kom | |
| 440,098 | 225,416 | 249,399 | 0.5 | Kharga | |
| 28,992 | 434,781 | 463,975 | 15 | Arish | |
| 1,345 | 666,599 | 764,499 | 496 | Port Said | |
| 1,124 | 5,105,972 | 5,792,066 | 4,543 | Banha | |
| 10,798 | 3,045,504 | 3,302,894 | 282 | Qena | |
| 119,099 | 345,775 | 372,862 | 2.9 | Hurghada | |
| 4,911 | 6,485,412 | 7,401,700 | 1,321 | Zagazig | |
| 11,022 | 4,603,861 | 5,193,052 | 418 | Sohag | |
| 31,272 | 167,426 | 105,953 | 5.4 | El Tor | |
| 9,002 | 622,859 | 749,657 | 69 | Suez | |
| Total | 1,010,407 | 87,963,276 | 98,101,011 | ||
Demographics[]
Urban and rural populations[]
Data taken from CAPMAS:[6]
| Governorate | % Urban | Population (2016) | Rural | Urban |
|---|---|---|---|---|
| Alexandria | 98.8 | 4,812,186 | 56,698 | 4,755,488 |
| Aswan | 42.3 | 1,431,488 | 826,543 | 604,945 |
| Asyut | 26.5 | 4,245,215 | 3,119,112 | 1,126,103 |
| Beheira | 19.5 | 5,804,262 | 4,674,346 | 1,129,916 |
| Beni Suef | 23.2 | 2,856,812 | 2,193,871 | 662,941 |
| Cairo | 100.0 | 9,278,441 | 0 | 9,278,441 |
| Dakahlia | 28.2 | 5,949,001 | 4,271,428 | 1,677,573 |
| Damietta | 38.7 | 1,330,843 | 815,244 | 515,599 |
| Faiyum | 22.5 | 3,170,150 | 2,456,368 | 713,782 |
| Gharbia | 30.0 | 4,751,865 | 3,324,630 | 1,427,235 |
| Giza | 58.6 | 7,585,115 | 3,138,310 | 4,446,805 |
| Ismailia | 45.4 | 1,178,641 | 643,778 | 534,863 |
| Kafr El Sheikh | 23.1 | 3,172,753 | 2,441,246 | 731,507 |
| Luxor | 37.8 | 1,147,058 | 713,422 | 433,636 |
| Matruh | 70.6 | 447,846 | 131,841 | 316,005 |
| Minya | 18.9 | 5,156,702 | 4,183,284 | 973,418 |
| Monufia | 20.6 | 3,941,293 | 3,128,460 | 812,833 |
| New Valley | 48.0 | 225,416 | 117,180 | 108,236 |
| North Sinai | 60.2 | 434,781 | 173,095 | 261,686 |
| Port Said | 100.0 | 666,599 | 0 | 666,599 |
| Qalyubia | 44.7 | 5,105,972 | 2,825,045 | 2,280,927 |
| Qena | 19.7 | 3,045,504 | 2,445,051 | 600,453 |
| Red Sea | 95.1 | 345,775 | 17,062 | 328,713 |
| Sharqia | 23.1 | 6,485,412 | 4,987,707 | 1,497,705 |
| Sohag | 21.4 | 4,603,861 | 3,618,543 | 985,318 |
| South Sinai | 51.1 | 167,426 | 81,924 | 85,502 |
| Suez | 100.0 | 622,859 | 0 | 622,859 |
| Total | 42.7 | 87,963,276 | 50,384,188 | 37,579,088 |
Population density[]
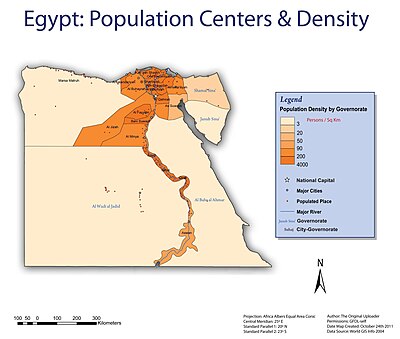
Data taken from CAPMAS:.[6] Information for population is in thousands, pop density - persons/km2 and area is in km2.
| Governorate | Population in thousands (2014-07-01) | Pop. Density (Inhabited Area) | Pop. Density (Total Area) | % Inhabited to Total | Inhabited Area | Total Area |
|---|---|---|---|---|---|---|
| Alexandria | 4,761 | 2,841.5 | 2,070.0 | 72.8 | 1,675.50 | 2,300.00 |
| Aswan | 1,412 | 13,477.1 | 22.5 | 0.2 | 104.77 | 62,726.00 |
| Asyut | 4,181 | 2,656.3 | 161.3 | 6.1 | 1,574.00 | 25,926.00 |
| Beheira | 5,720 | 806.3 | 582.1 | 72.2 | 7,093.84 | 9,826.00 |
| Beni Suef | 2,812 | 2,053.4 | 256.7 | 12.5 | 1,369.41 | 10,954.00 |
| Cairo | 9,184 | 48,235.3 | 2,976.8 | 6.2 | 190.40 | 3,085.12 |
| Dakahlia | 5,881 | 1,662.1 | 1,662.1 | 100.0 | 3,538.23 | 3,538.23 |
| Damietta | 1,316 | 1,968.7 | 1,445.7 | 73.4 | 668.47 | 910.26 |
| Faiyum | 3,118 | 1,680.0 | 513.8 | 30.6 | 1,856.00 | 6,068.00 |
| Gharbia | 4,698 | 2,418.7 | 2,418.7 | 100.0 | 1,942.34 | 1,942.34 |
| Giza | 7,487 | 6,286.3 | 567.9 | 9.0 | 1,191.00 | 13,184.00 |
| Ismailia | 1,162 | 229.3 | 229.3 | 100.0 | 5,066.97 | 5,066.97 |
| Kafr El Sheikh | 3,132 | 903.5 | 903.5 | 100.0 | 3,466.69 | 3,466.69 |
| Luxor | 1,132 | 4,992.7 | 469.8 | 9.4 | 226.73 | 2,409.68 |
| Matruh | 437 | 111.4 | 2.6 | 2.4 | 3,921.40 | 166,563.00 |
| Minya | 5,076 | 2,104.8 | 157.3 | 7.5 | 2,411.65 | 32,279.00 |
| Monufia | 3,890 | 1,596.9 | 1,556.6 | 97.5 | 2,435.93 | 2,499.00 |
| New Valley | 222 | 205.1 | 0.5 | 0.2 | 1,082.24 | 440,098.00 |
| North Sinai | 428 | 203.7 | 14.8 | 7.2 | 2,100.84 | 28,992.00 |
| Port Said | 660 | 499.7 | 490.7 | 98.2 | 1,320.68 | 1,344.96 |
| Qalyubia | 5,044 | 4,702.1 | 4,486.4 | 95.4 | 1,072.72 | 1,124.28 |
| Qena | 3,001 | 1,724.1 | 277.9 | 16.1 | 1,740.63 | 10,798.00 |
| Red Sea | 341 | 4,794.0 | 2.9 | 0.1 | 71.13 | 119,099.13 |
| Sharqia | 6,402 | 1,343.7 | 1,303.6 | 97.0 | 4,764.28 | 4,911.00 |
| Sohag | 4,536 | 2,845.8 | 411.5 | 14.5 | 1,593.92 | 11,022.00 |
| South Sinai | 166 | 9.9 | 5.3 | 53.7 | 16,791.00 | 31,272.00 |
| Suez | 615 | 68.3 | 68.3 | 100.0 | 9,002.21 | 9,002.21 |
| Total | 86,814 | 1109.1 | 85.9 | 7.8 | 78272.98 | 1010407.87 |
See also[]
- List of governorates of Egypt by Human Development Index
- Subdivisions of Egypt
- Regional units of Egypt
- List of Egyptian cities
- List of political and geographic subdivisions by total area
- ISO 3166-2:EG
References[]
- ^ "Governorates of Egypt". Statoids. Retrieved 16 October 2016.
- ^ Reem Leila. "Redrawing the map". Al Ahram Weekly (On-line). Archived from the original on 2009-08-10. Retrieved 2008-05-19.
- ^ "Egypt's PM centralises Helwan and 6 October governorates - Egypt - Ahram Online". english.ahram.org.eg.
- ^ "Luxor announced Egypt's 29th governorate". Archived from the original on February 13, 2010. Retrieved 2009-12-08.
- ^ a b c d e Metz, ed, Helen Chapin (1990). Egypt: A Country Study. Washington: GPO for the Library of Congress. Retrieved 21 October 2016.CS1 maint: extra text: authors list (link)
- ^ a b c "Egypt in Figures 2015" (PDF). CAPMAS. Retrieved 2015-08-01.
- ^ "Egypt in Figures-Census 2019 - 201937112036_2019 سكان.pdf".
External links[]
- Census 2006 area and population data
- Population and area data
- Egypt Administrative Divisions Map, The University of Texas at Austin Library
- Egyptian Government Services Portal, Arabic and English
- History of administrative divisions in Egypt since the French Invasion (in Arabic)
| Urban |
| |
|---|---|---|
| Lower Egypt |
| |
| Upper Egypt |
| |
| Frontier |
| |
| |||||||||||
| |||||||||||
| |||||||||||
| |||||||||||
| |||||||||||
| |||||||||||
- Governorates of Egypt
- Subdivisions of Egypt
- Lists of administrative divisions
- Administrative divisions in Africa
- Administrative divisions in Asia
- First-level administrative divisions by country
- Lists of populated places in Egypt
- Governorates