Climate of Egypt

Egypt essentially has a hot desert climate (Köppen climate classification BWh). The climate is generally extremely dry all over the country except on the northern Mediterranean coast which receives rainfall in winter. In addition to rarity of rain, extreme heat during summer months is also a general climate feature of Egypt although daytime temperatures are more moderated along the northern coast.
Prevailing wind
The prevailing northwesterly wind from the Mediterranean Sea continuously blows over the northern coast without the interposition of an eventual mountain range and thus, greatly moderates temperatures throughout the year. Because of the effect, average low temperatures vary from 9.5 °C (49.1 °F) in wintertime to 23 °C (73.4 °F) in summertime and average high temperatures vary from 17 °C (62.6 °F) in wintertime to 32 °C (89.6 °F) in summertime. Though temperatures are moderated along the coasts, the situation changes in the interior, which are away from the moderating northerly winds. Thus, in the central and the southern parts, nighttime temperatures are very hot, especially in summers where average high temperatures can exceed 40 °C (104 °F) like in Aswan, Luxor, Asyut or Sohag which are located in the deserts of Egypt.
Sand storms
Every year, sometime from March to May, an extremely hot, dry and dusty wind blows from the south or the southwest. This wind is called khamasīn. When the flow of dry air continuously blows over vast desert regions, it picks up fine sand and dust particles and finally results in a dusty wind which is generally felt in the periphery of the desert. When this wind blows over Egypt, it causes high temperatures to soar temporarily at dangerous levels, usually over 45 °C (113 °F), the relative humidity levels to drop under 5%. The khamasīn causes sudden, early heat waves and the absolute highest temperature records in Egypt.
Rainfall
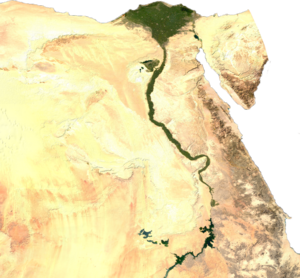
Egypt receives between 20 mm (0.79 in) and 200 mm (7.87 in) of annual average precipitation along the narrow Mediterranean coast, but south to Cairo, the average drops to nearly 0 millimetres (0.00 inches) in the central and the southern part of the country. The cloudiest, rainiest places are in and around Alexandria and Rafah. The sunshine duration is high all over Egypt, ranging from a low of 3,300 hours along the northernmost part in places such as Alexandria to reach a high of over 4,000 hours farther in the interior, in most of the country.
Mountainous areas
Some mountainous locations in Sinai, such as Saint Catherine, have cooler night temperatures, due to their high elevations. It usually snows on the Sinai mountains, but it almost never snows in the cities of Giza, Cairo, and Alexandria. For example, in December 2013, Cairo received a single overnight snowfall for the first time since 1901.
General information
| Climate data for Cairo | |||||||||||||
|---|---|---|---|---|---|---|---|---|---|---|---|---|---|
| Month | Jan | Feb | Mar | Apr | May | Jun | Jul | Aug | Sep | Oct | Nov | Dec | Year |
| Record high °C (°F) | 31 (88) |
34.2 (93.6) |
37.9 (100.2) |
43.2 (109.8) |
47.8 (118.0) |
46.4 (115.5) |
42.6 (108.7) |
43.4 (110.1) |
43.7 (110.7) |
41 (106) |
37.4 (99.3) |
30.2 (86.4) |
47.8 (118.0) |
| Average high °C (°F) | 18.9 (66.0) |
20.4 (68.7) |
23.5 (74.3) |
28.3 (82.9) |
32 (90) |
33.9 (93.0) |
34.7 (94.5) |
34.2 (93.6) |
32.6 (90.7) |
29.2 (84.6) |
24.8 (76.6) |
20.3 (68.5) |
27.7 (81.9) |
| Daily mean °C (°F) | 14.0 (57.2) |
15.1 (59.2) |
17.6 (63.7) |
21.5 (70.7) |
24.9 (76.8) |
27.0 (80.6) |
28.4 (83.1) |
28.2 (82.8) |
26.6 (79.9) |
23.3 (73.9) |
19.5 (67.1) |
15.4 (59.7) |
21.8 (71.2) |
| Average low °C (°F) | 9 (48) |
9.7 (49.5) |
11.6 (52.9) |
14.6 (58.3) |
17.7 (63.9) |
20.1 (68.2) |
22 (72) |
22.1 (71.8) |
20.5 (68.9) |
17.4 (63.3) |
14.1 (57.4) |
10.4 (50.7) |
15.8 (60.4) |
| Record low °C (°F) | 1.2 (34.2) |
3.6 (38.5) |
5 (41) |
7.6 (45.7) |
12.3 (54.1) |
16 (61) |
18.2 (64.8) |
19 (66) |
14.5 (58.1) |
12.3 (54.1) |
5.2 (41.4) |
3 (37) |
1.2 (34.2) |
| Average precipitation mm (inches) | 5 (0.2) |
3.8 (0.15) |
3.8 (0.15) |
1.1 (0.04) |
0.5 (0.02) |
0.1 (0.00) |
0 (0) |
0 (0) |
0 (0) |
0.7 (0.03) |
3.8 (0.15) |
5.9 (0.23) |
24.7 (0.97) |
| Average precipitation days (≥ 0.01 mm) | 3.5 | 2.7 | 1.9 | 0.9 | 0.5 | 0.1 | 0 | 0 | 0 | 0.5 | 1.3 | 2.8 | 14.2 |
| Average relative humidity (%) | 59 | 54 | 53 | 47 | 46 | 49 | 58 | 61 | 60 | 60 | 61 | 61 | 56 |
| Mean monthly sunshine hours | 213 | 234 | 269 | 291 | 324 | 357 | 363 | 351 | 311 | 292 | 248 | 198 | 3,451 |
| Percent possible sunshine | 66 | 75 | 73 | 75 | 77 | 85 | 84 | 86 | 84 | 82 | 78 | 62 | 77 |
| Average ultraviolet index | 4 | 5 | 7 | 9 | 10 | 11.5 | 11.5 | 11 | 9 | 7 | 5 | 3 | 7.8 |
| Source 1: World Meteorological Organization (UN) (1971–2000),[1] NOAA for mean, record high and low and humidity[2] | |||||||||||||
| Source 2: Danish Meteorological Institute for sunshine (1931–1960),[3]
Weather2Travel (ultraviolet)[4] | |||||||||||||
| Alexandria | ||||||||||||||||||||||||||||||||||||||||||||||||||||||||||||
|---|---|---|---|---|---|---|---|---|---|---|---|---|---|---|---|---|---|---|---|---|---|---|---|---|---|---|---|---|---|---|---|---|---|---|---|---|---|---|---|---|---|---|---|---|---|---|---|---|---|---|---|---|---|---|---|---|---|---|---|---|
| Climate chart (explanation) | ||||||||||||||||||||||||||||||||||||||||||||||||||||||||||||
| ||||||||||||||||||||||||||||||||||||||||||||||||||||||||||||
| ||||||||||||||||||||||||||||||||||||||||||||||||||||||||||||
| Luxor | ||||||||||||||||||||||||||||||||||||||||||||||||||||||||||||
|---|---|---|---|---|---|---|---|---|---|---|---|---|---|---|---|---|---|---|---|---|---|---|---|---|---|---|---|---|---|---|---|---|---|---|---|---|---|---|---|---|---|---|---|---|---|---|---|---|---|---|---|---|---|---|---|---|---|---|---|---|
| Climate chart (explanation) | ||||||||||||||||||||||||||||||||||||||||||||||||||||||||||||
| ||||||||||||||||||||||||||||||||||||||||||||||||||||||||||||
| ||||||||||||||||||||||||||||||||||||||||||||||||||||||||||||
| Saint Catherine | ||||||||||||||||||||||||||||||||||||||||||||||||||||||||||||
|---|---|---|---|---|---|---|---|---|---|---|---|---|---|---|---|---|---|---|---|---|---|---|---|---|---|---|---|---|---|---|---|---|---|---|---|---|---|---|---|---|---|---|---|---|---|---|---|---|---|---|---|---|---|---|---|---|---|---|---|---|
| Climate chart (explanation) | ||||||||||||||||||||||||||||||||||||||||||||||||||||||||||||
| ||||||||||||||||||||||||||||||||||||||||||||||||||||||||||||
| ||||||||||||||||||||||||||||||||||||||||||||||||||||||||||||


- Notable climatic features
- [8]
- Rafah and Alexandria are the wettest places
- Asyut is the driest city
- Aswan and Luxor are the cities with the hottest summer days
- Saint Catherine has the coldest nights and coldest winters
- Cities or resorts with coolest summer days
- Mersa Matruh
- Port Said
- Places with least temperature fluctuation
- Port Said
- Kosseir
- Ras El Bar
- Baltim
- Damietta
- Alexandria
- Wettest places
- Rafah
- Alexandria
- Abu Qir
- Rosetta
- Baltim
- Kafr El Dawwar
- Mersa Matruh
- Cities or resorts with warmest winter nights
- Marsa Alam
- El Qoseir
- Sharm El Sheikh
- Cities with most temperature fluctuation between days and nights
- Luxor
- Minya
- Sohag
- Qena
- Asyut
See also
References
- ^ "Weather Information for Cairo". World Meteorological Organization. Retrieved April 14, 2014.
- ^ "Cairo (A) Climate Normals 1961–1990". National Oceanic and Atmospheric Administration. Retrieved April 14, 2014.
- ^ Cappelen, John; Jensen, Jens. "Egypten - Cairo" (PDF). Climate Data for Selected Stations (1931-1960) (in Danish). Danish Meteorological Institute. p. 82. Archived from the original (PDF) on April 27, 2013. Retrieved April 14, 2014.
- ^ "Cairo Climate Guide: Monthly Weather, Egypt". Retrieved 29 June 2019.
- ^ "World Weather Information Service – Alexandria". World Meteorological Organization. Retrieved 10 July 2013.
- ^ "Luxor, Egypt: Climate, Global Warming, and Daylight Charts and Data". Climate Charts. Retrieved 10 July 2013.
- ^ "St. Katrine, Egypt: Climate, Global Warming, and Daylight Charts and Data". Climate Charts. Archived from the original on 7 November 2017. Retrieved 10 July 2013.
- ^ "Egypt Climate Index". Climate Charts. Retrieved 20 June 2013.
| Sovereign states |
|
|---|---|
| States with limited recognition |
|
| Dependencies and other territories |
|
| |
- Climate by country
- Geography of Egypt
- Environment of Egypt