Demographics of Vietnam
| Demographics of Vietnam[1] | |
|---|---|
 Vietnam population pyramid on census day 01/04/2019 | |
| Population | 97,141,003 (10 April 2020) |
| Growth rate | 1.14% (2020 est.) |
| Birth rate | 15.5 births/1000 population (2017 est.) |
| Death rate | 5.9 deaths/1000 population (2017 est.) |
| Life expectancy | 73.7 years (2017 est.) |
| • male | 71.2 years (2017 est.) |
| • female | 76.4 years (2017 est.) |
| Fertility rate | 1.81 births/woman (2017 est.) |
| Infant mortality rate | 17.3 deaths/1000 live births (2017 est.) |
| Age structure | |
| 0–14 years | 23.55% (male 11,909,326/female 10,735,324) (2017 est.) |
| 15–64 years | 70.33% (2017 est.) |
| 65 and over | 6.12% (male 2,281,923/female 3,601,075) (2017 est.) |
| Sex ratio | |
| At birth | 1.122 male(s)/female |
| Under 15 | 1.1 male(s)/female |
| 15–64 years | 1 male (s)/female |
| 65 and over | 0.62 male(s)/female |
| Nationality | |
| Nationality | noun: Vietnamese (singular and plural) adjective: Vietnamese |
| Major ethnic | Kinh (85.32%) |
| Minor ethnic | Tay (1.92%), Thái (1.89%), Muong (1.51%), Hmong (1.45%), Khmer (1.37%), Nung (1.13%), Other (5.41%) |
| Language | |
| Official | Vietnamese language |
| Spoken | Vietnamese and many minority and mountain area languages |
This article is about the demographic features of the population of Vietnam, including population density, ethnicity, education level, health of the populace, economic status, religious affiliations and other aspects of the population.
Originating in northern Vietnam, the Vietnamese people pushed southward over two millennia to occupy the entire eastern seacoast of the Indochinese Peninsula. Ethnic Vietnamese, or Viet (known officially as Kinh), live in the lowlands and speak the Vietnamese language, as opposed to the many ethnic groups of Vietnam who are known to occupy the mountainous regions. The Kinh group does represent much of the cultural and political landscape of Vietnam.
Population[]
UN estimates[2][]
| Total population (000's) | Population aged 0–14 (%) | Population aged 15–64 (%) | Population aged 65+ (%) | |
|---|---|---|---|---|
| 1950 | 28 000 | 31.9 | 63.9 | 4.2 |
| 1955 | 31 329 | 35.6 | 60.1 | 4.3 |
| 1960 | 35 173 | 40.1 | 55.5 | 4.4 |
| 1965 | 39 885 | 44.1 | 51.3 | 4.6 |
| 1970 | 44 928 | 44.2 | 50.9 | 4.8 |
| 1975 | 49 896 | 42.9 | 52.3 | 4.8 |
| 1980 | 54 023 | 40.7 | 54.3 | 4.9 |
| 1985 | 60 307 | 39.4 | 55.7 | 4.9 |
| 1990 | 67 102 | 38.0 | 57.0 | 5.0 |
| 1995 | 74 008 | 36.5 | 58.4 | 5.1 |
| 2000 | 79 910 | 31.6 | 62.0 | 6.4 |
| 2005 | 83 833 | 27.1 | 66.4 | 6.5 |
| 2010 | 87 968 | 23.6 | 69.9 | 6.5 |
| 2015 | 92 677 | 23.0 | 70.3 | 6.7 |
| 2020 | 97 339 | 23.2 | 68.9 | 7.9 |
Population pyramids[3][]
Vital statistics[]
UN estimates of births and deaths[2][]
| Period | Live births per year | Deaths per year | Natural change per year | CBR1 | CDR1 | NC1 | TFR1 | IMR1 |
|---|---|---|---|---|---|---|---|---|
| 1950-1955 | 1 335 000 | 722 000 | 613 000 | 44.8 | 24.2 | 20.6 | 6.20 | 157.9 |
| 1955-1960 | 1 533 000 | 764 000 | 769 000 | 46.1 | 23.0 | 23.1 | 6.76 | 143.7 |
| 1960-1965 | 1 732 000 | 790 000 | 942 000 | 46.2 | 21.0 | 25.2 | 7.33 | 130.3 |
| 1965-1970 | 1 798 000 | 790 000 | 1 009 000 | 42.4 | 18.6 | 23.8 | 7.38 | 117.8 |
| 1970-1975 | 1 853 000 | 859 000 | 994 000 | 39.1 | 18.1 | 21.0 | 7.15 | 118.4 |
| 1975-1980 | 1 797 000 | 760 000 | 1 036 000 | 34.6 | 14.6 | 20.0 | 5.89 | 97.6 |
| 1980-1985 | 1 952 000 | 630 000 | 1 322 000 | 34.1 | 11.0 | 23.1 | 4.93 | 70.0 |
| 1985-1990 | 2 000 000 | 574 000 | 1 425 000 | 31.4 | 9.0 | 22.4 | 3.96 | 54.8 |
| 1990-1995 | 1 929 000 | 484 000 | 1 444 000 | 27.3 | 6.9 | 20.4 | 3.23 | 37.9 |
| 1995-2000 | 1 448 000 | 441 000 | 1 007 000 | 19.0 | 5.8 | 13.2 | 2.18 | 29.2 |
| 2000-2005 | 1 392 000 | 425 000 | 967 000 | 16.9 | 5.5 | 11.4 | 1.92 | 23.1 |
| 2005-2010 | 1 472 000 | 448 000 | 1 024 000 | 17.3 | 5.6 | 11.7 | 1.93 | 20.4 |
| 2010-2015 | 17.4 | 5.8 | 11.6 | 1.96 | ||||
| 2015-2020 | 16.2 | 5.8 | 10.4 | 1.95 | ||||
| 2020-2025 | 15.2 | 6.0 | 9.2 | 1.93 | ||||
| 2025-2030 | 13.4 | 6.3 | 7.1 | 1.92 | ||||
| 2030-2035 | 12.1 | 6.7 | 5.4 | 1.92 | ||||
| 2035-2040 | 11.7 | 7.3 | 4.4 | 1.91 | ||||
| 1 CBR = crude birth rate (per 1000); CDR = crude death rate (per 1000); NC = natural change (per 1000); TFR = total fertility rate (number of children per woman); IMR = infant mortality rate per 1000 births | ||||||||
| Year | Pop. | ±% |
|---|---|---|
| 1950 | 28,264,000 | — |
| 1960 | 35,173,000 | +24.4% |
| 1970 | 44,928,000 | +27.7% |
| 1980 | 54,023,000 | +20.2% |
| 1990 | 67,102,000 | +24.2% |
| 2000 | 78,758,000 | +17.4% |
| 2010 | 87,100,000 | +10.6% |
| 2020 | 98,721,275 | +13.3% |
| Source:https://www.cia.gov/the-world-factbook/countries/vietnam/ | ||
Birth, death and fertility rates[]
The total fertility rate of Vietnam has been influenced by the government's family planning policy, the two-child policy.
| Average population | Live births | Deaths | Natural change | Crude birth rate (per 1000) | Crude death rate (per 1000) | Natural change (per 1000) | Total fertility rate (children per woman) | |
|---|---|---|---|---|---|---|---|---|
| 2001 | 78,620,500 | 18.6 | 5.1 | 13.5 | 2.25 | |||
| 2002 | 79,537,700 | 19.0 | 5.8 | 13.2 | 2.28 | |||
| 2003 | 80,467,400 | 17.5 | 5.8 | 11.7 | 2.12 | |||
| 2004 | 81,436,400 | 19.2 | 5.4 | 13.8 | 2.23 | |||
| 2005 | 82,392,100 | 18.6 | 5.3 | 13.3 | 2.11 | |||
| 2006 | 83,311,200 | 17.4 | 5.3 | 12.1 | 2.09 | |||
| 2007 | 84,218,500 | 16.9 | 5.3 | 11.6 | 2.07 | |||
| 2008 | 85,118,700 | 16.7 | 5.3 | 11.4 | 2.08 | |||
| 2009 | 86,025,000 | 17.6 | 6.8 | 10.8 | 2.03 | |||
| 2010 | 86,932,500 | 1,486,000 | 590,900 | 895,000 | 17.1 | 6.8 | 10.3 | 2.00 |
| 2011 | 87,840,000 | 1,443,000 | 599,800 | 843,200 | 16.6 | 6.9 | 9.7 | 1.99 |
| 2012 | 88,772,900 | 1,484,500 | 621,400 | 863,100 | 16.9 | 7.0 | 9.9 | 2.05 |
| 2013 | 89,759,500 | 1,513,500 | 621,400 | 892,100 | 17.0 | 7.1 | 9.9 | 2.10 |
| 2014 | 90,728,900 | 1,525,900 | 619,300 | 906,600 | 17.2 | 6.9 | 10.3 | 2.09 |
| 2015 | 91,709,800 | 1,485,000 | 623,600 | 861,400 | 16.2 | 6.8 | 9.4 | 2.10 |
| 2016 | 92,695,100 | 1,483,100 | 630,300 | 852,700 | 16.0 | 6.8 | 9.2 | 2.09 |
| 2017 | 93,677,600 | 1,377,000 | 637,000 | 740,000 | 14.7 | 6.8 | 7.9 | 2.04 |
| 2018 | 94,670,000 | 1,382,100 | 643,700 | 738,000 | 14.6 | 6.8 | 7.8 | 2.05 |
| 2019 | 96,480,000 | 1,572,600 | 607,800 | 964,800 | 16.3 | 6.3 | 10.0 | 2.09 |
| 2020 | 97,582,700 | 1,589,000 | 594,000 | 994,500 | 16.3 | 6.1 | 10.2 | 2.12 |
- preliminary
Source: General Statistics Office of Vietnam.[4][5]
Fertility rate by region and province[]
| hideProvince | 2005 | 2007 | 2008 | 2009 | 2010 | 2011 | 2012 | 2013 | 2014 | 2015 | 2016 | 2017 | 2018 | 2019 |
|---|---|---|---|---|---|---|---|---|---|---|---|---|---|---|
| Vietnam | 2,11 | 2,07 | 2,08 | 2,03 | 2,00 | 1,99 | 2,05 | 2,10 | 2,09 | 2,10 | 2,09 | 2,04 | 2,05 | 2,09 |
| Red River Delta | 2,06 | 2,11 | 2,13 | 2,11 | 2,04 | 2,06 | 2,11 | 2,11 | 2,30 | 2,23 | 2,23 | 2,16 | 2,29 | 2,35 |
| Hà Nội | 1,83 | 1,91 | 2,06 | 2,08 | 2,00 | 2,02 | 2,06 | 2,03 | 2,18 | 2,04 | 2,06 | 2,00 | 2,07 | 2,24 |
| Hà Tây | 2,29 | 2,23 | .. | .. | .. | .. | .. | .. | .. | .. | .. | .. | .. | .. |
| Vĩnh Phúc | 2,15 | 2,00 | 2,10 | 2,13 | 2,06 | 2,02 | 2,07 | 2,11 | 2,44 | 2,25 | 2,48 | 2,34 | 2,48 | 2,39 |
| Bắc Ninh | 2,40 | 2,28 | 2,29 | 2,32 | 2,26 | 2,23 | 2,71 | 2,29 | 2,72 | 2,72 | 2,63 | 2,67 | 2,66 | 2,53 |
| Quảng Ninh | 2,24 | 2,12 | 2,12 | 2,20 | 1,99 | 2,07 | 2,27 | 2,18 | 2,49 | 2,20 | 2,02 | 2,25 | 2,22 | 2,24 |
| Hải Dương | 2,10 | 2,04 | 2,13 | 1,99 | 1,98 | 2,01 | 2,07 | 1,99 | 2,06 | 2,00 | 2,30 | 1,95 | 2,59 | 2,48 |
| Hải Phòng | 2,13 | 1,86 | 1,95 | 2,16 | 1,98 | 2,00 | 2,37 | 2,03 | 2,35 | 2,02 | 2,11 | 1,99 | 1,92 | 2,20 |
| Hưng Yên | 2,32 | 2,08 | 2,25 | 2,11 | 2,13 | 2,19 | 2,10 | 2,46 | 2,29 | 2,40 | 2,37 | 2,10 | 2,39 | 2,40 |
| Thái Bình | 2,19 | 2,21 | 2,14 | 2,08 | 2,10 | 2,15 | 1,78 | 2,07 | 1,87 | 2,39 | 2,25 | 2,21 | 2,51 | 2,43 |
| Hà Nam | 2,30 | 2,18 | 2,12 | 2,07 | 2,09 | 2,16 | 1,83 | 1,87 | 1,99 | 2,22 | 2,11 | 1,97 | 2,39 | 2,44 |
| Nam Định | 2,31 | 2,39 | 2,19 | 2,25 | 2,20 | 2,24 | 1,76 | 2,32 | 2,73 | 2,81 | 2,46 | 2,58 | 2,82 | 2,74 |
| Ninh Bình | 2,37 | 2,26 | 2,36 | 2,04 | 1,88 | 1,86 | 2,66 | 2,28 | 2,87 | 2,76 | 2,94 | 2,39 | 2,53 | 2,46 |
| Northern midlands and mountain areas | 2,33 | 2,23 | 2,30 | 2,24 | 2,22 | 2,21 | 2,31 | 2,18 | 2,56 | 2,69 | 2,63 | 2,53 | 2,48 | 2,43 |
| Hà Giang | 3,06 | 2,89 | 2,86 | 3,08 | 3,05 | 2,57 | 2,78 | 2,70 | 2,51 | 2,93 | 2,42 | 2,49 | 2,74 | 2,47 |
| Cao Bằng | 2,55 | 2,28 | 2,26 | 2,18 | 2,09 | 2,15 | 2,13 | 2,05 | 2,53 | 2,52 | 2,46 | 2,34 | 2,48 | 2,43 |
| Bắc Kạn | 2,29 | 2,12 | 2,07 | 1,84 | 1,85 | 1,91 | 2,30 | 2,11 | 2,07 | 2,42 | 2,40 | 2,37 | 2,23 | 2,14 |
| Tuyên Quang | 2,17 | 2,05 | 2,05 | 2,10 | 2,07 | 2,10 | 2,18 | 2,35 | 2,73 | 2,74 | 2,72 | 2,68 | 2,62 | 2,51 |
| Lào Cai | 2,97 | 2,59 | 2,69 | 2,70 | 2,73 | 2,57 | 2,43 | 2,52 | 2,36 | 2,26 | 2,73 | 2,24 | 2,43 | 2,44 |
| Yên Bái | 2,55 | 2,36 | 2,56 | 2,38 | 2,32 | 2,26 | 2,38 | 2,13 | 2,77 | 2,76 | 2,89 | 2,77 | 2,96 | 2,74 |
| Thái Nguyên | 1,99 | 1,99 | 1,95 | 1,89 | 1,90 | 1,96 | 2,13 | 2,06 | 2,45 | 2,52 | 2,45 | 2,09 | 2,05 | 2,14 |
| Lạng Sơn | 2,28 | 2,14 | 2,15 | 1,86 | 1,84 | 1,88 | 2,11 | 1,86 | 2,26 | 2,38 | 2,34 | 2,25 | 2,22 | 2,13 |
| Bắc Giang | 2,21 | 2,07 | 2,22 | 1,94 | 1,86 | 1,94 | 2,09 | 1,77 | 2,57 | 2,77 | 2,64 | 2,73 | 2,38 | 2,31 |
| Phú Thọ | 2,03 | 1,99 | 2,11 | 2,10 | 2,08 | 2,22 | 2,18 | 2,22 | 2,51 | 2,61 | 2,56 | 2,51 | 2,66 | 2,57 |
| Điện Biên | 3,17 | 2,72 | 2,72 | 2,55 | 2,57 | 2,67 | 2,76 | 2,48 | 3,11 | 2,81 | 2,43 | 2,84 | 2,78 | 2,72 |
| Lai Châu | 3,52 | 3,02 | 3,01 | 2,96 | 2,91 | 2,93 | 2,60 | 2,45 | 3,20 | 3,11 | 2,91 | 2,86 | 2,60 | 2,68 |
| Sơn La | 2,76 | 2,36 | 2,29 | 2,61 | 2,58 | 2,43 | 2,52 | 2,25 | 2,57 | 2,82 | 2,90 | 2,77 | 2,36 | 2,44 |
| Hòa Bình | 2,09 | 2,06 | 2,01 | 1,98 | 1,98 | 2,03 | 2,08 | 1,90 | 2,30 | 2,84 | 2,56 | 2,30 | 2,42 | 2,34 |
| North Central and Central coastal areas | 2,37 | 2,27 | 2,30 | 2,21 | 2,21 | 2,21 | 2,32 | 2,37 | 2,31 | 2,34 | 2,37 | 2,31 | 2,30 | 2,32 |
| Thanh Hóa | 2,39 | 2,12 | 2,17 | 1,89 | 1,89 | 2,01 | 2,22 | 2,11 | 2,43 | 2,75 | 2,70 | 2,45 | 2,69 | 2,54 |
| Nghệ An | 2,75 | 2,49 | 2,52 | 2,55 | 2,56 | 2,49 | 2,59 | 2,68 | 2,70 | 2,69 | 2,76 | 2,87 | 2,82 | 2,75 |
| Hà Tĩnh | 2,38 | 2,46 | 2,65 | 2,46 | 2,46 | 2,50 | 2,75 | 2,95 | 3,12 | 2,65 | 3,21 | 3,24 | 2,90 | 2,83 |
| Quảng Bình | 2,58 | 2,57 | 2,57 | 2,37 | 2,39 | 2,41 | 2,61 | 2,22 | 2,49 | 2,52 | 2,38 | 2,34 | 2,41 | 2,43 |
| Quảng Trị | 2,90 | 2,77 | 2,71 | 2,85 | 2,84 | 2,67 | 2,65 | 2,75 | 2,75 | 2,94 | 3,19 | 2,83 | 2,61 | 2,45 |
| Thừa Thiên - Huế | 2,98 | 2,79 | 2,54 | 2,26 | 2,28 | 2,22 | 2,38 | 2,21 | 2,33 | 2,26 | 2,20 | 2,33 | 2,03 | 2,34 |
| Đà Nẵng | 1,87 | 1,90 | 1,92 | 2,14 | 2,16 | 1,99 | 2,18 | 2,32 | 2,03 | 2,13 | 2,24 | 1,81 | 1,49 | 1,88 |
| Quảng Nam | 2,40 | 2,32 | 2,12 | 2,30 | 2,27 | 2,16 | 2,35 | 2,65 | 2,27 | 2,17 | 2,16 | 2,26 | 2,28 | 2,27 |
| Quảng Ngãi | 2,21 | 2,11 | 2,18 | 2,09 | 2,11 | 2,21 | 2,13 | 2,45 | 2,01 | 1,93 | 1,98 | 1,79 | 2,06 | 2,13 |
| Bình Định | 2,25 | 2,17 | 2,09 | 2,22 | 2,17 | 2,28 | 2,26 | 2,55 | 2,29 | 2,14 | 2,00 | 2,09 | 2,30 | 2,20 |
| Phú Yên | 2,25 | 2,18 | 2,32 | 1,96 | 1,98 | 2,11 | 2,07 | 2,04 | 2,15 | 2,05 | 2,26 | 2,04 | 2,16 | 2,11 |
| Khánh Hòa | 2,12 | 2,14 | 2,18 | 2,04 | 2,06 | 1,93 | 2,04 | 2,04 | 1,65 | 1,75 | 1,75 | 1,64 | 1,40 | 1,77 |
| Ninh Thuận | 2,53 | 2,28 | 2,24 | 2,40 | 2,42 | 2,38 | 2,25 | 2,37 | 2,18 | 2,23 | 2,28 | 2,34 | 2,05 | 2,09 |
| Bình Thuận | 2,38 | 2,40 | 2,38 | 2,07 | 2,09 | 2,14 | 2,39 | 2,15 | 1,57 | 2,04 | 1,81 | 1,75 | 1,82 | 1,91 |
| Central Highlands | 3,07 | 2,77 | 2,68 | 2,65 | 2,63 | 2,58 | 2,43 | 2,49 | 2,30 | 2,26 | 2,37 | 2,29 | 2,32 | 2,43 |
| Kon Tum | 3,94 | 3,49 | 3,58 | 3,45 | 3,46 | 3,25 | 3,16 | 2,70 | 3,04 | 2,49 | 2,34 | 2,48 | 2,12 | 2,74 |
| Gia Lai | 3,10 | 2,97 | 2,86 | 2,88 | 2,90 | 2,85 | 2,36 | 2,48 | 2,27 | 2,45 | 2,38 | 2,36 | 2,27 | 2,49 |
| Đắk Lắk | 2,98 | 2,84 | 2,57 | 2,45 | 2,47 | 2,42 | 2,31 | 2,70 | 2,25 | 2,22 | 2,43 | 2,19 | 2,41 | 2,37 |
| Đắk Nông | 3,38 | 3,05 | 2,87 | 2,72 | 2,68 | 2,57 | 2,65 | 2,31 | 2,46 | 2,36 | 2,28 | 2,21 | 3,05 | 2,68 |
| Lâm Đồng | 2,67 | 2,37 | 2,31 | 2,43 | 2,28 | 2,32 | 2,36 | 2,24 | 2,09 | 1,98 | 2,34 | 2,29 | 1,99 | 2,20 |
| South East | 1,85 | 1,74 | 1,73 | 1,69 | 1,68 | 1,59 | 1,57 | 1,83 | 1,56 | 1,63 | 1,46 | 1,55 | 1,50 | 1,56 |
| Bình Phước | 2,61 | 2,47 | 2,38 | 2,45 | 2,43 | 2,31 | 2,22 | 2,43 | 2,30 | 2,05 | 1,92 | 2,02 | 1,99 | 2,27 |
| Tây Ninh | 1,98 | 1,89 | 1,79 | 1,79 | 1,77 | 1,80 | 1,93 | 1,78 | 1,76 | 1,88 | 1,76 | 1,66 | 1,46 | 1,53 |
| Bình Dương | 1,66 | 1,74 | 1,85 | 1,70 | 1,72 | 1,76 | 1,70 | 1,78 | 1,44 | 1,59 | 1,61 | 1,90 | 1,53 | 1,54 |
| Đồng Nai | 1,92 | 1,91 | 1,83 | 2,07 | 2,09 | 1,99 | 1,80 | 2,09 | 1,75 | 2,02 | 1,67 | 1,61 | 1,80 | 1,90 |
| Bà Rịa - Vũng Tàu | 2,06 | 2,09 | 2,13 | 2,01 | 1,88 | 1,82 | 1,70 | 1,92 | 1,97 | 1,56 | 1,52 | 1,37 | 1,51 | 1,87 |
| TP. Hồ Chí Minh | 1,52 | 1,49 | 1,63 | 1,45 | 1,45 | 1,30 | 1,33 | 1,68 | 1,39 | 1,45 | 1,24 | 1,36 | 1,33 | 1,39 |
| Mekong River Delta | 2,00 | 1,87 | 1,87 | 1,84 | 1,80 | 1,80 | 1,92 | 1,92 | 1,84 | 1,76 | 1,84 | 1,74 | 1,74 | 1,80 |
| Long An | 1,95 | 1,91 | 1,95 | 1,85 | 1,87 | 1,83 | 2,02 | 2,03 | 1,66 | 1,61 | 1,56 | 1,62 | 1,83 | 1,80 |
| Tiền Giang | 2,02 | 1,98 | 1,97 | 1,94 | 1,93 | 1,92 | 1,79 | 1,78 | 1,75 | 1,62 | 2,00 | 1,99 | 1,68 | 1,82 |
| Bến Tre | 1,76 | 1,70 | 1,71 | 1,81 | 1,79 | 1,71 | 2,20 | 1,98 | 1,89 | 1,97 | 1,90 | 1,88 | 1,88 | 1,86 |
| Trà Vinh | 2,03 | 1,89 | 1,79 | 1,86 | 1,80 | 1,80 | 2,06 | 1,89 | 1,94 | 2,04 | 2,36 | 2,25 | 1,94 | 1,96 |
| Vĩnh Long | 1,83 | 1,76 | 1,75 | 1,63 | 1,65 | 1,63 | 2,14 | 2,02 | 1,98 | 1,61 | 2,03 | 1,67 | 1,83 | 1,81 |
| Đồng Tháp | 1,98 | 1,77 | 1,74 | 1,87 | 1,89 | 1,83 | 1,57 | 1,89 | 1,84 | 1,61 | 1,59 | 1,34 | 1,43 | 1,78 |
| An Giang | 2,00 | 1,86 | 1,86 | 1,97 | 1,97 | 1,92 | 2,17 | 2,07 | 2,10 | 1,73 | 1,84 | 1,77 | 1,78 | 1,85 |
| Kiên Giang | 2,22 | 2,10 | 2,09 | 1,84 | 1,80 | 1,86 | 2,16 | 1,98 | 1,96 | 2,05 | 1,94 | 1,87 | 1,96 | 1,85 |
| Cần Thơ | 1,70 | 1,64 | 1,75 | 1,72 | 1,62 | 1,62 | 1,58 | 1,81 | 1,89 | 1,88 | 2,01 | 1,64 | 1,66 | 1,66 |
| Hậu Giang | 1,95 | 1,94 | 1,89 | 1,96 | 1,75 | 1,77 | 1,78 | 1,78 | 1,61 | 1,64 | 1,48 | 1,53 | 1,64 | 1,83 |
| Sóc Trăng | 2,02 | 1,90 | 2,06 | 1,79 | 1,81 | 1,83 | 1,85 | 2,08 | 1,65 | 1,72 | 1,83 | 1,69 | 1,75 | 1,79 |
| Bạc Liêu | 2,11 | 2,10 | 2,00 | 1,75 | 1,59 | 1,69 | 1,97 | 1,82 | 1,82 | 1,67 | 1,63 | 1,77 | 1,54 | 1,61 |
| Cà Mau | 2,10 | 2,00 | 2,01 | 1,75 | 1,64 | 1,73 | 1,62 | 1,70 | 1,65 | 1,80 | 1,85 | 1,65 | 1,75 | 1,80 |
Source: General Statistics Office of Vietnam.[6]
Ethnic groups[]
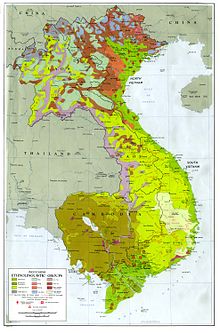
The Vietnamese government recognizes 54 ethnic groups, of which the Viet (Kinh) is the largest; according to official Vietnamese figures (2019 census), ethnic Vietnamese account for 85.32% of the nation's population and the non-Vietnamese ethnic groups account for the remaining percent. The ethnic Vietnamese inhabit a little less than half of Vietnam, while the ethnic minorities inhabit the majority of Vietnam's land (albeit the least fertile parts of the country).
The Khmer Krom are found in the delta of the Mekong River, in the south of Vietnam, where they form in many areas the majority of the rural population. They live in an area which was previously part of Cambodia and which Vietnam conquered in the 17th and 18th centuries. Official Vietnamese figures put the Khmer Krom at 1 million people. Vietnam's approximately 1 million ethnic Chinese, constitute one of Vietnam's largest minority groups. Long important in the Vietnamese economy, Vietnamese of Chinese ancestry have been active in rice trading, milling, real estate, and banking in the south and shopkeeping, stevedoring, and mining in the north.
The relation between China and Vietnam also declined following reunification in 1975, with Vietnam siding with the Soviet Union against China in the Chinese-Soviet split. Tensions peaked when Vietnam and Cambodia started a war, Cambodia lead by Pol Pot being a Chinese ally, resulting in a Chinese invasion of Vietnam in 1979. In 1978-79, some 450,000 ethnic Chinese left Vietnam by boat as refugees (many officially encouraged and assisted) or were expelled across the land border with China. In recent years the government has performed an about turn and is encouraging overseas Hoa to return and invest, but the ethnic Chinese population has been in continuous decline since the 1970s due to assimilation and low birth rates.
The central highland peoples commonly termed Degar or Montagnards (mountain people) comprise two main ethnolinguistic groups--Malayo-Polynesian and Mon–Khmer. About 30 groups of various cultures and dialects are spread over the highland territory.
Other minority groups include the Cham—remnants of the once-mighty Champa Kingdom, conquered by the Vietnamese in the 15th century, Hmong, and Thái.
| Ethnic group |
Language family |
census 1989[7] | census 1999[8] | census 2009[9] | census 2019[10] | ||||
|---|---|---|---|---|---|---|---|---|---|
| Number | % | Number | % | Number | % | Number | % | ||
| Kinh | Vietic | 56,101,583 | 87.1 | 65,795,748 | 86.2 | 73,594,427 | 85.7 | 82,085,826 | 85.32 |
| Tày | Tai-Kadai | 1,145,235 | 1.8 | 1,477,514 | 1.9 | 1,626,392 | 1.9 | 1,845,492 | 1.92 |
| Thai | Tai-Kadai | 992,809 | 1.5 | 1,328,725 | 1.7 | 1,550,423 | 1.8 | 1,820,950 | 1.89 |
| Mường | Vietic | 874,195 | 1.4 | 1,137,515 | 1.5 | 1,268,963 | 1.5 | 1,452,095 | 1.51 |
| Mong | Hmong-Dao | 787,604 | 1.0 | 1,068,189 | 1.2 | 1,393,547 | 1.45 | ||
| Khmer | Mon-Khmer | 872,382 | 1.4 | 1,055,174 | 1.4 | 1,260,640 | 1.5 | 1,319,652 | 1.37 |
| Nùng | Tai-Kadai | 696,305 | 1.1 | 856,412 | 1.1 | 968,800 | 1.1 | 1,083,298 | 1.13 |
| Dao | Hmong-Dao | 620,538 | 0.81 | 751,067 | 0.87 | 891,151 | 0.93 | ||
| Hoa | Chinese | 961,702 | 1.5 | 862,371 | 1.1 | 823,071 | 1.0 | 749,466 | 0.78 |
| Gia Rai | Malayo-Polynesian | 317,557 | 0.42 | 411,275 | 0.48 | 513,930 | 0.53 | ||
| Ê Đê | Malayo-Polynesian | 270,348 | 0.35 | 331,194 | 0.39 | 398,671 | 0.41 | ||
| Ba Na | Mon-Khmer | 174,456 | 0.23 | 227,716 | 0.27 | 286,910 | 0.30 | ||
| Xơ Đăng | Mon-Khmer | 127,148 | 0.17 | 169,501 | 0.20 | 212,277 | 0.22 | ||
| Sán Chay | Tai-Kadai | 147,315 | 0.19 | 169,410 | 0.20 | 201,398 | 0.21 | ||
| Cờ Ho | Mon-Khmer | 128,723 | 0.17 | 166,112 | 0.19 | 200,800 | 0.21 | ||
| Sán Dìu | Chinese | 126,237 | 0.17 | 146,821 | 0.17 | 183,004 | 0.19 | ||
| Chăm | Malayo-Polynesian | 132,873 | 0.17 | 161,729 | 0.19 | 178,948 | 0.19 | ||
| Hrê | Mon-Khmer | 113,111 | 0.15 | 63,012 | 0.07 | 149,460 | 0.16 | ||
| Ra Glai | Malayo-Polynesian | 96,931 | 0.13 | 122,245 | 0.14 | 146,613 | 0.15 | ||
| M'Nông | Mon-Khmer | 92,451 | 0.12 | 102,741 | 0.12 | 127,334 | 0.13 | ||
| Xtiêng | Mon-Khmer | 66,788 | 0.09 | 85,436 | 0.10 | 100,752 | 0.10 | ||
| Bru-Vân Kiều | Mon-Khmer | 55,559 | 0.07 | 74,506 | 0.09 | 94,598 | 0.10 | ||
| Thổ | Vietic | 68,394 | 0.09 | 74,458 | 0.09 | 91,430 | 0.10 | ||
| Khơ Mú | Mon-Khmer | 56,542 | 0.07 | 72,929 | 0.08 | 90,612 | 0.09 | ||
| Cơ Tu | Mon-Khmer | 50,458 | 0.07 | 61,588 | 0.07 | 74,173 | 0.08 | ||
| Giáy | Tai-Kadai | 49,098 | 0.06 | 58,617 | 0.07 | 67,858 | 0.07 | ||
| Giẻ Triêng | Mon-Khmer | 30,243 | 0.04 | 50,962 | 0.06 | 63,322 | 0.07 | ||
| Tà Ôi | Mon-Khmer | 34,960 | 0.05 | 43,886 | 0.05 | 52,356 | 0.05 | ||
| Mạ | Mon-Khmer | 33,338 | 0.04 | 41,405 | 0.05 | 50,322 | 0.05 | ||
| Co | Mon-Khmer | 27,766 | 0.04 | 33,817 | 0.04 | 40,442 | 0.04 | ||
| Chơ Ro | Mon-Khmer | 22,567 | 0.03 | 26,855 | 0.03 | 29,520 | 0.03 | ||
| Xinh Mun | Mon-Khmer | 18,018 | 0.02 | 23,278 | 0.03 | 29,503 | 0.03 | ||
| Hà Nhì | Tibeto-Burman | 17,535 | 0.02 | 10,923 | 0.01 | 25,539 | 0.03 | ||
| Chu Ru | Malayo-Polynesian | 14,978 | 0.02 | 19,314 | 0.02 | 23,242 | 0.02 | ||
| Lao | Tai-Kadai | 11,611 | 0.02 | 14,928 | 0.02 | 17,532 | 0.02 | ||
| Kháng | Mon-Khmer | 10,272 | 0.01 | 13,840 | 0.02 | 16,180 | 0.02 | ||
| La Chí | Tai-Kadai | 10,765 | 0.01 | 13,158 | 0.02 | 15,126 | 0.02 | ||
| Phù Lá | Tibeto-Burman | 9,046 | 0.01 | 5,535 | 0.01 | 12,471 | 0.01 | ||
| La Hủ | Tibeto-Burman | 6,874 | 0.01 | 9,651 | 0.01 | 12,113 | 0.01 | ||
| La Ha | Tai-Kadai | 5,686 | 0.01 | 8,177 | 0.01 | 10,157 | 0.01 | ||
| Pà Thẻn | Hmong-Dao | 5,569 | 0.01 | 6,811 | 0.01 | 8,248 | 0.01 | ||
| Chứt | Vietic | 3,829 | 0.01 | 6,022 | 0.01 | 7,513 | 0.01 | ||
| Lự | Tai-Kadai | 4,964 | 0.01 | 5,601 | 0.01 | 6,757 | 0.01 | ||
| Lô Lô | Tibeto-Burman | 3,307 | 0.00 | 2,218 | 0.00 | 4,827 | 0.01 | ||
| Mảng | Mon-Khmer | 2,663 | 0.00 | 3,700 | 0.00 | 4,650 | 0.00 | ||
| Cờ Lao | Tai-Kadai | 1,865 | 0.00 | 2,636 | 0.00 | 4,003 | 0.00 | ||
| Bố Y | Tai-Kadai | 1,864 | 0.00 | 2,273 | 0.00 | 3,232 | 0.00 | ||
| Cống | Tibeto-Burman | 1,676 | 0.00 | 2,029 | 0.00 | 2,729 | 0.00 | ||
| Ngái | Chinese | 4,841 | 0.01 | 1,035 | 0.00 | 1,649 | 0.00 | ||
| Si La | Tibeto-Burman | 840 | 0.00 | 709 | 0.00 | 909 | 0.00 | ||
| Pu Péo | Tai-Kadai | 705 | 0.00 | 687 | 0.00 | 903 | 0.00 | ||
| Rơ Măm | Mon-Khmer | 352 | 0.00 | 436 | 0.00 | 639 | 0.00 | ||
| Brâu | Mon-Khmer | 313 | 0.00 | 397 | 0.00 | 525 | 0.00 | ||
| Ơ Đu | Mon-Khmer | 301 | 0.00 | 376 | 0.00 | 428 | 0.00 | ||
| Foreigners | 39,532 | 0.05 | 2,134 | 0.00 | 3,553 | 0.00 | |||
| Others | 2,767,512 | 4.3 | 1,333 | 0.0 | 82,942 | 0.0 | 349 | 0.00 | |
| Total | 64,411,713 | 76,323,173 | 85,846,997 | 96,208,984 | |||||
Language[]
Vietnamese is the official language of the country. It belongs to the Austroasiatic language family, which also includes languages such as Khmer and Mon. Vietnamese was spoken by 85-90 million people in Vietnam at the 1999 census. In the early 21st century, around another four million Vietnamese speakers are found outside of Vietnam, mostly refugees from the Vietnam-American War. Thus Vietnamese is the most spoken language of the Austroasiatic family, being spoken by three times more people than the second most spoken language of the family, Khmer. Both languages, however, are extremely different: Vietnamese is a tonal, monosyllabic, phonetic language while Khmer has remained non-tonal. Vietnamese was heavily influenced by Chinese, with up to around 50-70% words having Chinese origins, whilst Khmer was heavily influenced by Sanskrit and Pali, uses a abugida writing system, and has a great part of its vocabulary originating from Indian languages. Since the early 20th century, the Vietnamese have used a Romanized script introduced by the French, developed by Jesuit missionaries led by Alexandre de Rhodes and later on, refined by Vietnamese scholars to produce what is now known the Vietnamese language and the Vietnamese alphabet.
Religions[]
Religion in Vietnam (2019)[10]
According to the 2019 Census, the religious demographics of Vietnam are as follows:[10]
- 86.32% Vietnamese folk religion or non religious
- 6.1% Catholicism
- 4.79% Buddhism (mainly Mahayana)
- 1.02% Hoahaoism
- 1% Protestantism
- <1% Caodaism
- 0.77 Others
It is worth noting here that the data is highly skewered, as a large majority of Vietnamese may declare themselves atheist yet practice forms of traditional folk religion or Mahayana Buddhism.[11]
Estimates for the year 2010 published by the Pew Research Center:[12]
- Vietnamese folk religion, 45.3%
- Unaffiliated, 29.6%
- Buddhism, 16.4%
- Christianity, 8.2%
- Other, 0.5%
CIA World Factbook demographic statistics[]

The following demographic statistics are from the CIA World Factbook, unless otherwise indicated.
Sex ratio[]
- at birth: 1.07 male(s)/female
- under 15 years: 1.08 male(s)/female
- 15–64 years: 0.98 male(s)/female
- 65 years and over: 0.63 male(s)/female
- total population: 0.98 male(s)/female
(2008 est.)
Source: Statistica etc.[13][14]
{ |69.8 |- |1955–1960 |57.3 |1990–1995 |71.2 |- |1960–1965 |60.5 |1995–2000 |72.7 |- |1965–1970 |62.3 |2000–2005 |73.8 |- |1970–1975 |57.8 |2005–2010 |74.7 |- |1975–1980 |66.1 |2010–2015 |75.6 |- |1980–1985 |68.1 | | |} Source: UN World Population Prospects[15]
Literacy[]
- definition: age 15 and over can read and write
- total population: 95.6% (2014 census); 95.8% (2019 census)
- male: 96.9% (no records); 97% (2019 census)
- female: 91.9% (2012); 94.6% (2019 census)
Source: The Worldbank Database etc.[16][17][18][19]
See also[]
- Racism in Vietnam
- List of ethnic groups in Vietnam
- Overseas Vietnamese
Sources[]
References[]
- ^ [1], 28 December 2015.
- ^ Jump up to: a b Population Division of the Department of Economic and Social Affairs of the United Nations Secretariat, World Population Prospects: The 2010 Revision Archived May 6, 2011, at the Wayback Machine
- ^ "Demographic Yearbook". UN Data. United Nations. Retrieved 4 December 2015.
- ^ Socio-economic situation in the fourth quarter and the whole year 2020
- ^ General Statistics Office of Vietnam: Population and employment
- ^ Total fertility rate by province
- ^ United Nations 1993 Demographic Yearbook
- ^ 1999 Population and Housing Census Vietnam
- ^ 2009 Vietnam Population and Housing Census
- ^ Jump up to: a b c "Report on Results of the 2019 Census". General Statistics Office of Vietnam. Retrieved 1 May 2020.
- ^ [2]
- ^ Pew Research Center: [3].
- ^ "Vietnam: sex ratio at birth 2020". Statista. Retrieved 2020-12-02.
- ^ "Recent Change in the Sex Ratio at Birth in Viet Nam". www.unfpa.org. Retrieved 2020-12-02.
- ^ "World Population Prospects – Population Division – United Nations". Retrieved 2017-07-15.
- ^ "Literacy rate, youth male (% of males ages 15-24) - Vietnam | Data". data.worldbank.org. Retrieved 2020-12-02.
- ^ "Vietnam: total literacy rate of adults 2018". Statista. Retrieved 2020-12-02.
- ^ "Top 4 Benefits of Starting a Business in Vietnam". NNRoad. 2020-04-07. Retrieved 2020-12-02.
- ^ "Vietnam 2019 Census". Tongdieutradansovn (in Vietnamese). 2019-07-11.

| show Demographics of Asia |
|---|
- Demographics of Vietnam