Electricity sector in Portugal
This article needs to be updated. (August 2017) |


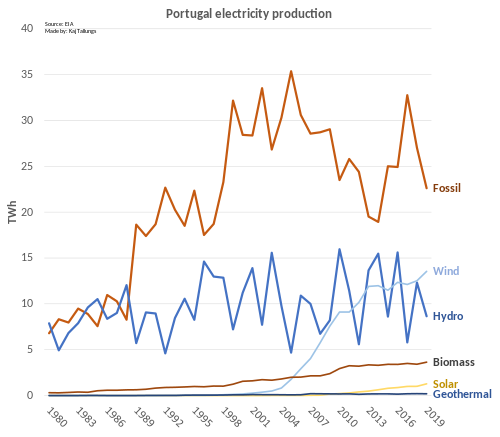
The electricity use in Portugal (gross production + imports – exports – losses) was 51.2 TWh in 2008. Portugal imported 9 TWh electricity in 2008. Population was 10.6 million.[1] In 2018 electricity was generated by 23% hydroelectricity, 26% natural gas, 22% wind, 20% coal, 5% biomass, 2% solar and 2% oil. In 2019 electricity was generated by 19% hydroelectricity, 32% natural gas, 26% wind, 10% coal, 6% biomass, 2% solar, 2% oil and 1% other combustibles.[2][3][4]
Main power stations[]
Hydro[]
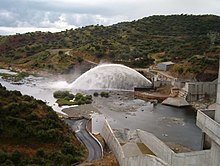
The pumped-storage hydroelectricity plant at Frades works as 880 MW for generation and 780 MW for pumping.[5]
Wind power[]
Portugal produced 20% of electricity with wind power in 2017.[6] and had the average year capacity of 14% of wind power in the end 2010. Wind power capacity was 3,357 MW in end 2009 and 3,702 MW in end 2010.[7]
| EU and Portugal Wind Energy Capacity (MW)[8][9][10][11] | ||||||||||||||||
|---|---|---|---|---|---|---|---|---|---|---|---|---|---|---|---|---|
| No | Country | 2012 | 2011 | 2010 | 2009 | 2008 | 2007 | 2006 | 2005 | 2004 | 2003 | 2002 | 2001 | 2000 | 1999 | 1998 |
| - | EU-27 | 105,696 | 93,957 | 84,074 | 74,767 | 64,712 | 56,517 | 48,069 | 40,511 | 34,383 | 28,599 | 23,159 | 17,315 | 12,887 | 9,678 | 6,453 |
| 6 | Portugal | 4,525 | 4,083 | 3,898 | 3,535 | 2,862 | 2,150 | 1,716 | 1,022 | 522 | 296 | 195 | 131 | 100 | 61 | 60 |
Solar power[]
In Lisbon the energy payback time (see also EROEI) in the roof top solar photovoltaic (PV) technology is less than 2 years and less than in Sydney, Munich, Athens or , but some more than in Madrid, Los Angeles or Ankara.[12]

Transmission[]
| External images | |
|---|---|
Redes Energéticas Nacionais manages the high voltage power lines.
In 2014, Portugal had an electricity interconnection level (international transmission capacity relative to production capacity) of 7%, below the recommended 10% level.[13]
References[]
- ^ IEA Key energy statistics 2010 Page: 27, 54
- ^ https://www.iea.org/reports/monthly-electricity-statistics see: Downloads -> Revised historical data
- ^ "APREN - Production".
- ^ "Archived copy". Archived from the original on 2015-06-20. Retrieved 2015-07-14.CS1 maint: archived copy as title (link)
- ^ "A milestone for hydropower: Successful startup of Frades II, the largest variable speed pumped storage plant in Europe". voith.com. 26 July 2017. Archived from the original on 30 July 2017. Retrieved 30 July 2017.
- ^ "PORDATA - Gross production of electricity: total and by type of electricity generation". www.pordata.pt. Retrieved 2019-09-11.
- ^ EWEA Annual statistics 2010
- ^ EWEA Staff (2010). "Cumulative installed capacity per EU Member State 1998 - 2009 (MW)". European Wind Energy Association. Retrieved 2010-05-22.
- ^ EWEA Staff (February 2011). "EWEA Annual Statistics 2010" (PDF). European Wind Energy Association. Retrieved 2011-01-31.
- ^ EWEA Staff (February 2012). "EWEA Annual Statistics 2011" (PDF). European Wind Energy Association. Retrieved 2011-02-18.
- ^ Wind in power: 2012 European statistics February 2013
- ^ Compared assessment of selected environmental indicators of photovoltaic electricity in OECD cities Archived 2012-03-19 at the Wayback Machine European Photovoltaic Industry Association (EPIA) 5/2006
- ^ COM/2015/082 final: "Achieving the 10% electricity interconnection target" Text PDF page 2-5. European Commission, 25 February 2015. Archive Mirror
- Electric power in Portugal
