Solar power in the United States

Solar power in the United States includes utility-scale solar power plants as well as local distributed generation, mostly from rooftop photovoltaics. As of the end of 2020, the United States had 97,275 megawatts (MW) of installed photovoltaic and concentrated solar power capacity combined.[1] In 2018, utility scale solar power generated 66.6 terawatt-hours (TWh), 1.66% of total U.S. electricity. During the same time period total solar generation, including estimated small scale photovoltaic generation, was 96.1 TWh, 2.30% of total U.S. electricity.[2] In terms of total cumulative installed capacity, by year end 2017 the United States ranked 2nd in the world behind China. In 2016, 39% of all new electricity generation capacity in the country came from solar, more than any other source and ahead of natural gas (29%).[3] By 2015, solar employment had overtaken oil and gas as well as coal employment in the United States.[4] In 2016, more than 260,000 Americans were employed in the solar industry.[5]
The United States conducted much early research in photovoltaics and concentrated solar power. It is among the top countries in the world in electricity generated by the Sun and several of the world's largest utility-scale installations are located in the desert Southwest. The oldest solar power plant in the world is the 354-megawatt (MW) SEGS thermal power plant, in California.[6] The Ivanpah Solar Electric Generating System is a solar thermal power project in the California Mojave Desert, 40 miles (64 km) southwest of Las Vegas, with a gross capacity of 392 MW.[7] The 280 MW Solana Generating Station is a solar power plant near Gila Bend, Arizona, about 70 miles (110 km) southwest of Phoenix, completed in 2013. When commissioned it was the largest parabolic trough plant in the world and the first U.S. solar plant with molten salt thermal energy storage.[8]
There are plans to build many other large solar plants in the United States. Many states have set individual renewable energy goals with solar power being included in various proportions. Hawaii plans 100% renewable-sourced electricity by 2045.[9] Governor Jerry Brown has signed legislation requiring California's utilities to obtain 100 percent of their electricity from zero-carbon sources by the end of 2045 (including 60% renewable energy sources by 2030).[10][11]
Solar potential[]
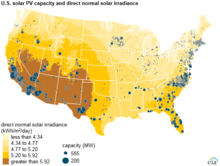
A 2012 report from the National Renewable Energy Laboratory (NREL) described technically available renewable energy resources for each state and estimated that urban utility scale photovoltaics could supply 2,232 TWh/year, rural utility scale PV 280,613 TWh/year, rooftop PV 818 TWh/year, and CSP 116,146 TWh/year, for a total of almost 400,000 TWh/year, 100 times current consumption of 3,856 TWh in 2011.[12][13] For comparison, onshore wind potential is estimated at 32,784 TWh/year, and offshore wind at 16,976 TWh/year, while the total available from all renewable resources is estimated at 481,963 TWh/year.[14]
History[]


Solar energy deployment increased at a record pace in the United States and throughout the world in 2008, according to industry reports. The Solar Energy Industries Association's "2008 U.S. Solar Industry Year in Review" found that U.S. solar energy capacity increased by 17% in 2007, reaching the total equivalent of 8,775 megawatts (MW). The SEIA report tallies all types of solar energy, and in 2007 the United States installed 342 MW of solar photovoltaic (PV) electric power, 139 thermal megawatts (MWth) of solar water heating, 762 MWth of pool heating, and 21 MWth of solar space heating and cooling.[15]
Another report in 2008 by research and publishing firm Clean Edge and the nonprofit Co-op America found that solar power's contribution could grow to 10% of the nation's power needs by 2025, with nearly 2% of the nation's electricity coming from concentrating solar power systems, while solar photovoltaic systems would provide more than 8% of the nation's electricity. Those figures correlate to nearly 50,000 megawatts of solar photovoltaic systems and more than 6,600 megawatts of concentrating solar power.[16] The report noted that the cost per kilowatt-hour of solar photovoltaic systems had been dropping, while electricity generated from fossil fuels was becoming more expensive. As a result, the report projects that solar power was expected to reach cost parity with conventional power sources in many U.S. markets by 2015. To reach the 10% goal, solar photovoltaic companies would need to make solar power a "plug-and-play technology", or simplify the deployment of solar systems.[16] The report also underlines the importance of future "smart grid" technologies.[16]
Solar Energy Industries Association and GTM Research found that the amount of new solar electric capacity increased in 2012 by 76 percent from 2011, raising the United States’ market share of the world's installations above 10 percent, up from roughly 5 to 7 percent in the past seven years.[17] According to the U.S. Energy Information Administration, as of September 2014 utility-scale solar had sent 12,303 gigawatt-hours of electricity to the U.S. grid. This was an increase of over 100% versus the same period in 2013 (6,048 GWh).[18] The number of homes with solar systems installed had been increasing rapidly; from 30,000 in 2006 to 1.3 million in 2016[19] with a study by the U.S. Department of Energy predicting the figure could reach 3.8 million homes by 2020.[20]
In 2015 an article reported that Utilities in the United States have led a largely unsuccessful campaign to slow the growth of solar.[21][clarification needed]
Solar photovoltaic power[]

Solar PV installed capacity[]
| Year | Total (MWp) | YOY Growth | Installed Capacity (MWp) |
|---|---|---|---|
| 1992 | 43.5 | ||
| 1993 | 50.3 | 15.60% | 6.8 |
| 1994 | 57.8 | 14.90% | 7.5 |
| 1995 | 66.8 | 15.60% | 9.0 |
| 1996 | 76.5 | 14.50% | 9.7 |
| 1997 | 88.2 | 15.30% | 11.7 |
| 1998 | 100.1 | 13.50% | 11.9 |
| 1999 | 117.3 | 17.20% | 17.2 |
| 2000 | 138.8 | 18.30% | 21.5 |
| 2001 | 167.8 | 20.90% | 29.0 |
| 2002 | 212.2 | 26.50% | 44.4 |
| 2003 | 275.2 | 29.70% | 63.0 |
| 2004 | 376.0 | 36.60% | 100.8 |
| 2005 | 479.0 | 27.40% | 103.0 |
| 2006 | 624.0 | 30.30% | 145.0 |
| 2007 | 830.5 | 33.10% | 206.5 |
| 2008 | 1,169 | 40.70% | 338.0 |
| 2009 | 1,642 | 40.50% | 473.1 |
| 2010 | 2,534 | 55.90% | 918.0 |
| 2011 | 4,383 | 73.20% | 1,855 |
| 2012 | 7,410 | 69.06% | 3,027 |
| 2013 | 12,176 | 64.32% | 4,766 |
| 2014 | 18,421 | 51.29% | 6,245 |
| 2015 | 25,930 | 40.76% | 7,509 |
| 2016 | 41,034 | 58.25% | 15,104 |
| 2017 | 52,114 | 27.00% | 11,080 |
| 2018 | 62,869 | 20.64% | 10,755 |
| 2019 | 76,353 | 21.44% | 13,484 |
| 2020 | 95,574 | 25.17% | 19,221 |
| showU.S. grid-connected photovoltaic capacity by state (MWP).[27][28][29][30][31][32][33][34] |
|---|

In the United States, 14,626 MW of PV was installed in 2016, a 95% increase over 2015 (7,493 MW). During 2016, 22 states added at least 100 MW of capacity.[5] Just 4,751 MW of PV installations were completed in 2013. The U.S. had approximately 440 MW of off-grid photovoltaics as of the end of 2010. Through the end of 2005, a majority of photovoltaics in the United States was off-grid.[35]:p.6[36]
Solar PV generation[]
| showSolar PV generation in the United States[37] |
|---|
| showUtility scale solar photovoltaic electricity generation in the United States[38] |
|---|
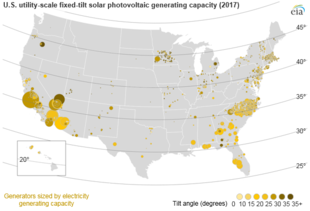
The amount of electricity a unit is capable of producing over an extended period of time is determined by multiplying the capacity by the capacity factor. The capacity factor for solar photovoltaic units is largely a function of climate and latitude and so varies significantly from state to state. The National Renewable Energy Laboratory has calculated that the highest statewide average solar voltaic capacity factors are in Arizona, New Mexico, and Nevada (each 26.3 percent), and the lowest is Alaska (10.5 percent). The lowest statewide average capacity factor in the contiguous 48 states is in West Virginia (17.2 percent).[39]
Solar PV by type[]
| Source | Summer capacity (GW) |
Electricity generation (TWh) |
Capacity factor | Yearly growth of produced energy |
Portion of total electricity |
|---|---|---|---|---|---|
| PV (Utility scale) | 30.17 | 63.00 | 0.238 | 26% | 1.5% |
| PV small scale | 19.52 | 29.54 | 0.173 | 23% | 0.7% |
| Thermal | 1.76 | 3.59 | 0.233 | 9.8% | 0.09% |
| TOTAL | 51.45 | 96.13 | 0.213 | 24.4% | 2.3% |
| Capacity and generation figures rounded to 2 dp. to facilitate comparisons. | |||||
The table above gives an indication of the spread of solar PV between the different types at the end of 2018. Capacity figures may seem smaller than those quoted by other sources and it is likely that the capacities are measured in MW AC rather than MW DC, the former of which gives a lower reading due to conversion losses during the process by which power is transformed by inverters from direct current to alternating current. Utility scale PV accounted for the largest figure at 30.17 GW and 63 TWh of generation. Next came small scale PV with 19.52 GW capacity and 29.54 TWh of generation. The proportion of residential and commercial solar to utility scale solar varies greatly between states (see distributed generation section below). Finally solar thermal generation was the smallest deployment by power rating at 1.76 GW capacity and 3.59 TWh generation.
The first floating solar array in the US was a 160 kW array installed next to Miami International Airport by Florida Power and Light in partnership with Miami-Dade County in 2020.[41]
Large-scale PV facilities[]

Current situation[]
Large-scale photovoltaic power plants in the United States often consist of two or more units which correspond to construction stages and/or technology-improvement phases of a particular development project. Typically these units are co-located in the vicinity of the same high-capacity transmission substation, and may also feed that substation with other large PV plants which are adjacently sited but separately developed. As of 2018, the ten largest operating plants in the United States, based on development grouping and total AC power capacity, are:
1) The 579 megawatt (MWAC) Solar Star plant (Units I and II) in California was the world's largest photovoltaic power station when completed in 2015. It was superseded later that year by the Longyangxia Dam Solar Park in China.
2) The Copper Mountain Solar Facility is a 882 MWAC solar power plant in Eldorado Valley, Nevada that consists of four units.[42] Sempra Generation completed the first unit in 2010, and the latest came online in late 2016.[42][43]
3) The Topaz Solar Farm is a 550 MWAC photovoltaic power plant near San Luis Obispo County, California that has been fully operational since November 2014.[44]
4) The Desert Sunlight Solar Farm is a 550 MWAC solar power station located in the Sonoran Desert of California and completed in January 2015.[45]
5) The 460 MWAC Mount Signal Solar reached its current capacity when unit III came online in late 2018; the project will reach 600 MW when unit II is completed around 2020.
6) The 400 MWAC Mesquite Solar project in Arizona consists of three units at the end of 2016 and is still being expanded.
7) The Agua Caliente Solar Project is a 290 MWAC facility in Yuma County, Arizona operating at full capacity since April 2014.[46][47]
8) The California Flats Solar Project in Monterey County, California reached a capacity of 280 MWAC when a second unit came online at the end of 2018.
9) The Springbok Solar Farm is a 260 MWAC facility in Kern County, California with two units completed. It is expected to reach 350 MW with completion of the third unit in 2019.
10) At 250 MWAC each, there are five plants: McCoy Solar Energy Project, Silver State South Solar Project, California Valley Solar Ranch, Desert Stateline Solar Facility, and Moapa Southern Paiute Solar Project
Distributed generation[]
Within the cumulative PV capacity in the United States, there has been growth in the distributed generation segment, which are all grid-connected PV installations in the residential and non-residential markets. Non-residential market includes installations on commercial, government, school and non-profit organization properties.
Between 2000 and 2013 there had been 2,261 MW of residential solar and 4,051 MW non-residential solar installed.[48] After years of cost reduction, the average US price per watt was between $2.51 to $3.31 in 2020.[49]
Another type of distributed generation implemented by a utility company was the world's first grid-connected pole-attached solar panels of Public Service Enterprise Group in New Jersey. More than 174,000 PV panels are mounted on utility poles along streets of New Jersey with aggregated capacity of 40 MW.[50][51]
As of November 2017, there were nearly 5,500 schools in the United States that had solar installations with the total capacity of approximately 910 MW. The top five states were Nevada, California, Hawaii, Arizona, and New Jersey with 23.10%, 14.50%, 14.50%, 14.10% and 13.00% of the schools in the respective states that had installations.[52] As of April 2018, there were total capacity of 2,562 MW of commercial solar installations from more than 4,000 companies in 7,400 locations. Top five corporations were Target, Walmart, Prologis, Apple, and Kohl's.[53]

Photovoltaic panels on the roof of a house in Boston

Photovoltaic panels on a town hall

Photovoltaic panels on a school building

Pole-attached solar panels in New Jersey


Solar cell manufacturing[]
This section needs to be updated. (December 2017) |
In late September 2008, Sanyo Electric Company, Ltd. announced its decision to build a manufacturing plant for solar ingots and wafers (the building blocks for silicon solar cells) in Salem, Oregon. The plant was scheduled to begin operating in October 2009 and scheduled to reach its full production capacity of 70 megawatts (MW) of solar wafers per year by April 2010. In April 2013 the plant closed its wafer slicing operation. In February 2016 the parent company, Panasonic, announced it would lay off 37% of the remaining workforce.[54] In early October 2008, First Solar, Inc. broke ground on an expansion of its Perrysburg, Ohio, planned to add enough capacity to produce another 57 MW per year of solar modules at the facility, bringing its total capacity to roughly 192 MW per year. In November 2016 the company reduced the workforce in the Perrysburg plant by 20% as part of a worldwide restructuring.[55] In mid-October 2008, SolarWorld AG opened a manufacturing plant in Hillsboro, Oregon. In 2016 the Hillsboro plant was the largest photovoltaic technology manufacturing plant in the Western Hemisphere. It maintains 500 megawatts of cell-manufacturing capacity and 350 MW of module-assembly capacity.[56]
Rapidly decreasing photovoltaic prices put General Electric's planned factory in Colorado on hold,[57] and led to the bankruptcy of Konarka Technologies, which had expected to produce 1,000 MW of solar modules per year by 2011, and Solyndra, which defaulted on a $535 million loan guarantee, prompting Republican members of the Energy and Commerce committee to vote to cease accepting new applications to the loan program. HelioVolt Corporation opened a manufacturing facility in Austin, Texas that will have an initial capacity to produce 20 MW of solar cells per year. Starting with solar "inks" developed at DOE's National Renewable Energy Laboratory that are deposited with ink jets, HelioVolt employs a proprietary "printing" process to produce solar cells consisting of thin films of copper indium gallium selenide, or CIGS. The technology won an in 2008 and it earned an Editor's Choice Award for Most Revolutionary Technology. HelioVolt's "" reactive transfer printing process is 10–100 times faster than other CIGS production processes and can also be combined with vacuum evaporation or techniques. At its new Austin manufacturing plant, HelioVolt plans to produce both solar modules and next-generation building-integrated solar products using its FASST process.
In 2012 the U.S. Department of Commerce placed a 31% tariff on solar cells made in China.[58] In 2018, the Trump administration placed a 30% tariff on all imported solar equipment.[59] In September 2014, SolarCity broke ground on a solar panel manufacturing plant in Buffalo, New York. Upon its completion in 2016, it was projected to be the largest solar manufacturing facility in the Western hemisphere, with an annual manufacturing capacity of 1 gigawatt (GW).[60] However, as of 2019 the facility has not met the projections on production or job creation.[61]
Concentrated solar power (CSP)[]

History[]
One of the first applications of concentrated solar was the 6 horsepower (4.5 kW) solar powered motor made by H.E. Willsie and John Boyle in 1904.[62]
An early solar pioneer of the 19th and 20th century, Frank Shuman, built a demonstration plant that used solar power to pump water using an array of mirrors in a trough to generate steam. Located in Philadelphia, the solar water pump station was capable of pumping 3,000 US gallons (11,000 l) an hour at that latitude, corresponding to 25 horsepower (19 kW).[63] After seven weeks of testing the plant was disassembled and shipped to Egypt for testing as an irrigation plant.[64]
In 1973, Karl Böer of the University of Delaware built an experimental house called the Solar One, the first house to convert sunlight into energy.[65]
Solar One, the first pilot solar power tower design was completed in 1981. The parabolic trough Solar Energy Generating Systems opened its first unit in 1984, the first major solar thermal plant in the world.
Selected list of plants[]


The United States pioneered solar tower and trough technologies. A number of different solar thermal technologies are in use in the U.S.:
- The largest solar thermal power plant in the world is the 392 MW Ivanpah Solar Power Facility, in California. It deploys 173,500 heliostats each with two mirrors focusing solar energy on boilers located on centralized solar power towers. The facility opened on February 13, 2014.[66]
- The Solana Generating Station is a solar power plant near Gila Bend, Arizona, about 70 miles (110 km) southwest of Phoenix, completed in 2013. When commissioned it was the largest parabolic trough plant in the world and the first U.S. solar plant with molten salt thermal energy storage.[8] Built by the Spanish company Abengoa Solar,[67] it has a total capacity of 280 megawatts (MW),[67] which is enough to power 70,000 homes while avoiding around 475,000 tons of carbon dioxide.[67] Its name is the Spanish term for "sunny spot".[68]
- The Martin Next Generation Solar Energy Center is a hybrid 75 megawatt (MW) parabolic trough solar energy plant that is owned by Florida Power & Light Company (FPL). The solar plant is a component of the 3,705 MW Martin County Power Plant, which is currently the single largest fossil fuel burning power plant in the United States.[69] Completed at the end of 2010,[70] it is located in western Martin County, Florida, just north of Indiantown.
- The Mojave Solar Project is a 280 MW solar thermal power facility in the Mojave Desert in California, which was completed in December 2014.
- The Crescent Dunes Solar Energy Project is a 110 MW solar thermal power project near Tonopah, about 230 miles (370 km) northwest of Las Vegas, which was completed in September 2015.[71][72]
The rapidly falling price of PV solar had led to several projects being abandoned or converted to PV technology.[73] Blythe Solar Power Project converted to a PV project, Rice Solar Energy Project was put on indefinite hold, Palen Solar Project tried to convert to PV but its permits were denied, Hidden Hills Solar Project was suspended in 2013 and later canceled.[74][75] No major CSP plants remain under construction in the United States.
CSP capacity and generation[]
Abengoa's 280 MWac of CSP project was brought online in the 3rd quarter and Genesis Solar's first phase of 125 MWac was brought online in the 4th quarter of 2013 bringing the total to 410 MWac for the year and 918 MWac total. Ivanpah is already completed during the first quarter of 2014 the current world's largest CSP power plant is 392 MWac and brings the total to 1310 MWac. The 110 MWac Crescent Dunes project started commissioning during February. The 250 MWac Mojave solar, second phase 125 MWac Genesis Solar, and Tooele Army Depot Solar's 1.5 MWac power plant are all expected to come online in 2014.[76] A total of around 9.5 GW of solar PV and CSP capacity is expected to come online in 2016, more than any other source.[77]
| showUnited States grid-connected CSP capacity by state (MW)[78][79][35][80][81][22][82][83][1] |
|---|
- U.S. total numbers from 2016 onwards include utility-scale capacity only.
| showSolar thermal electricity generation in the United States[38] |
|---|
Government support[]
A complete list of incentives is maintained at the Database of State Incentives for Renewable Energy (DSIRE) (see external link). Most solar power systems are grid connected and use net metering laws to allow use of electricity in the evening that was generated during the daytime. New Jersey leads the nation with the least restrictive net metering law,[84] while California leads in total number of homes which have solar panels installed. Many were installed because of the million solar roof initiative.[85] In some states, such as Florida, solar power is subject to legal restrictions that discourage its use.[86]
Federal[]
The federal tax credit for solar was extended for eight years as part of the financial bail out bill, H.R. 1424, until the end of 2016. It was estimated this will create 440,000 jobs, 28 gigawatts of solar power, and lead to a $300 billion market for solar panels. This estimate did not take into account the removal of the $2,000 cap on residential tax credits at the end of 2008.[87][needs update] A 30% tax credit is available for residential and commercial installations.[88][89] For 2009 through 2011 this was a 30% grant, not a tax credit, known as the 1603 grant program.[90]
The federal Residential Energy Efficient Property Credit (income tax credit on IRS Form 5695) for residential PV and solar thermal was extended in December 2015 to remain at 30% of system cost (parts and installation) for systems put into service by the end of 2019, then 26% until the end of 2020, and then 22% until the end of 2021. It applies to a taxpayer's principal and/or second residences, but not to a property that is rented out. There is no maximum cap on the credit, and the credit can be applied toward the Alternative Minimum Tax, and any excess credit (greater than that year's tax liability) can be rolled into the following year.[91][92] The solar industry and utilities clashed extensively on renewal, but the solar industry prevailed.[93] The renewal is expected to add $38 billion of investment for 20 GigaWatts of solar.[94]
Section 1603 grants[]
President Obama's stimulus bill in 2009 created a program known as Section 1603 grants. The program was designed to give federal grants to solar companies for 30 percent of investments into solar energy. Since 2009, the federal government has given solar companies $25 billion in grant money through this program. The Section 1603 grant program expired in 2011.[95]
On June 9, 2016, Senator Orrin Hatch requested from Department of Treasury, the Internal Revenue Service (IRS) and the Treasury Inspector General for Tax Administration (TIGTA) details about how companies use Section 1603 grants and tax credits. In March 2016, Hatch asked the IRS and Treasury Department to demonstrate that the agencies use safeguards and coordinate with each other when reviewing applications for Section 1603 grants.[96]
Solar America Initiative[]

The United States Department of Energy (DOE) announced on September 29, 2008 that it will invest $17.6 million, subject to annual appropriations, in six company-led, early-stage photovoltaic (PV) projects under the Solar America Initiative's "PV Incubator" funding opportunity, designed to fund prototype PV components and systems with the goal of moving them through the commercialization process by 2010 and make it cost-competitive with conventional forms of electricity by 2015 (grid parity).[97][98]
SunShot Initiative[]
The SunShot Initiative aimed to reduce the cost of solar power by 75% from 2010 to 2020. The name is based on "moon shot", Kennedy's target of reaching the moon within the decade.[99]
Goals:
- Residential system prices reduced from $6/W to $1.50/W
- Commercial system prices reduced from $5/W to $1.25/W
- Utility-scale system prices reduced from $4/W to $1.00/W (CSP, CPV and PV)
Trump administration[]
In 2018, as part of a trade war between the U.S. and China, US President Trump imposed tariffs on imported solar cells.[100] The push for tariffs to protect American manufacturing and jobs in the solar power industry began in April 2017, when a bankrupt Georgia-based solar cell maker filed a trade complaint that a flood of cheap imports put them at a severe disadvantage. In response, the President imposed 30% tariffs of solar imports in January 2018.[101] The solar industry is currently one of the fastest growing in the United States, employing more than 250,000 people as of 2018.[100] On one hand, these tariffs forced the cancellation or scaling down of many projects and restrict the ability of companies to recruit more workers.[100] On the other hand, they have the intended effect of incentivizing domestic manufacturing. Many solar power companies are transitioning towards automation and consequently will become less dependent on imports, especially from China.[100] Analysts believe Trump's tariffs have made a clear impact. Without them, the manufacturing capacity for solar cells in the United States would likely not have increased significantly, from 1.8 gigawatts in 2017 to at least 3.4 gigawatts in 2018, they argue. However, because of the increasing reliance on automation, not that many new jobs will be created, while profits will flow to other countries, as many firms are foreign.[101] By 2019, the solar power industry has recovered from the initial setbacks due to Trump's tariffs, thanks to initiatives from various states, such as California.[102] Moreover, it is receiving considerable support from the Department of Energy. The National Renewable Energy Laboratory (NREL) launched the "American-made Solar Prize" competition in June 2018 and has handed out tens to hundreds of thousand of dollars in cash prizes for the most promising solar cell designs.[103] Prices of solar cells continue to decline.[101]
State and local[]
State initiatives[]

- Governor Jerry Brown signed legislation requiring California's utilities to get 50 percent of their electricity from renewable energy sources by the end of 2030.[11]
- The San Francisco Board of Supervisors passed solar incentives of up to $6,000 for homeowners and up to $10,000 for businesses.[104] Applications for the program began on July 1, 2008.[105] in April 2016, they passed a law requiring all new buildings below 10 stories to have rooftop solar panels, making it the first major U.S. city to do so[106]
- In 2008, Berkeley initiated a revolutionary pilot program where homeowners are able to add the cost of solar panels to their property tax assessment, and pay for them out of their electricity cost savings.[107] In 2009, more than a dozen states passed legislation allowing property tax financing. In all, 27 states offer loans for solar projects[108] (though after the conclusion of the pilot program, due to issues with Fannie Mae and Freddie Mac, Berkeley no longer offers this financing mechanism[109]).
- The California Solar Initiative has set a goal to create 3,000 megawatts of new, solar-produced electricity by 2016.
- New Hampshire has a $3,750 residential rebate program for up to 50% of system cost for systems less than 5 kWp ($6,000 from July 1, 2008 until 2010).[110]
- Louisiana has a 50 per cent tax credit up to $12,500 for the installation of a wind or solar system.[111][112]
- New Jersey law provides new solar power installations with exemptions from the 7% state sales tax, and from any increase in property assessment (local property tax increases), subject to certain registration requirements.[113][114]
Feed-in Tariffs[]
Experience has demonstrated that a feed-in tariff is both the least expensive and the most effective means of developing solar power. Investors need certainty, which they receive from a feed-in tariff.[115] California enacted a feed-in tariff which began on February 14, 2008.[116][117] Washington state has a feed-in tariff of 15 ¢/kWh which increases to 54 ¢/kWh if components are manufactured in the state.[118] Hawaii,[119] Michigan,[120] and Vermont[121] also have feed in tariffs.[122] In 2010, the Federal Energy Regulatory Commission (FERC) ruled that states were able to implement above-market feed-in tariffs for specific technologies.[123][124]
Solar Renewable Energy Certificates[]
In recent years, states that have passed Renewable Portfolio Standard (RPS) or Renewable Electricity Standard (RES) laws have relied on the use of Solar renewable energy certificates (SRECs) to meet state requirements. This is done by adding a specific solar carve-out to the state Renewable Portfolio Standard (RPS). The first SREC program was implemented in 2005 by the state of New Jersey and has since expanded to several other states, including Maryland, Delaware, Ohio, Massachusetts, North Carolina and Pennsylvania.[125]
An SREC program is an alternative to the feed-in tariff model popular in Europe. The key difference between the two models is the market-based mechanism that drives the value of the SRECs, and therefore the value of the subsidy for solar. In a feed-in tariff model, the government sets the value for the electricity produced by a solar facility. If the level is higher, more solar power is built and the program is more costly. If the feed-in tariff is set lower, less solar power is built and the program is ineffective. The problem with SRECs is a lack of certainty for investors. A feed-in tariff provides a known return on investment, while an SREC program provides a possible return on investment.
Power Purchase Agreements[]
In 2006 investors began offering free solar panel installation in return for a 25-year contract, or Power Purchase Agreement, to purchase electricity at a fixed price, normally set at or below current electric rates.[126][127] By 2009 over 90% of commercial photovoltaics installed in the United States were installed using a power purchase agreement.[128] Approximately 90% of the photovoltaics installed in the United States is in states that specifically address power purchase agreements.[129]
New construction mandates[]
In March 2013, Lancaster, California became the first U.S. city to mandate the inclusion of solar panels on new homes, requiring that "every new housing development must average 1 kilowatt per house."[130]
PACE[]
An innovative financing arrangement pioneered in Berkeley, California, and Palm Springs, lends money to a homeowner for a solar system, to be repaid via an additional tax assessment on the property for 20 years. This allows installation of the solar system at "relatively little up-front cost to the property owner."[131] Now known as PACE, for Property Assessed Clean Energy, it is available in 28 states.[132] Freddie Mac and Fannie Mae have objected to the repayment of solar loans being senior to mortgage loans, and some states have relegated PACE loans to junior loans. HR 2599 was introduced to prevent interference with the PACE program by other lenders.[133] The principal feature of the program is that the balance of the loan is transferred to the new owners in the event the property is sold, and the loan is paid for entirely through electric bill savings. Unlike a mortgage loan, no funds are transferred when the property is sold - only the repayment obligation is transferred. PACE programs are currently operating in eight states, California, Colorado, Florida, Maine, Michigan, Missouri, New York, and Wisconsin, and are on hold in many others, pending resolution of the Freddie Mac, Fannie Mae objection.[134]
Controversy and congressional investigation[]
In 2016, the Senate Finance Committee and the House Ways and Means Committee ran a formal investigation into billions of dollars in tax incentives that solar-energy companies received. The investigation also focused on whether the Obama administration improperly gave out solar tax credits. The investigational probe was led by Senator Orrin Hatch (R-Utah), the chairman of the Senate Finance Committee, and U.S. Representative Kevin Brady (R-Texas), the chairman of the Ways and Means Committee.
Generation (PV and CSP)[]
| Year | NREL Total |
EIA Util Total |
EIA Util % of total |
Jan | Feb | Mar | Apr | May | Jun | Jul | Aug | Sept | Oct | Nov | Dec |
|---|---|---|---|---|---|---|---|---|---|---|---|---|---|---|---|
| 1998 | 502 | ||||||||||||||
| 1999 | 495 | ||||||||||||||
| 2000 | 804 | 493 | |||||||||||||
| 2001 | 822 | 543 | 7 | 13 | 31 | 39 | 81 | 91 | 92 | 85 | 65 | 21 | 14 | 4 | |
| 2002 | 857 | 555 | 11 | 24 | 44 | 46 | 58 | 96 | 86 | 75 | 53 | 31 | 28 | 4 | |
| 2003 | 929 | 534 | 13 | 18 | 50 | 60 | 68 | 91 | 63 | 62 | 56 | 36 | 14 | 4 | |
| 2004 | 1,020 | 575 | 0.01% | 13 | 11 | 53 | 57 | 82 | 88 | 82 | 73 | 61 | 34 | 15 | 8 |
| 2005 | 1,145 | 551 | 0.01% | 8 | 13 | 37 | 57 | 81 | 87 | 71 | 75 | 60 | 37 | 12 | 2 |
| 2006 | 1,312 | 508 | 0.01% | 13 | 20 | 33 | 52 | 71 | 70 | 62 | 83 | 54 | 32 | 16 | 3 |
| 2007 | 1,718 | 612 | 0.01% | 13 | 19 | 48 | 54 | 84 | 84 | 86 | 75 | 68 | 48 | 23 | 3 |
| 2008 | 2,208 | 864 | 0.02% | 16 | 36 | 75 | 94 | 99 | 128 | 111 | 105 | 93 | 60 | 29 | 19 |
| 2009 | 2,922 | 892 | 0.02% | 7 | 30 | 78 | 99 | 110 | 103 | 121 | 116 | 95 | 68 | 40 | 21 |
| 2010 | 4,505 | 1,212 | 0.03% | 10 | 33 | 76 | 112 | 153 | 176 | 161 | 156 | 138 | 75 | 77 | 44 |
| 2011 | 7,454 | 1,818 | 0.04% | 40 | 85 | 122 | 164 | 191 | 223 | 191 | 229 | 186 | 159 | 107 | 121 |
| 2012 | 12,692 | 4,327 | 0.11% | 95 | 135 | 231 | 319 | 462 | 527 | 509 | 462 | 458 | 431 | 347 | 349 |
| 2013 | 21,074 | 9,253 | 0.23% | 318 | 479 | 668 | 734 | 826 | 930 | 861 | 1,001 | 979 | 967 | 750 | 737 |
| 2014 | 32,553 | 18,321 | 0.45% | 775 | 858 | 1,355 | 1,607 | 1,880 | 2,061 | 1,874 | 1,937 | 1,925 | 1,701 | 1,387 | 985 |
| 2015 | 44,296 | 26,473 | 0.65% | 1,173 | 1,634 | 2,221 | 2,567 | 2,665 | 2,765 | 2,813 | 2,880 | 2,350 | 2,021 | 1,889 | 1,623 |
| 2016 | 52,833[135] | 36,754 | 0.90% | 1,546 | 2,423 | 2,721 | 2,981 | 3,644 | 3,591 | 4,064 | 3,936 | 3,613 | 3,132 | 2,642 | 2,299 |
| 2017 | 77,097[135] | 52,958 | 1.32% | 2,220 | 2,562 | 4,475 | 4,816 | 5,815 | 6,272 | 5,544 | 5,427 | 5,145 | 4,804 | 3,072 | 3,059 |
| 2018 | 96,147[135] | 66,604 | 1.59% | 3,262 | 4,037 | 5,099 | 6,111 | 7,091 | 7,815 | 6,869 | 6,982 | 6,471 | 5,225 | 3,945 | 3,158 |
| 2019 | 107,275[135] | 72,234 | 1.75% | 3,652 | 3,913 | 6,020 | 6,949 | 7,292 | 8,216 | 8,256 | 7,844 | 6,726 | 6,110 | 4,373 | 3,494 |
| 2020 | 132,631[135] | 90,891 | 2.27% | 4,555 | 5,652 | 6,314 | 8,010 | 9,742 | 9,467 | 10,284 | 9,370 | 7,757 | 7,326 | 5,890 | 5,381 |
| 2021 | 57,029 | 2.89% | 5,732 | 6,502 | 9,342 | 10,923 | 12,467 | 12,063 | |||||||
| Last entry, % of Total | 1.63% | 1.99% | 3.01% | 3.73% | 3.93% | 3.22% | 2.49% | 2.34% | 2.32% | 2.33% | 1.95% | 1.56% | |||
NREL includes distributed generation, EIA, including the monthly data above, includes only utility generation. "EIA % of total" is the percent of all electricity produced that is generated by utility solar.
See also[]
- American Solar Energy Society
- List of photovoltaics companies
- Renewable energy in the United States
- Renewable energy by country
- Electricity sector in the United States
- Energy in the United States
- Wind power in the United States
- Hydroelectric power in the United States
- Biofuel in the United States
- Geothermal energy in the United States
References[]
- ^ Jump up to: a b c Solar Industry Research Data
- ^ US Energy Information Administration, Table 1.1.A. Net Generation by Other Renewable Sources: Total (All Sectors), 2003–July 2013, Table 1.1. Net Generation by Energy Source: Total (All Sectors), 2003–Dec 2013, accessed 1. dec 2015.
- ^ US Solar Market Grows 95% in 2016, Smashes Records, Greentech Media, Mike Munsell, February 15, 2017
- ^ "Clean-Energy Jobs Surpass Oil Drilling for First Time in U.S." Bloomberg.com. May 25, 2016. Retrieved October 12, 2016.
- ^ Jump up to: a b "U.S. Solar Market Grows 95% in 2016, Smashes Records | SEIA". SEIA. Retrieved 2017-10-27.
- ^ "Segs Iii, Iv, V, Vi, Vii, Viii & Ix". Fplenergy.com. Archived from the original on 2014-08-05. Retrieved 2012-01-31.
- ^ "Brightsource Ivanpah". Archived from the original on 2013-01-11. Retrieved 2014-03-17.
- ^ Jump up to: a b Mearian, Lucas. U.S. flips switch on massive solar power array that also stores electricity: The array is first large U.S. solar plant with a thermal energy storage system, October 10, 2013. Retrieved October 18, 2013.
- ^ PRESS RELEASE: Governor Ige signs bill setting 100 percent renewable energy goal in power sector, Government of Hawaii, June 8, 2015
- ^ California Sets Goal Of 100 Percent Clean Electric Power By 2045, NPR, September 10, 2018
- ^ Jump up to: a b David R. Baker (October 7, 2015). "Brown signs climate law mandating 50% renewable power by 2030". San Francisco Chronicle.
- ^ "National Renewable Energy Laboratory: Solar Has The Most Potential Of Any Renewable Energy Source".
- ^ "Electricity - U.S. Energy Information Administration (EIA)". www.eia.gov.
- ^ "Renewable Energy Technical Potential - Geospatial Data Science - NREL". www.nrel.gov.
- ^ "Solar Energy Grew at a Record Pace in 2008". Apps1.eere.energy.gov. Retrieved 2012-01-31.
- ^ Jump up to: a b c Study: Solar Power Could Provide 10% of U.S. Electricity by 2025 June 25, 2008 retrieved 25 June 2009
- ^ Cardwell, Diane (13 March 2013). "Solar Group Reports Surge in U.S. Installations" – via www.nytimes.com.
- ^ "Solar power's stunning growth: US generation up 100 percent this year". CNBC. December 2, 2014. Retrieved December 5, 2014.
- ^ "Solar Industry Growing at a Record Pace". SEIA. Retrieved June 11, 2017.
- ^ Laura Wisland (September 4, 2014). "How Many Homes Have Rooftop Solar? The Number is Growing…". Union of Concerned Scientists. Retrieved 2014-12-10.
- ^ Warrick, Joby (7 March 2015). "Utilities wage campaign against rooftop solar" – via www.washingtonpost.com.
- ^ Jump up to: a b "Solar Market Insight Report 2013 Year in Review - SEIA". SEIA.
- ^ IEA PVPS Task 1 (2010), Trend Report 2009 (PDF), retrieved 28 March 2011
- ^ EPIA Market Report, archived from the original (PDF) on 18 March 2012, retrieved 23 February 2012
- ^ "U.S. Solar Market Insight 2012 Year in Review - SEIA". SEIA.
- ^ U.S. Solar Market Sets New Record, Installing 7.3 GW of Solar PV in 2015 Retrieved 2 March 2016
- ^ Sherwood, Larry (July 2014). "U.S. Solar Market Trends 2013" (PDF). Interstate Renewable Energy Council (IREC). Retrieved 2014-07-16.
- ^ Sherwood, Larry (July 2013). "U.S. Solar Market Trends 2012" (PDF). Interstate Renewable Energy Council (IREC). Archived from the original (PDF) on 2019-04-12. Retrieved 2013-07-31.
- ^ Sherwood, Larry (August 2012). "U.S. Solar Market Trends 2011" (PDF). Interstate Renewable Energy Council (IREC). Archived from the original (PDF) on 2012-09-06. Retrieved 2012-08-22.
- ^ Sherwood, Larry (June 2011). "U.S. Solar Market Trends 2010" (PDF). Interstate Renewable Energy Council (IREC). Archived from the original (PDF) on 2019-12-17. Retrieved 2011-06-29.
- ^ Sherwood, Larry (July 2010). "U.S. Solar Market Trends 2009" (PDF). Interstate Renewable Energy Council (IREC). Archived from the original (PDF) on 2010-09-25. Retrieved 2010-07-28.
- ^ Sherwood, Larry (July 2009). "U.S. Solar Market Trends 2008" (PDF). Interstate Renewable Energy Council (IREC). Archived from the original (PDF) on 2009-11-23. Retrieved 2010-07-24.
- ^ Sherwood, Larry (August 2008). "U.S. Solar Market Trends 2007" (PDF). Interstate Renewable Energy Council (IREC). Retrieved 2010-07-24.[permanent dead link]
- ^ "Solar State by State".
- ^ Jump up to: a b Office of Energy Efficiency and Renewable Energy (November 2011). "2010 Solar Technologies Market Report" (PDF). United States Department of Energy. p. 10. Retrieved 2012-09-09.
- ^ "2008 Solar Technologies Market Report" (PDF). NREL. January 2010. Retrieved 2012-09-09.
- ^ Electric Power Monthly Retrieved 2 March 2016
- ^ Jump up to: a b c "Electric Power Monthly". US Energy Information Administration.
- ^ Anthony Lopez, Billy Roberts, Donna Heimiller, Nate Blair, and Gian Porro, U.S. Renewable Energy Technical Potentials: A GIS-Based Analysis Archived 2012-09-15 at the Wayback Machine, National Renewable Energy Laboratory, Technical Report NREL/TP-6A20-51946, July 2012
- ^ "Electric Power Annual". US Energy Information Administration. Retrieved 2019-03-05.
- ^ "FPL Launches Nation's First Floating Solar Array Near Miami International Airport". CBS Miami. 2020-01-28. Retrieved 2021-05-02.
- ^ Jump up to: a b America's Largest PV Power Plant Is Now Live (December 6, 2010), Renewable Energy World.
- ^ "Copper Mountain Solar 4". semprarenewables.com.
- ^ Steve Leone (7 December 2011). "Billionaire Buffett Bets on Solar Energy". Renewable Energy World.
- ^ "DOE Closes on Four Major Solar Projects". Renewable Energy World. 30 September 2011.
- ^ "Excellence in Renewable Energy Awards Winners: Project of the Year and Readers' Choice". Renewable Energy World. 17 February 2012.
- ^ "Agua Caliente Reaches 200-Megawatt Milestone - SEIA". SEIA.
- ^ Solar Market Insight Report 2013 Year in Review (Report). Solar Energy Industries Association. 2014. Retrieved 17 July 2014.
- ^ "Solar Panel Cost In 2020 [State By State Data] | EnergySage". Solar News. 15 July 2020. Archived from the original on 6 September 2020.
- ^ "Solar 4 All™ Fact Sheet" (PDF). PSE&G. Retrieved 17 July 2014.
- ^ "The State of Solar Power in the U.S.: Current Trends" (PDF). Haynes Boone. 7 October 2010. Retrieved 17 July 2014.
- ^ "Brighter Future: A Study on Solar in U.S. Schools". Solar Energy Industries Association. November 2017. Retrieved 1 December 2018.
- ^ "Solar Means Business - Tracking Corporate Solar Adoption in the U.S." (PDF). Solar Energy Industries Association. Retrieved 1 December 2018.
- ^ "Panasonic to lay off 50 at Salem solar panel factory". OregonLive.com. Retrieved 2017-02-05.
- ^ WTOL Staff. "First Solar's Perrysburg facility announces layoffs". Retrieved 2017-02-05.
- ^ "Hillsboro/Oregon". SolarWorld. Retrieved 2017-02-05.
- ^ Korosec, Kirsten. "GE postpones thin-film solar factory plans - ZDNet".
- ^ "Implications of the US-China Solar Tariff on Project Development - Sol Systems". Sol Systems.
- ^ Rowland, Geoffrey (26 January 2018). "Solar company puts hold on $20M US investment following new tariff". TheHill.
- ^ "SolarCity investing $5B in Buffalo, creating 3,000 jobs". 23 September 2014. Archived from the original on 4 October 2014.
- ^ https://buffalonews.com/2019/11/08/pennies-on-the-dollar-the-tesla-plant-isnt-worth-nearly-what-the-state-paid-to-build-it/
- ^ "Environmental History Timeline". Archived from the original on 2012-07-26. Retrieved 2012-07-13.
- ^ The Power of Light: The Epic Story of Man's Quest to Harness the Sun, Frank Kryza, ISBN 9780071400213 p. 21
- ^ "Sun Power Operates Pumping Plant" Popular Mechanics, December 1911, pp. 843–44.
- ^ Kozlowski, Lori. "Solar Power: Karl Wolfgang Boer and a Lifetime of Green Discoveries". Los Angeles Times. Retrieved 1 October 2010.
- ^ "World's Largest Solar Thermal Plant Syncs to the Grid". IEEE Spectrum: Technology, Engineering, and Science News.
- ^ Jump up to: a b c "Solana, the largest parabolic trough plant in the world". Abengoa. Archived from the original on 2013-12-03. Retrieved 2013-11-26.
- ^ "solana - Diccionario Inglés-Español WordReference.com". www.wordreference.com.
- ^ "The World's Largest Power Plants". industcards. 2009-02-21. Retrieved 2009-05-26.
- ^ Mouawad, Jad (March 4, 2010). "The Newest Hybrid Model". The New York Times. Retrieved 2010-03-09.
- ^ "DOE Finalizes $737 Million Loan Guarantee to Tonopah Solar Energy for Nevada Project" (Press release). Loan Programs Office (LPO), Dept. of Energy (DOE). September 28, 2011. Archived from the original on 15 October 2011. Retrieved 29 September 2011.
- ^ National Renewable Energy Laboratory (November 10, 2015). "Crescent Dunes Solar Energy Project".
- ^ Will the BrightSource-Abengoa Tower Be the Last CSP Project in the US?, GreenTech Media, Eric Wesoff, September 22, 2014
- ^ Company To Withdraw Proposed Solar Tower Project in Inyo County, KCET, Chris Clarke, May 29, 2015
- ^ California rejects new plan for Palen solar farm, Sammy Roth, The Desert Sun, February 10, 2016
- ^ SEIA (Dec 2013). "U.S. Solar Market Insight Q4 2013". SEIA. Retrieved 2014-03-06.
- ^ EIA (1 March 2016). "Solar, natural gas, wind make up most 2016 generation additions". EIA. Retrieved 2016-03-02.
- ^ National Renewable Energy Laboratory (October 2010). "2009 U.S. State Clean Energy Data Book" (PDF). United States Department of Energy. Archived from the original (PDF) on 2011-10-17. Retrieved 2010-12-09.
- ^ Office of Energy Efficiency and Renewable Energy (September 2011). "2010 Renewable Energy Data Book" (PDF). United States Department of Energy. Archived from the original (PDF) on 2012-01-28. Retrieved 2012-02-11.
- ^ 2011 Renewable Energy Data Book p.64
- ^ Office of Energy Efficiency and Renewable Energy (November 2013). "2012 Renewable Energy Data Book" (PDF). United States Department of Energy. Retrieved 2013-12-04.
- ^ "Solar Market Insight Report 2014 Q4 - SEIA". SEIA.
- ^ U.S. Solar Market Sets New Record, Installing 7.3 GW of Solar PV in 2015 Retrieved 2 March 2016
- ^ "Database of State Incentives for Renewables and Efficiency". Dsireusa.org. Retrieved 2012-01-31.
- ^ "NC Clean Energy Technology Center - Advancing Clean Energy for a Sustainable Economy". www.ncsc.ncsu.edu.
- ^ Halper, Evan (9 August 2014). "Rules prevent solar panels in many states with abundant sunlight" – via LA Times.
- ^ Solar Investment Credit FINALLY Passed! Archived 2008-10-06 at the Wayback Machine retrieved 13 October 2008.
- ^ Federal Solar Tax Credits Archived 2008-10-08 at the Wayback Machine Retrieved 15 August 2008.
- ^ Residential Solar and Fuel Cell Tax Credit Retrieved 15 August 2008.
- ^ "Why the 1603 Treasury Grant Program Matters to Solar and RE".
- ^ "Residential Renewable Energy Tax Credit". Energy.gov. US Department of Energy. Retrieved April 29, 2016.
- ^ "Federal Income Tax Credits for Energy Efficiency". EnergyStar.gov. US EPA. Retrieved December 21, 2016.
- ^ "Solar Firms, Utilities Clash As 30% Tax Credit Fades". 8 October 2015.
- ^ "Forget Oil Exports—What Just Happened to Solar is a Really Big Deal". 17 December 2015 – via www.bloomberg.com.
- ^ "Overview and Status Update of the §1603 Program" (PDF). United States Department of the Treasury. 2016-05-05. Retrieved 2016-06-20.
- ^ "Hatch Continues Inquiry of Green Energy Programs". U.S. Senate Finance Committee. 2016-06-09. Retrieved 2016-06-20.
- ^ "DOE to Invest $17.6 Million in Six Early-Stage Photovoltaic Projects". Apps1.eere.energy.gov. Retrieved 2012-01-31.
- ^ "EERE: Solar Energy Technologies Program Home Page". .eere.energy.gov. Archived from the original on 2011-12-19. Retrieved 2012-01-31.
- ^ "SunShot Initiative".
- ^ Jump up to: a b c d Billions in U.S. solar projects shelved after Trump panel tariff. Reuters. June 7, 2018. Accessed April 22, 2019.
- ^ Jump up to: a b c "Trump tariffs are helping more than double U.S. solar capacity". Bloomberg (via the LA Times). May 30, 2018. Retrieved June 14, 2019.
- ^ Rogers, Kate (April 5, 2019). "After being rocked by Trump tariffs, the solar energy business is bouncing back". CNBC. Retrieved June 2, 2019.
- ^ Casey, Tina (June 9, 2019). "US Solar Cell Innovators Tackle US Manufacturing Challenges". Clean Technica. Retrieved June 13, 2019.
- ^ "San Francisco Offers Solar Subsidies". Greentechmedia.com. 2008-06-10. Retrieved 2012-01-31.
- ^ "Final changes and logistics of the SF Solar Incentive Program Explained". Sfsolarsubsidy.com. Retrieved 2012-01-31.
- ^ "San Francisco Requires New Buildings To Install Solar Panels".
- ^ Berkeley FIRST Archived 2013-06-02 at the Wayback Machine retrieved 25 June 2009
- ^ Loan Programs Archived 2010-06-16 at the Wayback Machine retrieved 19 December 2009
- ^ "Berkeley FIRST: Financing Initiative for Renewable and Solar Technology". City of Berkeley. Archived from the original on 2 June 2013. Retrieved 26 March 2013.
- ^ Residential Small Renewable Electrical Generation Systems Rebate, New Hampshire Public Utilities Commission.
- ^ "Tax Credit for Solar and Wind Energy Systems on Residential Property". Archived from the original on 2011-09-29.
- ^ "Tax Credit for Solar and Wind Energy Systems on Residential Property". Archived from the original on 2012-04-17.
- ^ "Solar Energy Sales Tax Exemption". DSIRE. NC Clean Energy Technology Center. Retrieved April 29, 2016.
- ^ "Property Tax Exemption for Renewable Energy Systems". DSIRE. NC Clean Energy Technology Center. Retrieved April 29, 2016.
- ^ "404". www.solarserver.com.
- ^ "Are Feed-in Tariffs a Possibility in California?". Renewableenergyaccess.com. Archived from the original on 2012-09-10. Retrieved 2012-01-31.
- ^ "California Approves Feed-In Tariffs, Rewards Energy Efficiency". Eere.energy.gov. 2012-01-25. Retrieved 2012-01-31.
- ^ "Washington State Passes Progressive Renewable Energy Legislation". Renewableenergyaccess.com. Archived from the original on 2007-02-13. Retrieved 2012-01-31.
- ^ "Hawaii FIT". Archived from the original on 2012-10-30. Retrieved 2012-08-13.
- ^ "Consumers Energy FIT". Archived from the original on 2012-10-30. Retrieved 2012-08-13.
- ^ "Vermont SPEED". Archived from the original on 2012-10-30. Retrieved 2012-08-13.
- ^ "Table of Financial Incentives". Archived from the original on 2013-01-19.
- ^ "FERC Decision Clears the Way for Multi-Tiered State FITs". Archived from the original on 2012-06-17. Retrieved 2012-07-31.
- ^ How to Design Feed-in Tariffs in the U.S. without Fear of Federal Preemption
- ^ Bird, Lori; Heeter, Jenny; Kreycik, Claire (November 2011). "Solar Renewable Energy Certificate (SREC) Markets: Status and Trends" (PDF). National Renewable Energy Laboratory. Retrieved 2011-12-23.
- ^ "MMA Renewable Ventures Solar Energy Program". Mmarenewableventures.com. Retrieved 2012-01-31.
- ^ "U.S. Retailers Save with Solar PV & Energy Efficiency". Renewableenergyaccess.com. Archived from the original on 2007-10-12. Retrieved 2012-01-31.
- ^ Guice, Jon; King, John D.H. "Solar Power Services: How PPAs are Changing the PV Value Chain". greentechmedia.com. Green Tech Media. executive report Archived 2012-04-25 at the Wayback Machine
- ^ "Power Purchase Agreement". Archived from the original on 2012-04-09. Retrieved 2012-07-31.
- ^ "Lancaster, CA, Becomes First US City to Require Solar". Greentech Media. March 27, 2013.
- ^ Berkeley FIRST Archived 2013-06-02 at the Wayback Machine. Retrieved October 14, 2010.
- ^ "Property Accessed Clean Energy" (PDF). Archived from the original (PDF) on 2012-10-19. Retrieved 2012-07-12.
- ^ "Bill Summary & Status".[permanent dead link]
- ^ "PACE Financing". Archived from the original on 2012-10-21. Retrieved 2012-08-14.
- ^ Jump up to: a b c d e "EIA - Electricity Data". www.eia.gov.
- ^ "2014 Renewable Energy Data Book" (PDF). November 2015. p. 29.
- ^ EIA (July 2015). "Electric Power Monthly". United States Department of Energy. Retrieved 2015-07-27.
Further reading[]
- GA Mansoori, N Enayati, LB Agyarko (2016), Energy: Sources, Utilization, Legislation, Sustainability, Illinois as Model State, World Sci. Pub. Co., ISBN 978-981-4704-00-7
- Clean Tech Nation: How the U.S. Can Lead in the New Global Economy (2012) by Ron Pernick and Clint Wilder
- Deploying Renewables 2011 (2011) by the International Energy Agency
- Reinventing Fire: Bold Business Solutions for the New Energy Era (2011) by Amory Lovins
- Renewable Energy Sources and Climate Change Mitigation (2011) by the IPCC
- Solar Energy Perspectives (2011) by the International Energy Agency
External links[]
| Wikimedia Commons has media related to Solar power in the United States. |
- "Solar Power by Region (US)".
- Solar panels on the White House.
- Study: Solar Power Could Provide 10% of U.S. Electricity by 2025
- Sensitivity of Utility-Scale Solar Deployment Projections in the Sunshot Vision Study to Market and Performance Assumptions National Renewable Energy Laboratory
- The Database of State Incentives for Renewable Energy (DSIRE)
- Live monitoring of over 1400 solar installations
- Bureau of Land Management 2012 Renewable Energy Priority Projects
- Maps of approved solar energy zones in USA, additional mapping
- United States cloud coverage
- IRS Form 5695 – Residential Energy Credits and instructions
- Solar maps: NREL annual and monthly (CSP and PV), U.S. installations
| show Renewable energy by country and territory |
|---|
| show Solar power in the Americas |
|---|

- Solar power in the United States