Elevation
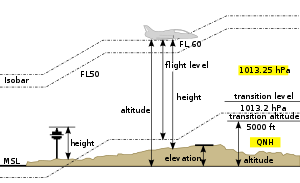
The elevation of a geographic location is its height above or below a fixed reference point, most commonly a reference geoid, a mathematical model of the Earth's sea level as an equipotential gravitational surface (see Geodetic datum § Vertical datum). The term elevation is mainly used when referring to points on the Earth's surface, while altitude or geopotential height is used for points above the surface, such as an aircraft in flight or a spacecraft in orbit, and depth is used for points below the surface.
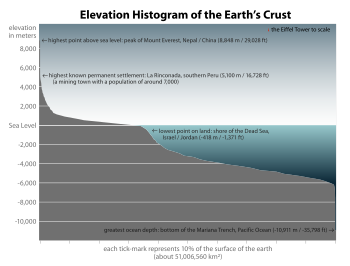
Elevation is not to be confused with the distance from the center of the Earth. Due to the equatorial bulge, the summits of Mount Everest and Chimborazo have, respectively, the largest elevation and the largest geocentric distance.

Aviation[]
In aviation the term elevation or aerodrome elevation is defined by the ICAO as the highest point of the landing area. It is measured in feet and can be found in approach charts of the aerodrome. It is not to be confused with terms such as the altitude or height.[1]
Maps and GIS[]


GIS or geographic information system is a computer system that allows for visualizing, manipulating, capturing, and storage of data with associated attributes. GIS offers better understanding of patterns and relationships of the landscape at different scales. Tools inside the GIS allow for manipulation of data for spatial analysis or cartography.

A topographical map is the main type of map used to depict elevation, often through use of contour lines. In a Geographic Information System (GIS), digital elevation models (DEM) are commonly used to represent the surface (topography) of a place, through a raster (grid) dataset of elevations. Digital terrain models are another way to represent terrain in GIS.
USGS (United States Geologic Survey) is developing a 3D Elevation Program (3DEP) to keep up with growing needs for high quality topographic data. 3DEP is a collection of enhanced elevation data in the form of high quality LiDAR data over the conterminous United States, Hawaii, and the U.S. territories. There are three bare earth DEM layers in 3DEP which are nationally seamless at the resolution of 1/3, 1, and 2 arcseconds.[2]
Global 1-kilometre map[]
This map is derived from GTOPO30 data that describes the elevation of Earth's terrain at intervals of 30 arcseconds (approximately 1 km). It uses hypsometric tints instead of contour lines to indicate elevation.

|

|

|

|

|

|

|

|

|

|

|

|

|

|

|

|

|

|

|

|

|

|

|

|

|

|

|

|

|

|

|

|

|

|

|

|

|

|

|

|

|

|

|

|

|

|

|

|

|

|

|

|

|

|

|

|

|

|

|

|

|

|

|

|

|

|

|

|

|

|

|

|
| Each tile is available at a resolution of 1800 × 1800 pixels (approximate file size 1 MB, 60 pixels = 1 degree, 1 pixel = 1 minute) | |||||||||||
See also[]
- Amsterdam Ordnance Datum, aka Normaal Amsterdams Peil (NAP), Dutch vertical datum
- Geodesy
- Height, general
- Hypsometric tints
- Lapse rate, or the adiabatic lapse rate
- List of European cities by elevation
- List of highest mountains on Earth
- List of highest towns by country
- List of the highest major summits of North America
- Normalhöhennull, German vertical datum, literally: standard elevation zero, (NHN)
- North American Vertical Datum of 1988, (NAVD 88)
- Sea Level Datum of 1929, a superseded United States vertical datum, (NGVD 29)
- Orthometric height
- Physical geography
- Topographic isolation
- Topographic prominence
- Topography
- Vertical pressure variation
References[]
- ^ AERODROMES (PDF). Montreal, Canada: International Civic Aviation Organisation. 1951. p. 9.
- ^ Survey, U.S. Geological. "The National Map: Elevation". nationalmap.gov. Retrieved 2017-02-24.
External links[]
| Look up elevation in Wiktionary, the free dictionary. |
- U.S. National Geodetic Survey website
- United States Geological Survey website
- Geographical Survey Institute
- Downloadable ETOPO2 Raw Data Database (2 minute grid)
- Downloadable ETOPO5 Raw Data Database (5 minute grid)
- Find the elevation of any place
| hide Authority control | |
|---|---|
| General | |
| Other | |
- Geodesy
- Topography
- Physical geography
- Surveying
- Mountaineering
- Vertical position