Energy intensity

Energy intensity is a measure of the energy inefficiency of an economy. It is calculated as units of energy per unit of GDP.
- High energy intensities indicate a high price or cost of converting energy into GDP.
- Low energy intensity indicates a lower price or cost of converting energy into GDP.
High energy intensity means high industrial output as portion of GDP. Countries with low energy intensity signifies labor intensive economy.
Overview[]
Many factors influence an economy's overall energy intensity. It may reflect requirements for general standards of living and weather conditions in an economy. It is not atypical for particularly cold or hot climates to require greater energy consumption in homes and workplaces for heating (furnaces, or electric heaters) or cooling (air conditioning, fans, refrigeration). A country with an advanced standard of living is more likely to have a wider prevalence of such consumer goods and thereby be impacted in its energy intensity than one with a lower standard of living.
Energy efficiency of appliances and buildings (through use of building materials and methods, such as insulation), fuel economy of vehicles, vehicular distances travelled (frequency of travel or larger geographical distances), better methods and patterns of transportation, capacities and utility of mass transit, energy rationing or conservation efforts, 'off-grid' energy sources, and stochastic economic shocks such as disruptions of energy due to natural disasters, wars, massive power outages, unexpected new sources, efficient uses of energy or energy subsidies may all impact overall energy intensity of a nation.
Thus, a nation that is highly economically productive, with mild and temperate weather, demographic patterns of work places close to home, and uses fuel efficient vehicles, supports carpools, mass transportation or walks or rides bicycles, will have a far lower energy intensity than a nation that is economically unproductive, with extreme weather conditions requiring heating or cooling, long commutes, and extensive use of generally poor fuel economy vehicles. Paradoxically, some activities that may seem to promote high energy intensities, such as long commutes, could in fact result in lower energy intensities by causing a disproportionate increase in GDP output.
Figures of energy consumption used in statistics are energy sources marketed through major energy industries. Therefore, some small scale but frequent consumption of energy source like firewood, charcoal peat, water wheel, wind mill are not in its count. In countries, which does not have such developed energy industries or people with highly self energy efficient life style, report smaller energy consumption figures.
Examples[]
- U.S. energy consumption from all sources in 2004 was estimated at 99.74 quad (105,210 PJ).[2] Total GDP that year was $11.75 trillion, with per-capita GDP at $40,100.[3] Using a population of 290,809,777,[4] this would produce an Energy Intensity of 8,553 BTU (9,024 kJ) per dollar.
Various nations have significantly higher or lower energy intensities.
- Bangladesh, with a population of 144 million and a GDP of $275.5 billion therefore has a GDP per capita of approximately $2,000. Its annual energy consumption was only 0.61 quad (0.64 EJ), making its Energy Intensity a mere 2,003 BTU (2,113 kJ) per dollar—a quarter of the US rate. Low standards of living and economic performance primarily accounts for such a meager number.
- Russia, with a population of 143 million and a GDP of $1.408 trillion therefore has a GDP per capita of approximately $9,800. Its annual energy consumption was 29.6 quad (31.2 EJ), for an Energy Intensity of 19,597 BTU (20,676 kJ) per dollar, or more than double that of the US. This may be due to harsh climatic conditions in most of Eastern Russia and the country's vast territorial space.
- Italy, with a population of 60 million and a GDP of $1.8 trillion therefore has a GDP per capita of approximately $31,000. Its annual Energy Intensity of 122.8 tons of oil equivalent makes it the most energy efficient country in the G8 and one of the most energy efficient in the industrial world, largely due to traditionally high energy prices which have resulted in more efficient company and consumer behaviours.
Of course, these numbers were produced with a mix of 2003 and 2004 figures, many of which are estimates. Actual mathematical models should use precise data of appropriate matching periods of study.
Several countries, like Sweden, Norway, France, and Canada, have made the transition to operating on low-carbon utilities. Norway and Canada have made the switch to hydro power; France relies on nuclear power. Since these countries have made the shift, they produce about a fifth of the carbon emissions in comparison to 13 other countries, like some including USA, Japan, and Italy.[5]
Economic energy efficiency[]

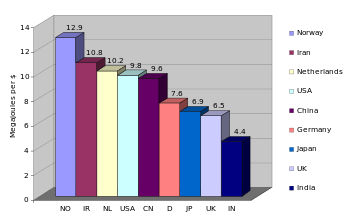
An inverse way of looking at the issue would be an 'economic energy efficiency,' or economic rate of return on its consumption of energy: how many economic units of GDP are produced by the consumption of units of energy.
- Referring to the above examples, 1 million Btus consumed with an energy intensity of 8,553 produced $116.92 of GDP for the US. Whereas, each million Btus of energy consumed in Bangladesh with an Energy Intensity of 2,113 produced $473 of GDP, or over four times the effective US rate. Russia, on the other hand, produced only $48.37 GDP per 1 million Btu based on an energy intensity of 20,676. Thus, Bangladesh could be perceived as having nearly ten times the economic energy efficiency of Russia.
It is not directly causal that a high GDP per capita must have lower economic energy efficiencies. See the accompanying chart for examples based on the top 40 national economies.
Energy intensity can be used as a comparative measure between countries; whereas the change in energy consumption required to raise GDP in a specific country over time is described as its energy elasticity.
See also[]
- Emission intensity
- Energy use intensity
- Energy intensity by country
- List of energy storage power plants
- Overillumination
- World energy supply and consumption
References[]
- ^ Energy Information Administration Archived 2007-02-06 at the Wayback Machine
- ^ (US DoE
- ^ CIA Factbook
- ^ US Census Bureau
- ^ Krackeler, Tom (Dec 1998). "Carbon dioxide emissions in OECD service sectors: the critical role of electricity use". Energy Policy. 26 (15): 1137–1152. doi:10.1016/S0301-4215(98)00055-X.
Energy intensity is a measure of energy efficiency of nation's GDP.
General reference[]
- Energy Intensity (UN Department of Economic and Social Affairs)
- Energy economics
- Economic indicators