World energy supply and consumption
World energy supply and consumption is global production and preparation of fuel, generation of electricity, energy transport and energy consumption. It is a basic part of economic activity. It does not include energy from food.
Many countries publish statistics on the energy supply and consumption of either their own country, of other countries of interest, or of all countries combined in one chart. One of the largest organizations in this field, the International Energy Agency (IEA), publishes yearly comprehensive energy data.[2] This collection of energy balances is very large. This article provides a brief description of energy supply and consumption, using statistics summarized in tables, of the countries and regions that produce and consume most.
Energy production is 80% fossil.[3] Half of that is produced by China, the United States and the Arab states of the Persian Gulf. The Gulf States and Russia export most of their production, largely to the European Union and China where not enough energy is produced to satisfy demand. Energy production increases slowly, except for solar and wind energy which grows more than 20% per year.
Produced energy, for instance crude oil, is processed to make it suitable for consumption by end users. The supply chain between production and final consumption involves many conversion activities and much trade and transport among countries, causing a loss of one quarter of energy before it is consumed.
Energy consumption per person in North America is very high while in developing countries it is low and more renewable.[2] There was a significant decline in energy usage worldwide caused by the COVID-19 pandemic, notably in the iron and steel industry as demand for new construction shrank. To reach levels similar to that in 2019, there would need to be an increase in the global demand for manufactured goods by the iron and steel industry.[4]
Worldwide carbon dioxide emissions from fossil fuels was 38 gigatons in 2019.[5] In view of contemporary energy policy of countries the IEA expects that worldwide energy consumption in 2040 will have increased more than a quarter and that the goal, set in the Paris Agreement to limit climate change, will not nearly be reached. Several scenarios to achieve the goal are developed.
Primary energy production[]
World total primary energy consumption by fuel in 2020[6]
This is the worldwide production of energy, extracted or captured directly from natural sources. In energy statistics primary energy (PE) refers to the first stage where energy enters the supply chain before any further conversion or transformation process.
Energy production is usually classified as:
- fossil, using coal, crude oil, and natural gas;
- nuclear, using uranium;
- renewable, using biomass, geothermal, hydropower, solar, tidal, wave, wind, and among others.
Primary energy assessment follows certain rules[note 1] to ease measurement of different kinds of energy. These rules are controversial. Water and air flow energy that drives hydro and wind turbines, and sunlight that powers solar panels, are not taken as PE, which is set at the electric energy produced. But fossil and nuclear energy are set at the reaction heat which is about 3 times the electric energy. This measurement difference can lead to underestimating the economic contribution of renewable energy.[7]
The table lists the worldwide PE and the countries/regions producing most (90%) of that. The amounts are rounded and given in million tonnes of oil equivalent per year (1 Mtoe = 11.63 TWh, 1 TWh = 109 kWh). The data[2] are of 2018.
| Total | Coal | Oil & Gas | Nuclear | Renewable | |
|---|---|---|---|---|---|
| China | 2560 | 1860 | 325 | 77 | 300 |
| United States | 2170 | 369 | 1400 | 219 | 180 |
| Middle East | 2040 | 1 | 2030 | 2 | 4 |
| Russia | 1484 | 240 | 1165 | 54 | 25 |
| Africa | 1169 | 157 | 611 | 3 | 397 |
| Europe | 1111 | 171 | 398 | 244 | 296 |
| India | 574 | 289 | 67 | 10 | 208 |
| Canada | 529 | 31 | 422 | 26 | 50 |
| Indonesia | 451 | 288 | 102 | 0 | 61 |
| Australia | 412 | 287 | 115 | 0 | 9 |
| Brazil | 296 | 2 | 160 | 4 | 129 |
| Kazakhstan | 178 | 49 | 128 | 0 | 1 |
| Mexico | 159 | 7 | 132 | 4 | 16 |
| World | 14420 | 3890 | 7850 | 707 | 1972 |
In the Middle East, the Persian Gulf states of Iran, Iraq, Kuwait, Oman, Qatar, Saudi Arabia, and the United Arab Emirates produced the most. A small part came from Bahrain, Jordan, Lebanon, Syria, and Yemen.
The top producers in Africa were Nigeria (256), South Africa (158), Algeria (156), and Angola (85).
In Europe, Norway (207, oil and gas), France (135, mainly nuclear), the United Kingdom (123), Germany (112), Poland (62, mainly coal), and the Netherlands (36, mainly natural gas) produced the most.
Of the world's renewable energy supply, 68% is generated with biofuel and waste, mostly in developing countries, 18% is generated with hydropower and 14% with other renewables.[8]
For more detailed energy production, see:
Energy conversion and trade[]
| Export minus Import[2] | |
|---|---|
| Mid-East | 1245 |
| Russia | 701 |
| Africa | 319 |
| Australia | 280 |
| Canada | 228 |
| Indonesia | 220 |
| Norway | 177 |
| United States | -80 |
| Korea | -252 |
| India | -347 |
| Japan | -387 |
| China | -733 |
| Europe | -985 |
Primary energy is converted in many ways to energy carriers, also known as secondary energy.[9]
- Coal mainly goes to thermal power stations. Coke is derived by destructive distillation of bituminous coal.
- Crude oil goes mainly to oil refineries
- Natural-gas goes to natural-gas processing plants to remove contaminants such as water, carbon dioxide and hydrogen sulfide, and to adjust the heating value. It is used as fuel gas, also in thermal power stations.
- Nuclear reaction heat is used in thermal power stations.
- Biomass is used directly or converted to biofuel.
2018 World electricity generation (26,700 TWh) by source (IEA, 2019)[10]
Electricity generators are driven by
- steam or gas turbines in a thermal plant,
- or water turbines in a hydropower station,
- or wind turbines, usually in a wind farm.
The invention of the solar cell in 1954 started electricity generation by solar panels, connected to a power inverter. Around 2000 mass production of panels made this economic.
Much primary and converted energy is traded among countries, about 5800 Mtoe worldwide, mostly oil and gas.
The table lists countries/regions with large difference of export and import.
A negative value indicates that much energy import is needed for the economy.
The quantities are expressed in Mtoe/a and the data are of 2018.[2]
Big transport goes by tanker ship, tank truck, LNG carrier, rail freight transport, pipeline and by electric power transmission.
Total Energy Supply[]
| Location | TES | PE |
|---|---|---|
| China | 3210 | 2560 |
| Europe | 1984 | 1111 |
| India | 919 | 574 |
| Mid-East | 760 | 2040 |
| Russia | 760 | 1484 |
| Japan | 426 | 50 |
| S-Korea | 282 | 45 |
| Canada | 298 | 529 |
| World | 14280 | 14420 |
Total Energy Supply (TES) indicates the sum of production and imports subtracting exports and storage changes.[11] For the whole world TES nearly equals primary energy PE because imports and exports cancel out, but for countries/regions TES and PE differ in quantity, and also in quality as secondary energy is involved, e.g., import of an oil refinery product. TES is all energy required to supply energy for end users. The table lists TES and PE for some countries/regions where these differ much, and worldwide. The amounts are rounded and given in Mtoe. The data are of 2018.
| Year | Total energy supply (TES)1 |
Final energy consumption1 |
Electricity generation |
Ref |
|---|---|---|---|---|
| 1973 | 71,013
(Mtoe 6,106) |
54,335
(Mtoe 4,672) |
6,129 | [12] |
| 1990 | 102,569 | – | 11,821 | – |
| 2000 | 117,687 | – | 15,395 | – |
| 2010 | 147,899
(Mtoe 12,717) |
100,914
(Mtoe 8,677) |
21,431 | [13] |
| 2011 | 152,504
(Mtoe 13,113) |
103,716
(Mtoe 8,918) |
22,126 | [14] |
| 2012 | 155,505
(Mtoe 13,371) |
104,426
(Mtoe 8,979) |
22,668 | [15] |
| 2013 | 157,482
(Mtoe 13,541) |
108,171
(Mtoe 9,301) |
23,322 | [16] |
| 2014 | 155,481
(Mtoe 13,369) |
109,613
(Mtoe 9,425) |
23,816 | [17] |
| 2015 | 158,715
(Mtoe 13,647) |
109,136
(Mtoe 9,384) |
[18][19] | |
| 2017 | 162,494
(Mtoe 13,972) |
113,009
(Mtoe 9,717) |
25,606 | [20] |
| 1 converted from Mtoe into TWh (1 Mtoe = 11.63 TWh) and from Quad BTU into TWh (1 Quad BTU = 293.07 TWh) | ||||
25% of worldwide primary production is used for conversion and transport, and 6% for non-energy products like lubricants, asphalt and petrochemicals. 69% remains for end-users. Most of the energy lost by conversion occurs in thermal electricity plants and the energy industry own use.
One needs to bear in mind that there are different qualities of energy. Heat, especially at a relatively low temperature, is low-quality energy, whereas electricity is high-quality energy. It takes around 3 kWh of heat to produce 1 kWh of electricity. But by the same token, a kilowatt-hour of this high-quality electricity can be used to pump several kilowatt-hours of heat into a building using a heat pump. And electricity can be used in many ways in which heat cannot. So the "loss" of energy incurred when generating electricity is not the same as a loss due to, say, resistance in power lines.
Final consumption[]
Total final consumption (TFC) is the worldwide consumption of energy by end-users (whereas primary energy consumption (Eurostat)[21] or total energy supply (IEA) is total energy demand and thus also includes what the energy sector uses itself and transformation and distribution losses). This energy consists of fuel (78%) and electricity (22%). The tables list amounts, expressed in million tonnes of oil equivalent per year (1 Mtoe = 11.63 TWh) and how much of these is renewable energy. Non-energy products are not considered here. The data are of 2018.[2][22]
Fuel:
- fossil: natural gas, fuel derived from petroleum (LPG, gasoline, kerosene, gas/diesel, fuel oil), from coal (anthracite, bituminous coal, coke, blast furnace gas).
- renewable: biofuel and fuel derived from waste.
- for District heating.
The amounts are based on lower heating value.
The first table lists final consumption in the countries/regions which use most (85%), and per person. In developing countries fuel consumption per person is low and more renewable. Canada, Venezuela and Brazil generate most electricity with hydropower.
| Fuel Mtoe |
of which renewable |
Electricity Mtoe |
of which renewable |
TFC pp toe | |
|---|---|---|---|---|---|
| China | 1436 | 6% | 555 | 30% | 1.4 |
| United States | 1106 | 8% | 339 | 19% | 4.4 |
| Europe | 982 | 11% | 309 | 39% | 2.5 |
| Africa | 531 | 58% | 57 | 23% | 0.5 |
| India | 487 | 32% | 104 | 25% | 0.4 |
| Russia | 369 | 1% | 65 | 26% | 3.0 |
| Japan | 201 | 3% | 81 | 19% | 2.2 |
| Brazil | 166 | 38% | 45 | 78% | 1.0 |
| Indonesia | 126 | 21% | 22 | 14% | 0.6 |
| Canada | 139 | 8% | 45 | 83% | 5.0 |
| Iran | 147 | 0% | 22 | 6% | 2.1 |
| Mexico | 95 | 7% | 25 | 18% | 1.0 |
| S-Korea | 85 | 5% | 46 | 5% | 2.6 |
| Australia | 60 | 7% | 18 | 21% | 3.2 |
| Argentina | 42 | 7% | 11 | 27% | 1.2 |
| Venezuela | 20 | 3% | 6 | 88% | 0.9 |
| World | 7050 | 14% | 1970 | 30% | 1.2 |
In Africa 32 of the 48 nations are declared to be in an energy crisis by the World Bank. See Energy in Africa.
The next table shows countries consuming most (85%) in Europe.
| Country | Fuel Mtoe |
of which renewable |
Electricity Mtoe |
of which renewable |
|---|---|---|---|---|
| Germany | 156 | 10% | 45 | 46% |
| France | 100 | 12% | 38 | 21% |
| United Kingdom | 95 | 5% | 26 | 40% |
| Italy | 87 | 9% | 25 | 39% |
| Spain | 60 | 10% | 21 | 43% |
| Poland | 58 | 12% | 12 | 16% |
| Ukraine | 38 | 5% | 10 | 12% |
| Netherlands | 36 | 4% | 9 | 16% |
| Belgium | 26 | 8% | 7 | 23% |
| Sweden | 20 | 35% | 11 | 72% |
| Austria | 20 | 19% | 5 | 86% |
| Romania | 19 | 20% | 4 | 57% |
| Finland | 18 | 34% | 7 | 39% |
| Portugal | 11 | 20% | 4 | 67% |
| Denmark | 11 | 15% | 3 | 71% |
| Norway | 8 | 16% | 10 | 100% |
Trend[]
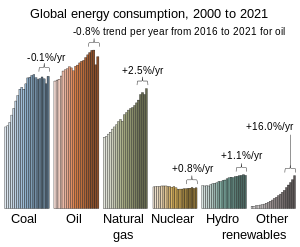
In the period 2005–2017 worldwide final consumption[2] of
- coal increased 23%,
- oil and gas increased 18%,
- electricity increased 41%.
Energy for energy[]
Some fuel and electricity is used to construct, maintain and demolish/recycle installations that produce fuel and electricity, such as oil platforms, uranium isotope separators and wind turbines. For these producers to be economic the ratio of energy returned on energy invested (EROEI) or energy return on investment (EROI) should be large enough.
If the final energy delivered for consumption is E and the EROI equals R, then the net energy available is E-E/R. The percentage available energy is 100-100/R. For R>10 more than 90% is available but for R=2 only 50% and for R=1 none. This steep decline is known as the net energy cliff.[24]
Outlook[]
IEA scenarios[]
In World Energy Outlook 2021 (WEO) the IEA presents four scenarios [25]p.27 based on the computer Model for the Assessment of Greenhouse Gas Induced Climate Change (MAGICC).[26] Net Zero by 2050 (NZE)[27] is an integral part of the WEO.
In Stated Policies Scenario (STEPS) IEA assesses the likely effects of 2021 policy settings. This would lead to global average temperatures still rising when they hit 2.6 °C above pre-industrial levels in 2100.[25]p.16
The Announced Pledges Scenario (APS) assumes that all climate commitments will be met in full and on time. Average temperature will rise to around 2.1 °C by 2100 and continues to increase.[25]Fig.1.5
The Sustainable Development Scenario (SDS) assumes in addition to APS a surge in clean energy policies and investment. Advanced economies reach net zero emissions by 2050, China around 2060, and all other countries by 2070 at the latest. Then temperature will peak at 1.7 °C by 2050 and could decline to 1.5 °C by 2100.[25]p.95, Fig.1.5 In 2050 energy supply will be 55% renewable.[25] Table A.5, A.6 Electricity generation will be 58% renewable and 8% nuclear.[25] Table A.15, A.16, A19
The Net Zero Emissions by 2050 Scenario (NZE) reaches global net zero CO2 emissions by 2050. Temperature will peak at 1.7 °C by 2050 and decline to 1.4 °C by 2100.[25]Fig.1.4,1.5 In 2050 half of energy consumption will be electricity, generated for nearly 70% by wind and solar PV, about 20% with other renewable sources and most of the remainder from nuclear power. The other half is biomass, gas and oil with CCS (carbon capture and storage) or non-energetic (asphalt, petrochemicals).[27]: 18, 19, Fig. 2.9 Use of coal falls 90%, oil 75% and gas 55%.[27]: Fig. 3.2 Emission by the transport sector drops 90%, the remainder mainly caused by heavy trucks, shipping and aviation.[27]: 131, 132
Investing in new fossil fuels is no longer necessary now (2021).[27]: 21 Annual energy investment is expected to increase from just over $ 2 trillion worldwide on average over the past five years to nearly $ 5 trillion by 2030 and to $ 4.5 trillion by 2050. The bulk will be spent on generating, storing, and distributing electricity, and electrical end-user equipment (heat pumps, vehicles).[27]: 81
Alternative scenarios[]
Alternative Achieving the Paris Climate Agreement Goals scenarios are developed by a team of 20 scientists at the University of Technology of Sydney, the German Aerospace Center, and the University of Melbourne, using IEA data but proposing transition to nearly 100% renewables by mid-century, along with steps such as reforestation. Nuclear power and carbon capture are excluded in these scenarios.[28] The researchers say the costs will be far less than the $5 trillion per year governments currently spend subsidizing the fossil fuel industries responsible for climate change (page ix).
In the +2.0 C (global warming) Scenario total primary energy demand in 2040 can be 450 EJ = 10755 Mtoe, or 400 EJ = 9560 Mtoe in the +1.5 Scenario, well below the current production. Renewable sources can increase their share to 300 EJ in the +2.0 C Scenario or 330 PJ in the +1.5 Scenario in 2040. In 2050 renewables can cover nearly all energy demand. Non-energy consumption will still include fossil fuels. See Fig.5 on p.xxvii.
Global electricity generation from renewable energy sources will reach 88% by 2040 and 100% by 2050 in the alternative scenarios. "New" renewables — mainly wind, solar and geothermal energy — will contribute 83% of the total electricity generated (p.xxiv). The average annual investment required between 2015 and 2050, including costs for additional power plants to produce hydrogen and synthetic fuels and for plant replacement, will be around $1.4 trillion (p.182).
Shifts from domestic aviation to rail and from road to rail are needed. Passenger car use must decrease in the OECD countries (but increase in developing world regions) after 2020. The passenger car use decline will be partly compensated by strong increase in public transport rail and bus systems. See Fig.4 on p.xxii.
CO2 emission can reduce from 32 Gt in 2015 to 7 Gt (+2.0 Scenario) or 2.7 Gt (+1.5 Scenario) in 2040, and to zero in 2050 (p.xxviii).
See also[]
- Climate change
- Energy industry
- For history, see articles on the control of fire, extraction of coal and oil, use of wind- and watermills and sailing ships.
- A Cubic Mile of Oil
- Domestic energy consumption
- Earth's energy budget
- Electric energy consumption
- Energy demand management
- Energy development
- Energy intensity
- Energy policy
- Energy security and renewable technology
- Environmental effects of aviation
- Kardashev scale
- Life-cycle greenhouse gas emissions of energy sources
- Peak oil
- Renewable energy
- Renewable energy commercialization
- Sustainable energy
- World Energy Outlook
- World energy resources
- Lists
- Energy intensity by country
- List of countries by carbon dioxide emissions
- List of countries by electricity consumption
- List of countries by electricity production
- List of countries by energy consumption per capita
- List of countries by greenhouse gas emissions
- List of countries by renewable electricity production
- List of countries by total primary energy consumption and production
- List of renewable energy topics by country and territory
Notes[]
- ^
Primary energy assessment:
- Fossil: based on lower heating value.
- Nuclear: heat produced by nuclear reactions, 3 times the electric energy, based on 33% efficiency of nuclear plants.
- Renewable:
- Biomass based on lower heating value.
- Electric energy produced by hydropower, wind turbines and solar panels.
- Geothermal power is set at more than 10 times the electric energy due to the very low efficiency of these plants.
References[]
- ^ Jackson et al.: Persistent fossil fuel growth threatens the Paris Agreement and planetary health. Environmental Research Letters (14), 2019.
- ^ a b c d e f g h i https://www.iea.org/data-and-statistics/data-tables?country=WORLD&energy=Balances&year=2018 Archived 6 August 2021 at the Wayback Machine Select country/region
- ^ "World Energy Balances – Analysis". IEA. Archived from the original on 1 June 2021. Retrieved 10 June 2021.
- ^ https://www.dnv.com/energy-transition/impact-of-covid19-on-the-energy-transition.html. Archived from the original on 8 November 2021. Retrieved 8 November 2021.
{{cite web}}: Missing or empty|title=(help) - ^ "EDGAR - The Emissions Database for Global Atmospheric Research". edgar.jrc.ec.europa.eu. Archived from the original on 31 May 2021. Retrieved 9 June 2021.
- ^ "Statistical Review of World Energy (2021)" (PDF). p. 13. Archived (PDF) from the original on 15 August 2021. Retrieved 19 August 2021.
- ^ Sauar, Erik (31 August 2017). "IEA underreports contribution solar and wind by a factor of three compared to fossil fuels". energypost.eu. Energy Post. Archived from the original on 22 April 2018. Retrieved 22 April 2018.
- ^ "Renewables Information 2019: Overview". Archived from the original on 4 February 2020. Retrieved 8 June 2021.
- ^ Encyclopaedia Britannica, vol.18, Energy Conversion, 15th ed., 1992
- ^ "IEA Website". Archived from the original on 7 June 2021. Retrieved 6 June 2021.
- ^ https://unstats.un.org/unsd/energystats/methodology/documents/IRES-web.pdf p.105
- ^ "Key world energy statistics" (PDF). IEA. 2015. Retrieved 6 April 2017.
- ^ "2012 Key World Energy Statistics" (PDF). www.iea.org. IEA. 2012. pp. 6, 24, 28. Archived (PDF) from the original on 3 July 2015.
- ^ "2013 Key World Energy Statistics" (PDF). www.iea.org. IEA. 2013. pp. 6, 24, 26, 28. Archived from the original (PDF) on 6 July 2019. Retrieved 1 July 2015.
- ^ "2014 Key World Energy Statistics" (PDF). www.iea.org. IEA. 2014. pp. 6, 38. Archived (PDF) from the original on 5 April 2015.
- ^ "Key World Energy Statistics" (PDF). 28 May 2017. pp. 27, 37.
- ^ "Key World Energy Statistics" (PDF). IEA. 28 May 2017. p. 38. Archived (PDF) from the original on 13 October 2017. Retrieved 29 May 2017.
- ^ "Key World Energy Statistics" (PDF). IEA. September 2017. p. 7 (TPES), 36 (TFC, total final consumption). Archived (PDF) from the original on 21 October 2014. Retrieved 5 September 2018.
- ^ "International Energy Outlook 2017" (PDF). EIA. 14 September 2017. p. 10.
- ^ a b "Key World Energy Statistics 2019". International Energy Agency. 26 September 2019. pp. 6, 36. Archived from the original on 31 December 2019. Retrieved 7 December 2019.
- ^ "Energy consumption in 2018" (PDF). Eurostat. Archived (PDF) from the original on 10 June 2021. Retrieved 10 June 2021.
- ^ "Data tables – Data & Statistics". Archived from the original on 3 February 2021. Retrieved 8 June 2021.
- ^ "Data tables – Data & Statistics". Archived from the original on 3 February 2021. Retrieved 8 June 2021.
- ^ Brockway, Paul E.; Owen, Anne; Brand-Correa, Lina I.; Hardt, Lukas (2019). "Estimation of global final-stage energy-return-on-investment for fossil fuels with comparison to renewable energy sources". Nature Energy. 4 (7): 612–621. doi:10.1038/s41560-019-0425-z. S2CID 197402845. Archived from the original on 12 June 2021. Retrieved 13 June 2021.
- ^ a b c d e f g "Archived copy". Archived from the original on 14 October 2021. Retrieved 14 October 2021.
{{cite web}}: CS1 maint: archived copy as title (link) - ^ "Archived copy". Archived from the original on 20 October 2021. Retrieved 14 October 2021.
{{cite web}}: CS1 maint: archived copy as title (link) - ^ a b c d e f Net Zero by 2050 (PDF) (Report). International Energy Agency. May 2021. Archived (PDF) from the original on 23 May 2021. Retrieved 8 June 2021.
- ^ Teske, Sven, ed. (2019). Achieving the Paris Climate Agreement Goals: Global and Regional 100% Renewable Energy Scenarios with Non-energy GHG Pathways for +1.5°C and +2°C. Springer International Publishing. p. 3. doi:10.1007/978-3-030-05843-2. ISBN 9783030058425. Archived from the original on 15 April 2021. Retrieved 8 June 2021.
Further reading[]
- Jacobson, Mark Z; Delucchi, Mark A; Cameron, Mary A; Mathiesen, Brian V (2018). "Matching demand with supply at low cost in 139 countries among 20 world regions with 100% intermittent wind, water, and sunlight (WWS) for all purposes". Renewable Energy. 123: 236–248. doi:10.1016/j.renene.2018.02.009.
External links[]
- World Energy Outlook from the IEA
- Energy.gov
- International Energy Outlook, by the U.S. Energy Information Administration
- Energy policy
- Energy economics
- Energy by region
- Energy consumption
- Human ecology
- Global environmental issues
- World
- Energy production