Solar power

| Part of a series on |
| Sustainable energy |
|---|
 |
|
Solar power is the conversion of energy from sunlight into electricity, either directly using photovoltaics (PV), indirectly using concentrated solar power, or a combination. Concentrated solar power systems use lenses or mirrors and solar tracking systems to focus a large area of sunlight into a small beam. Photovoltaic cells convert light into an electric current using the photovoltaic effect.[1]
Photovoltaics were initially solely used as a source of electricity for small and medium-sized applications, from the calculator powered by a single solar cell to remote homes powered by an off-grid rooftop PV system. Commercial concentrated solar power plants were first developed in the 1980s. As the cost of solar electricity has fallen, the number of grid-connected solar PV systems has grown into the millions and gigawatt-scale photovoltaic power stations are being built. Solar PV is rapidly becoming an inexpensive, low-carbon technology to harness renewable energy from the Sun.
The International Energy Agency said in 2021 that under its "Net Zero by 2050" scenario solar power would contribute about 20% of worldwide energy consumption, and solar would be the world's largest source of electricity.[2] China has the most solar installations. In 2020, solar power generated 3.5% of the world's electricity, compared to under 3% the previous year.[3] In 2020 the unsubsidised levelised cost of electricity for utility-scale solar power was around $36/MWh,[4] and installation cost about a dollar per DC watt.[5]
Mainstream technologies
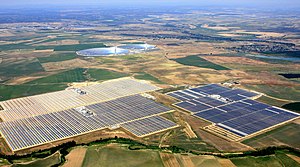
Many industrialized nations have installed significant solar power capacity into their grids to supplement or provide an alternative to conventional energy sources while an increasing number of less developed nations have turned to solar to reduce dependence on expensive imported fuels (see solar power by country). Long distance transmission allows remote renewable energy resources to displace fossil fuel consumption. Solar power plants use one of two technologies:
- Photovoltaic (PV) systems use solar panels, either on rooftops or in ground-mounted solar farms, converting sunlight directly into electric power.
- Concentrated solar power (CSP, also known as "concentrated solar thermal") plants use solar thermal energy to make steam, which is thereafter converted into electricity by a turbine.
Photovoltaic cells

A solar cell, or photovoltaic cell (PV), is a device that converts light into electric current using the photovoltaic effect. The first solar cell was constructed by Charles Fritts in the 1880s.[7] The German industrialist Ernst Werner von Siemens was among those who recognized the importance of this discovery.[8] In 1931, the German engineer Bruno Lange developed a photo cell using silver selenide in place of copper oxide,[9] although the prototype selenium cells converted less than 1% of incident light into electricity. Following the work of Russell Ohl in the 1940s, researchers Gerald Pearson, Calvin Fuller and Daryl Chapin created the silicon solar cell in 1954.[10] These early solar cells cost US$286/watt and reached efficiencies of 4.5–6%.[11] In 1957, Mohamed M. Atalla developed the process of silicon surface passivation by thermal oxidation at Bell Labs.[12][13] The surface passivation process has since been critical to solar cell efficiency.[14]
The array of a photovoltaic power system, or PV system, produces direct current (DC) power which fluctuates with the sunlight's intensity. For practical use this usually requires conversion to certain desired voltages or alternating current (AC), through the use of inverters.[6] Multiple solar cells are connected inside modules. Modules are wired together to form arrays, then tied to an inverter, which produces power at the desired voltage, and for AC, the desired frequency/phase.[6]
Many residential PV systems are connected to the grid wherever available, especially in developed countries with large markets.[15] In these grid-connected PV systems, use of energy storage is optional. In certain applications such as satellites, lighthouses, or in developing countries, batteries or additional power generators are often added as back-ups. Such stand-alone power systems permit operations at night and at other times of limited sunlight.
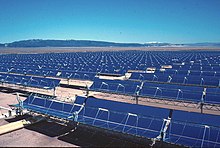
Concentrated solar power

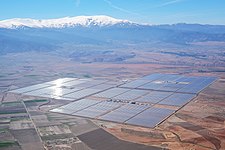
Concentrated solar power (CSP), also called "concentrated solar thermal", uses lenses or mirrors and tracking systems to concentrate sunlight, then use the resulting heat to generate electricity from conventional steam-driven turbines.[16]
A wide range of concentrating technologies exists: among the best known are the parabolic trough, the compact linear Fresnel reflector, the dish Stirling and the solar power tower. Various techniques are used to track the sun and focus light. In all of these systems a working fluid is heated by the concentrated sunlight, and is then used for power generation or energy storage.[17] Thermal storage efficiently allows up to 24-hour electricity generation.[18]
A parabolic trough consists of a linear parabolic reflector that concentrates light onto a receiver positioned along the reflector's focal line. The receiver is a tube positioned along the focal points of the linear parabolic mirror and is filled with a working fluid. The reflector is made to follow the sun during daylight hours by tracking along a single axis. Parabolic trough systems provide the best land-use factor of any solar technology.[19] The Solar Energy Generating Systems plants in California and Acciona's Nevada Solar One near Boulder City, Nevada are representatives of this technology.[20][21]
Compact Linear Fresnel Reflectors are CSP-plants which use many thin mirror strips instead of parabolic mirrors to concentrate sunlight onto two tubes with working fluid. This has the advantage that flat mirrors can be used which are much cheaper than parabolic mirrors, and that more reflectors can be placed in the same amount of space, allowing more of the available sunlight to be used. Concentrating linear fresnel reflectors can be used in either large or more compact plants.[22][23]
The Stirling solar dish combines a parabolic concentrating dish with a Stirling engine which normally drives an electric generator. The advantages of Stirling solar over photovoltaic cells are higher efficiency of converting sunlight into electricity and longer lifetime. Parabolic dish systems give the highest efficiency among CSP technologies.[24] The 50 kW Big Dish in Canberra, Australia is an example of this technology.[20]
A solar power tower uses an array of tracking reflectors (heliostats) to concentrate light on a central receiver atop a tower. Power towers can achieve higher (thermal-to-electricity conversion) efficiency than linear tracking CSP schemes and better energy storage capability than dish stirling technologies.[20] The PS10 Solar Power Plant and PS20 solar power plant are examples of this technology.
Hybrid systems
A hybrid system combines (C)PV and CSP with one another or with other forms of generation such as diesel, wind and biogas. The combined form of generation may enable the system to modulate power output as a function of demand or at least reduce the fluctuating nature of solar power and the consumption of non-renewable fuel. Hybrid systems are most often found on islands.
- CPV/CSP system
- A novel solar CPV/CSP hybrid system has been proposed, combining concentrator photovoltaics with the non-PV technology of concentrated solar power, or also known as concentrated solar thermal.[25]
- Integrated solar combined cycle (ISCC) system
- The Hassi R'Mel power station in Algeria is an example of combining CSP with a gas turbine, where a 25-megawatt CSP-parabolic trough array supplements a much larger 130 MW combined cycle gas turbine plant. Another example is the Yazd power station in Iran.
- Photovoltaic thermal hybrid solar collector (PVT)
- Also known as hybrid PV/T, convert solar radiation into thermal and electrical energy. Such a system combines a solar (PV) module with a solar thermal collector in a complementary way.
- Concentrated photovoltaics and thermal (CPVT)
- A concentrated photovoltaic thermal hybrid system is similar to a PVT system. It uses concentrated photovoltaics (CPV) instead of conventional PV technology, and combines it with a solar thermal collector.
- PV diesel system
- It combines a photovoltaic system with a diesel generator.[26] Combinations with other renewables are possible and include wind turbines.[27]
- PV-thermoelectric system
- Thermoelectric, or "thermovoltaic" devices convert a temperature difference between dissimilar materials into an electric current. Solar cells use only the high frequency part of the radiation, while the low frequency heat energy is wasted. Several patents about the use of thermoelectric devices in tandem with solar cells have been filed.[28]
The idea is to increase the efficiency of the combined solar/thermoelectric system to convert the solar radiation into useful electricity.
Solar heating
Solar power is also used directly by utilizing solar thermal collectors for heating applications. Typical architectural applications is for space heating, but applications also exist for process heating, cooking, and for other applications where temperature is required.
Development and deployment


Solar PV CSP - Solar thermal

World electricity generation by source in 2018. Total generation was 26.7 PWh.[31]
| Solar Electricity Generation | ||
|---|---|---|
| Year | Energy (TWh) | % of Total |
| 2004 | 2.6 | 0.01% |
| 2005 | 3.7 | 0.02% |
| 2006 | 5.0 | 0.03% |
| 2007 | 6.8 | 0.03% |
| 2008 | 11.4 | 0.06% |
| 2009 | 19.3 | 0.10% |
| 2010 | 31.4 | 0.15% |
| 2011 | 60.6 | 0.27% |
| 2012 | 96.7 | 0.43% |
| 2013 | 134.5 | 0.58% |
| 2014 | 185.9 | 0.79% |
| 2015 | 253.0 | 1.05% |
| 2016 | 328.2 | 1.31% |
| 2017 | 442.6 | 1.73% |
| 2019 | 724.1 | 2.68% |
| Sources:[32][33][34][35][36] | ||
Early days
The early development of solar technologies starting in the 1860s was driven by an expectation that coal would soon become scarce, such as experiments by Augustin Mouchot.[37] Charles Fritts installed the world's first rooftop photovoltaic solar array, using 1%-efficient selenium cells, on a New York City roof in 1884.[38] However, development of solar technologies stagnated in the early 20th century in the face of the increasing availability, economy, and utility of coal and petroleum.[39] In 1974 it was estimated that only six private homes in all of North America were entirely heated or cooled by functional solar power systems.[40] The 1973 oil embargo and 1979 energy crisis caused a reorganization of energy policies around the world and brought renewed attention to developing solar technologies.[41][42] Deployment strategies focused on incentive programs such as the Federal Photovoltaic Utilization Program in the US and the Sunshine Program in Japan. Other efforts included the formation of research facilities in the United States (SERI, now NREL), Japan (NEDO), and Germany (Fraunhofer ISE).[43] Between 1970 and 1983 installations of photovoltaic systems grew rapidly, but falling oil prices in the early 1980s moderated the growth of photovoltaics from 1984 to 1996.
Mid-1990s to early 2010s
In the mid-1990s development of both, residential and commercial rooftop solar as well as utility-scale photovoltaic power stations began to accelerate again due to supply issues with oil and natural gas, global warming concerns, and the improving economic position of PV relative to other energy technologies.[44] In the early 2000s, the adoption of feed-in tariffs—a policy mechanism, that gives renewables priority on the grid and defines a fixed price for the generated electricity—led to a high level of investment security and to a soaring number of PV deployments in Europe.
Current status
This section needs to be updated. (August 2021) |
For several years, worldwide growth of solar PV was driven by European deployment, but has since shifted to Asia, especially China and Japan, and to a growing number of countries and regions all over the world, including, but not limited to, Australia, Canada, Chile, India, Israel, Mexico, South Africa, South Korea, Thailand, and the United States. In 2012, Tokelau became the first country to be powered entirely by photovoltaic cells, with a 1 MW system using batteries for nighttime power.[45]
Worldwide growth of photovoltaics has averaged 40% per year from 2000 to 2013[46] and total installed capacity reached 303 GW at the end of 2016 with China having the most cumulative installations (78 GW)[47] and Honduras having the highest theoretical percentage of annual electricity usage which could be generated by solar PV (12.5%).[47][46] The largest manufacturers are located in China.[48][49]
Concentrated solar power (CSP) also started to grow rapidly, increasing its capacity nearly tenfold from 2004 to 2013, albeit from a lower level and involving fewer countries than solar PV.[50]: 51 As of the end of 2013, worldwide cumulative CSP-capacity reached 3,425 MW.
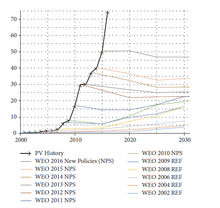
Forecasts
This section needs to be updated. (August 2021) |
In 2010, the International Energy Agency predicted that global solar PV capacity could reach 3,000 GW or 11% of projected global electricity generation by 2050—enough to generate 4,500 TWh of electricity.[51] Four years later, in 2014, the agency projected that, under its "high renewables" scenario, solar power could supply 27% of global electricity generation by 2050 (16% from PV and 11% from CSP).[52]
According to a 2021 study global electricity generation potential of rooftop solar panels is estimated at 27 PWh per year at cost ranging from $40 (Asia) to $240 per MWh (US, Europe). Its practical realization will however depend on the availability and cost of scalable electricity storage solutions.[53]
Photovoltaic power stations
This section needs to be updated. (August 2021) |
The Desert Sunlight Solar Farm is a 550 MW power plant in Riverside County, California, that uses thin-film CdTe solar modules made by First Solar.[54] As of November 2014, the 550 megawatt Topaz Solar Farm was the largest photovoltaic power plant in the world. This was surpassed by the 579 MW Solar Star complex. The current largest photovoltaic power station in the world is the Pavagada Solar Park, Karnataka, India with a generation capacity of 2050 MW.[55]
| Name | Country | Capacity MWp |
Generation GWh p.a. |
Size km2 |
Year | Ref |
|---|---|---|---|---|---|---|
| Pavagada Solar Park | India | 2,050 | 53 | 2017 | [55][56][57] | |
| Tengger Desert Solar Park | China | 1,547 | 43 | 2016 | [58][59] | |
| Bhadla Solar Park | India | 1,515 | 40 | 2017 | [60][61][62] | |
| Kurnool Ultra Mega Solar Park | India | 1,000 | 24 | 2017 | [63] | |
| China | 1,000 | 2016 | [64][65][66] | |||
| Longyangxia Dam Solar Park | China | 850 | 23 | 2015 | [67][68][69][70] | |
| Rewa Ultra Mega Solar | India | 750 | 2018 | [71] | ||
| Kamuthi Solar Power Project | India | 648 | 10.1 | 2016 | [72][73] | |
| Solar Star (I and II) | United States | 579 | 1,664 | 13 | 2015 | [74][75] |
| Topaz Solar Farm | United States | 550 | 1,301 | 24.6[76] | 2014 | [77][78][79] |
Concentrating solar power stations

Commercial concentrating solar power (CSP) plants, also called "solar thermal power stations", were first developed in the 1980s. The 377 MW Ivanpah Solar Power Facility, located in California's Mojave Desert, is the world's largest solar thermal power plant project. Other large CSP plants include the Solnova Solar Power Station (150 MW), the Andasol solar power station (150 MW), and Extresol Solar Power Station (150 MW), all in Spain. The principal advantage of CSP is the ability to efficiently add thermal storage, allowing the dispatching of electricity over up to a 24-hour period. Since peak electricity demand typically occurs at about 5 pm, many CSP power plants use 3 to 5 hours of thermal storage.[80]
| Name | Capacity (MW) |
Location | Notes |
|---|---|---|---|
| Ivanpah Solar Power Facility | 392 | Mojave Desert, California, USA | Operational since February 2014. Located southwest of Las Vegas. |
| Solar Energy Generating Systems | 354 | Mojave Desert, California, USA | Commissioned between 1984 and 1991. Collection of 9 units. |
| Mojave Solar Project | 280 | Barstow, California, USA | Completed December 2014 |
| Solana Generating Station | 280 | Gila Bend, Arizona, USA | Completed October 2013 Includes a 6h thermal energy storage |
| Genesis Solar Energy Project | 250 | Blythe, California, USA | Completed April 2014 |
| [81] | 200 | Logrosán, Spain | Completed 2012–2013[82] |
| Noor I | 160 | Morocco | Completed 2016 |
| Solnova Solar Power Station | 150 | Seville, Spain | Completed in 2010 |
| Andasol solar power station | 150 | Granada, Spain | Completed 2011. Includes a 7.5h thermal energy storage. |
| Extresol Solar Power Station | 150 | Torre de Miguel Sesmero, Spain | Completed 2010–2012 Extresol 3 includes a 7.5h thermal energy storage |
| For a more detailed, sourced and complete list, see: List of solar thermal power stations#Operational or corresponding article. | |||
Economics
Cost per watt


The typical cost factors for solar power include the costs of the modules, the frame to hold them, wiring, inverters, labour cost, any land that might be required, the grid connection, maintenance and the solar insolation that location will receive.
Photovoltaic systems use no fuel, and modules typically last 25 to 40 years. Thus, capital costs make up most of the cost of solar power. Operations and maintenance costs for new utility-scale solar plants in the US are estimated to be 9 percent of the cost of photovoltaic electricity, and 17 percent of the cost of solar thermal electricity.[84] Governments have created various financial incentives to encourage the use of solar power, such as feed-in tariff programs. Also, Renewable portfolio standards impose a government mandate that utilities generate or acquire a certain percentage of renewable power regardless of increased energy procurement costs.
Current installation prices
| Country | Cost ($/W) | Year and references |
|---|---|---|
| Australia | 2.0 | 2013[52]: 15 |
| China | 1.4 | 2013[52]: 15 |
| France | 2.2 | 2013[52]: 15 |
| Germany | 1.4 | 2013[52]: 15 |
| Italy | 1.5 | 2013[52]: 15 |
| Japan | 2.9 | 2013[52]: 15 |
| United Kingdom | 1.9 | 2013[52]: 15 |
| United States | 0.70 | 2020[85] |
In 2021 in the US, residential solar cost from 2 to 4 dollars/watt (but solar shingles cost much more)[86] and utility solar costs were around $1/watt.[87]
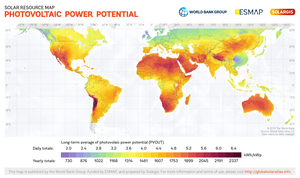
Productivity by location
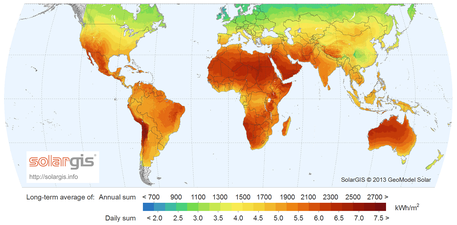
The productivity of solar power in a region depends on solar irradiance, which varies through the day and is influenced by latitude and climate. It also depends on the temperature, and the local soiling conditions.
The locations with highest annual solar irradiance lie in the arid tropics and subtropics. Deserts lying in low latitudes usually have few clouds, and can receive sunshine for more than ten hours a day.[88][89] These hot deserts form the Global Sun Belt circling the world. This belt consists of extensive swathes of land in Northern Africa, Southern Africa, Southwest Asia, Middle East, and Australia, as well as the much smaller deserts of North and South America.[90] Africa's eastern Sahara Desert, also known as the Libyan Desert, has been observed to be the sunniest place on Earth according to NASA.[91][92]
Different measurements of solar irradiance (direct normal irradiance, global horizontal irradiance) are mapped below :
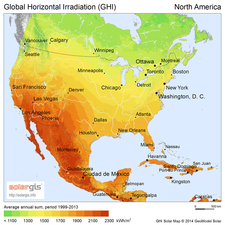
North America

South America

Europe
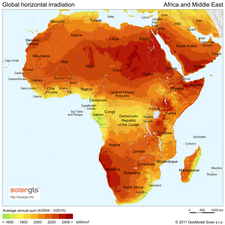
Africa and Middle East

South and South-East Asia
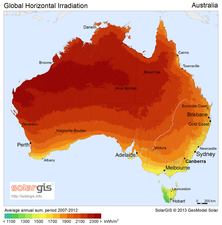
Australia
World


Levelized cost of electricity
This section needs to be updated. (October 2021) |
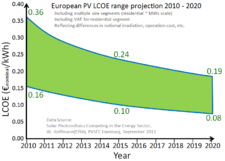
The PV industry has adopted levelized cost of electricity (LCOE) as the unit of cost. The electrical energy generated is sold in units of kilowatt-hours (kWh). As a rule of thumb, and depending on the local insolation, 1 watt-peak of installed solar PV capacity generates about 1 to 2 kWh of electricity per year. This corresponds to a capacity factor of around 10–20%. The product of the local cost of electricity and the insolation determines the break-even point for solar power. The International Conference on Solar Photovoltaic Investments, organized by , has estimated that PV systems will pay back their investors in 8 to 12 years.[93] As a result, since 2006 it has been economical for investors to install photovoltaics for free in return for a long term power purchase agreement. Fifty percent of commercial systems in the United States were installed in this manner in 2007 and over 90% by 2009.[94]
Shi Zhengrong has said that, as of 2012, unsubsidised solar power was already competitive with fossil fuels in India, Hawaii, Italy and Spain. He said "We are at a tipping point. No longer are renewable power sources like solar and wind a luxury of the rich. They are now starting to compete in the real world without subsidies". "Solar power will be able to compete without subsidies against conventional power sources in half the world by 2015".[95]
Palo Alto California signed a wholesale purchase agreement in 2016 that secured solar power for 3.7 cents per kilowatt-hour. And in sunny Dubai large-scale solar generated electricity sold in 2016 for just 2.99 cents per kilowatt-hour – "competitive with any form of fossil-based electricity — and cheaper than most."[96] In 2020, the UNDP project "Enhanced Rural Resilience in Yemen" (ERRY) -which uses community-owned solar microgrids- managed to cuts energy costs to just 2 cents per hour (whereas diesel-generated electricity costs 42 cents per hour).[97] As of October 2020, the unsubsidised levelised cost of electricity for utility-scale solar power is around $36/MWh.[4]
Grid parity
This section needs to be updated. (August 2021) |
Grid parity, the point at which the cost of photovoltaic electricity is equal to or cheaper than the price of grid power, is more easily achieved in areas with abundant sun and high costs for electricity such as in California and Japan.[98] In 2008, the levelized cost of electricity for solar PV was $0.25/kWh or less in most of the OECD countries. By late 2011, the fully loaded cost was predicted to fall below $0.15/kWh for most of the OECD and to reach $0.10/kWh in sunnier regions. These cost levels are driving three emerging trends: vertical integration of the supply chain, origination of power purchase agreements (PPAs) by solar power companies, and unexpected risk for traditional power generation companies, grid operators and wind turbine manufacturers.[99]
Grid parity was first reached in Spain in 2013,[100] Hawaii and other islands that otherwise use fossil fuel (diesel fuel) to produce electricity, and most of the US is expected to reach grid parity by 2015.[101][failed verification][102]
In 2007, General Electric's Chief Engineer predicted grid parity without subsidies in sunny parts of the United States by around 2015; other companies predicted an earlier date:[103] the cost of solar power will be below grid parity for more than half of residential customers and 10% of commercial customers in the OECD, as long as grid electricity prices do not decrease through 2010.[99]
Self consumption
In cases of self-consumption of solar energy, the payback time is calculated based on how much electricity is not purchased from the grid.[104] However, in many cases, the patterns of generation and consumption do not coincide, and some or all of the energy is fed back into the grid. The electricity is sold, and at other times when energy is taken from the grid, electricity is bought. The relative costs and prices obtained affect the economics. In many markets, the price paid for sold PV electricity is significantly lower than the price of bought electricity, which incentivizes self consumption.[105] Moreover, separate self consumption incentives have been used in e.g. Germany and Italy.[105] Grid interaction regulation has also included limitations of grid feed-in in some regions in Germany with high amounts of installed PV capacity.[105][106] By increasing self consumption, the grid feed-in can be limited without curtailment, which wastes electricity.[107]
A good match between generation and consumption is key for high self-consumption. The match can be improved with batteries or controllable electricity consumption.[107] However, batteries are expensive and profitability may require the provision of other services from them besides self consumption increase.[108] Hot water storage tanks with electric heating with heat pumps or resistance heaters can provide low-cost storage for self consumption of solar power.[107] Shiftable loads, such as dishwashers, tumble dryers and washing machines, can provide controllable consumption with only a limited effect on the users, but their effect on self-consumption of solar power may be limited.[107]
Energy pricing and incentives
The political purpose of incentive policies for PV is to facilitate an initial small-scale deployment to begin to grow the industry, even where the cost of PV is significantly above grid parity, to allow the industry to achieve the economies of scale necessary to reach grid parity. The policies are implemented to promote national energy independence, high tech job creation and reduction of CO2 emissions. Three incentive mechanisms are often used in combination as investment subsidies: the authorities refund part of the cost of installation of the system, the electricity utility buys PV electricity from the producer under a multiyear contract at a guaranteed rate, and Solar Renewable Energy Certificates (SRECs)
Rebates
With investment subsidies, the financial burden falls upon the taxpayer, while with feed-in tariffs the extra cost is distributed across the utilities' customer bases. While the investment subsidy may be simpler to administer, the main argument in favour of feed-in tariffs is the encouragement of quality. Investment subsidies are paid out as a function of the nameplate capacity of the installed system and are independent of its actual power yield over time, thus rewarding the overstatement of power and tolerating poor durability and maintenance. Some electric companies offer rebates to their customers, such as Austin Energy in Texas, which offers $2.50/watt installed up to $15,000.[109]
Net metering

In net metering the price of the electricity produced is the same as the price supplied to the consumer, and the consumer is billed on the difference between production and consumption. Net metering can usually be done with no changes to standard electricity meters, which accurately measure power in both directions and automatically report the difference, and because it allows homeowners and businesses to generate electricity at a different time from consumption, effectively using the grid as a giant storage battery. With net metering, deficits are billed each month while surpluses are rolled over to the following month. Best practices call for perpetual roll over of kWh credits.[110] Excess credits upon termination of service are either lost or paid for at a rate ranging from wholesale to retail rate or above, as can be excess annual credits. In New Jersey, annual excess credits are paid at the wholesale rate, as are left over credits when a customer terminates service.[111]
Feed-in tariffs (FIT)
This section needs to be updated. (August 2018) |
With feed-in tariffs, the financial burden falls upon the consumer. They reward the number of kilowatt-hours produced over a long period of time, but because the rate is set by the authorities, it may result in perceived overpayment. The price paid per kilowatt-hour under a feed-in tariff exceeds the price of grid electricity. Net metering refers to the case where the price paid by the utility is the same as the price charged.
The complexity of approvals in California, Spain and Italy has prevented comparable growth to Germany even though the return on investment is better.[citation needed] In some countries, additional incentives are offered for building-integrated photovoltaics (BIPV) compared to stand alone PV:[citation needed]
- France + EUR 0.16 /kWh (compared to semi-integrated) or + EUR 0.27/kWh (compared to stand alone)
- Italy + EUR 0.04–0.09 kWh
- Germany + EUR 0.05/kWh (facades only)
Solar Renewable Energy Credits (SRECs)
Alternatively, Solar Renewable Energy Certificates (SRECs) allow for a market mechanism to set the price of the solar-generated electricity subsidy. In this mechanism, renewable energy production or consumption target is set, and the utility (more technically the Load Serving Entity) is obliged to purchase renewable energy or face a fine (Alternative Compliance Payment or ACP). The producer is credited for an SREC for every 1,000 kWh of electricity produced. If the utility buys this SREC and retires it, they avoid paying the ACP. In principle, this system delivers the cheapest renewable energy since all solar facilities are eligible and can be installed in most economic locations. Uncertainties about the future value of SRECs have led to long-term SREC contract markets to give clarity to their prices and allow solar developers to pre-sell and hedge their credits.
Financial incentives for photovoltaics differ across countries, including Australia, China,[112] Germany,[113] Israel,[114] Japan, and the United States and even across states within the US.
The Japanese government through its Ministry of International Trade and Industry ran a successful programme of subsidies from 1994 to 2003. By the end of 2004, Japan led the world in installed PV capacity with over 1.1 GW.[115]
In 2004, the German government introduced the first large-scale feed-in tariff system, under the German Renewable Energy Act, which resulted in an explosive growth of PV installations in Germany[citation needed]. At the outset, the FIT was over 3x the retail price or 8x the industrial price. The principle behind the German system is a 20-year flat rate contract. The value of new contracts is programmed to decrease each year, in order to encourage the industry to pass on lower costs to the end-users. The programme has been more successful than expected with over 1GW installed in 2006, and political pressure is mounting to decrease the tariff to lessen the future burden on consumers[citation needed].
Subsequently, Spain, Italy, Greece—that enjoyed an early success with domestic solar-thermal installations for hot water needs—and France introduced feed-in tariffs[citation needed]. None has replicated the programmed decrease of FIT in new contracts though, making the German incentive relatively less and less attractive compared to other countries. California, Greece, France and Italy have 30–50% more insolation than Germany, making them financially more attractive.
Grid integration

The overwhelming majority of electricity produced worldwide is used immediately since storage is usually more expensive and because traditional generators can adapt to demand. Both solar power and wind power are variable renewable energy, meaning that all available output must be taken whenever it is available by moving through transmission lines to where it can be used now. Since solar energy is not available at night, storing its energy is potentially an important issue particularly in off-grid and for future 100% renewable energy scenarios to have continuous electricity availability.[119]
Solar electricity is inherently variable and predictable by time of day, location, and seasons. In addition, solar is intermittent due to day/night cycles and unpredictable weather. How much of a special challenge solar power is in any given electric utility varies significantly. In a utility, solar is well matched to daytime cooling demands. In utilities, solar displaces other forms of generation, reducing their capacity factors.
In an electricity system without grid energy storage, generation from stored fuels (coal, biomass, natural gas, nuclear) must go up and down in reaction to the rise and fall of solar electricity (see load following power plant). While hydroelectric and natural gas plants can quickly respond to changes in load, coal, biomass and nuclear plants usually take considerable time to respond to load and can only be scheduled to follow the predictable variation. Depending on local circumstances, beyond about 20–40% of total generation, grid-connected intermittent sources like solar tend to require investment in some combination of grid interconnections, energy storage or demand side management. Integrating large amounts of solar power with existing generation equipment has caused issues in some cases. For example, in Germany, California and Hawaii, electricity prices have been known to go negative when solar is generating a lot of power, displacing existing baseload generation contracts.[120][121]
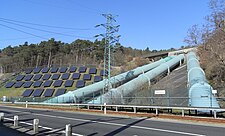
Conventional hydroelectricity works very well in conjunction with solar power; water can be held back or released from a reservoir as required. Where a suitable river is not available, pumped-storage hydroelectricity uses solar power to pump water to a high reservoir on sunny days, then the energy is recovered at night and in bad weather by releasing water via a hydroelectric plant to a low reservoir where the cycle can begin again.[122] This cycle can lose 20% of the energy to round trip inefficiencies, this plus the construction costs add to the expense of implementing high levels of solar power.
Concentrated solar power plants may use thermal storage to store solar energy, such as in high-temperature molten salts. These salts are an effective storage medium because they are low-cost, have a high specific heat capacity, and can deliver heat at temperatures compatible with conventional power systems. This method of energy storage is used, for example, by the Solar Two power station, allowing it to store 1.44 TJ in its 68 m3 storage tank, enough to provide full output for close to 39 hours, with an efficiency of about 99%.[123]
In stand alone PV systems batteries are traditionally used to store excess electricity. With grid-connected photovoltaic power system, excess electricity can be sent to the electrical grid. Net metering and feed-in tariff programs give these systems a credit for the electricity they produce. This credit offsets electricity provided from the grid when the system cannot meet demand, effectively trading with the grid instead of storing excess electricity. Credits are normally rolled over from month to month and any remaining surplus settled annually.[124] When wind and solar are a small fraction of the grid power, other generation techniques can adjust their output appropriately, but as these forms of variable power grow, additional balance on the grid is needed. As prices are rapidly declining, PV systems increasingly use rechargeable batteries to store a surplus to be later used at night. Batteries used for grid-storage can stabilize the electrical grid by leveling out peak loads for around an hour or more. In the future, less expensive batteries could play an important role on the electrical grid, as they can charge during periods when generation exceeds demand and feed their stored energy into the grid when demand is higher than generation.
Common battery technologies used in today's home PV systems include, the valve regulated lead-acid battery– a modified version of the conventional lead–acid battery, nickel–cadmium and lithium-ion batteries.[citation needed] Lead-acid batteries are currently the predominant technology used in small-scale, residential PV systems, due to their high reliability, low self-discharge and investment and maintenance costs, despite shorter lifetime and lower energy density.[citation needed] Lithium-ion batteries have the potential to replace lead-acid batteries in the near future, as they are being intensively developed and lower prices are expected due to economies of scale provided by large production facilities such as the Gigafactory 1. In addition, the Li-ion batteries of plug-in electric cars may serve as future storage devices in a vehicle-to-grid system. Since most vehicles are parked an average of 95% of the time, their batteries could be used to let electricity flow from the car to the power lines and back. Other rechargeable batteries used for distributed PV systems include, sodium–sulfur and vanadium redox batteries, two prominent types of a molten salt and a flow battery, respectively.[125][126][127]
The combination of wind and solar PV has the advantage that the two sources complement each other because the peak operating times for each system occur at different times of the day and year. The power generation of such solar hybrid power systems is therefore more constant and fluctuates less than each of the two component subsystems.[27] Solar power is seasonal, particularly in northern/southern climates, away from the equator, suggesting a need for long term seasonal storage in a medium such as hydrogen or pumped hydroelectric.[128] The Institute for Solar Energy Supply Technology of the University of Kassel pilot-tested a combined power plant linking solar, wind, biogas and pumped-storage hydroelectricity to provide load-following power from renewable sources.[129]
Research is also undertaken in this field of artificial photosynthesis. It involves the use of nanotechnology to store solar electromagnetic energy in chemical bonds, by splitting water to produce hydrogen fuel or then combining with carbon dioxide to make biopolymers such as methanol. Many large national and regional research projects on artificial photosynthesis are now trying to develop techniques integrating improved light capture, quantum coherence methods of electron transfer and cheap catalytic materials that operate under a variety of atmospheric conditions.[130] Senior researchers in the field have made the public policy case for a Global Project on Artificial Photosynthesis to address critical energy security and environmental sustainability issues.[131]
Environmental impacts
Unlike fossil fuel based technologies, solar power does not lead to any harmful emissions during operation, but the production of the panels leads to some amount of pollution.
Greenhouse gases
The life-cycle greenhouse-gas emissions of solar power are in the range of 22 to 46 gram (g) per kilowatt-hour (kWh) depending on if solar thermal or solar PV is being analyzed, respectively. With this potentially being decreased to 15 g/kWh in the future.[132][needs update] For comparison (of weighted averages), a combined cycle gas-fired power plant emits some 400–599 g/kWh,[133] an oil-fired power plant 893 g/kWh,[133] a coal-fired power plant 915–994 g/kWh[134] and a geothermal high-temp. power plant 91–122 g/kWh.[133] The life cycle emission intensity of hydro, wind and nuclear power are lower than solar's as of 2011[needs update] as published by the IPCC, and discussed in the article Life-cycle greenhouse-gas emissions of energy sources. Similar to all energy sources where their total life cycle emissions primarily lay in the construction and transportation phase, the switch to low carbon power in the manufacturing and transportation of solar devices would further reduce carbon emissions. BP Solar owns two factories built by Solarex (one in Maryland, the other in Virginia) in which all of the energy used to manufacture solar panels is produced by solar panels. A 1-kilowatt system eliminates the burning of approximately 170 pounds of coal, 300 pounds of carbon dioxide from being released into the atmosphere, and saves up to 400 litres (105 US gal) of water consumption monthly.[135]
The US National Renewable Energy Laboratory (NREL), in harmonizing the disparate estimates of life-cycle GHG emissions for solar PV, found that the most critical parameter was the solar insolation of the site: GHG emissions factors for PV solar are inversely proportional to insolation.[136] For a site with insolation of 1700 kWh/m2/year, typical of southern Europe, NREL researchers estimated GHG emissions of 45 gCO
2e/kWh. Using the same assumptions, at Phoenix, USA, with insolation of 2400 kWh/m2/year, the GHG emissions factor would be reduced to 32 g of CO2e/kWh.[137]
The New Zealand Parliamentary Commissioner for the Environment found that the solar PV would have little impact on the country's greenhouse gas emissions. The country already generates 80 percent of its electricity from renewable resources (primarily hydroelectricity and geothermal) and national electricity usage peaks on winter evenings whereas solar generation peaks on summer afternoons, meaning a large uptake of solar PV would end up displacing other renewable generators before fossil-fueled power plants.[138]
Manufacturing of solar panels requires nitrogen trifluoride (NF3) which is a potent greenhouse gas and with increase of PV production its usage has increased by over 1000% over the last 25 years.[139]
Energy payback
The energy payback time (EPBT) of a power generating system is the time required to generate as much energy as is consumed during production and lifetime operation of the system. Due to improving production technologies the payback time has been decreasing constantly since the introduction of PV systems in the energy market.[140] In 2000 the energy payback time of PV systems was estimated as 8 to 11 years[141] and in 2006 this was estimated to be 1.5 to 3.5 years for crystalline silicon PV systems[132] and 1–1.5 years for thin film technologies (S. Europe).[132] These figures fell to 0.75–3.5 years in 2013, with an average of about 2 years for crystalline silicon PV and CIS systems.[142]
Another economic measure, closely related to the energy payback time, is the energy returned on energy invested (EROEI) or energy return on investment (EROI),[143] which is the ratio of electricity generated divided by the energy required to build and maintain the equipment. (This is not the same as the economic return on investment (ROI), which varies according to local energy prices, subsidies available and metering techniques.) With expected lifetimes of 30 years,[144] the EROEI of PV systems are in the range of 10 to 30, thus generating enough energy over their lifetimes to reproduce themselves many times (6–31 reproductions) depending on what type of material, balance of system (BOS), and the geographic location of the system.[145]
Water use
Solar power includes plants with among the lowest water consumption per unit of electricity (photovoltaic), and also power plants with among the highest water consumption (concentrating solar power with wet-cooling systems).
Photovoltaic power plants use very little water for operations. Life-cycle water consumption for utility-scale operations is estimated to be 45 litres (12 US gallons) per megawatt-hour for flat-panel PV solar. Only wind power, which consumes essentially no water during operations, has a lower water consumption intensity.[146]
Concentrating solar power plants with wet-cooling systems, on the other hand, have the highest water-consumption intensities of any conventional type of electric power plant; only fossil-fuel plants with carbon-capture and storage may have higher water intensities.[147] A 2013 study comparing various sources of electricity found that the median water consumption during operations of concentrating solar power plants with wet cooling was 3.1 cubic metres per megawatt-hour (810 US gal/MWh) for power tower plants and 3.4 m3/MWh (890 US gal/MWh) for trough plants. This was higher than the operational water consumption (with cooling towers) for nuclear at 2.7 m3/MWh (720 US gal/MWh), coal at 2.0 m3/MWh (530 US gal/MWh), or natural gas at 0.79 m3/MWh (210 US gal/MWh).[146] A 2011 study by the National Renewable Energy Laboratory came to similar conclusions: for power plants with cooling towers, water consumption during operations was 3.27 m3/MWh (865 US gal/MWh) for CSP trough, 2.98 m3/MWh (786 US gal/MWh) for CSP tower, 2.60 m3/MWh (687 US gal/MWh) for coal, 2.54 m3/MWh (672 US gal/MWh) for nuclear, and 0.75 m3/MWh (198 US gal/MWh) for natural gas.[148] The Solar Energy Industries Association noted that the Nevada Solar One trough CSP plant consumes 3.2 m3/MWh (850 US gal/MWh).[149] The issue of water consumption is heightened because CSP plants are often located in arid environments where water is scarce.
In 2007, the US Congress directed the Department of Energy to report on ways to reduce water consumption by CSP. The subsequent report noted that dry cooling technology was available that, although more expensive to build and operate, could reduce water consumption by CSP by 91 to 95 percent. A hybrid wet/dry cooling system could reduce water consumption by 32 to 58 percent.[150] A 2015 report by NREL noted that of the 24 operating CSP power plants in the US, 4 used dry cooling systems. The four dry-cooled systems were the three power plants at the Ivanpah Solar Power Facility near Barstow, California, and the Genesis Solar Energy Project in Riverside County, California. Of 15 CSP projects under construction or development in the US as of March 2015, 6 were wet systems, 7 were dry systems, 1 hybrid, and 1 unspecified.
Although many older thermoelectric power plants with once-through cooling or cooling ponds use more water than CSP, meaning that more water passes through their systems, most of the cooling water returns to the water body available for other uses, and they consume less water by evaporation. For instance, the median coal power plant in the US with once-through cooling uses 138 m3/MWh (36,350 US gal/MWh), but only 0.95 m3/MWh (250 US gal/MWh) (less than one percent) is lost through evaporation.[151] Since the 1970s, the majority of US power plants have used recirculating systems such as cooling towers rather than once-through systems.[152]
Land use, deforestation and residential opposition
Life-cycle surface power density of solar power is estimated at 6.63 W/m2 which is two orders of magnitude less than fossil fuels and nuclear power.[153] Capacity factor of PV is also relatively low, usually below 15%.[154] As result, PV requires much larger amounts of land surface to produce the same nominal amount of energy as sources with higher surface power density and capacity factor. According to a 2021 study obtaining 80% from PV by 2050 would require up to 2.8% of total landmass in European Union and up to 5% in countries like Japan and South Korea. Occupation of such large areas for PV farms is likely to drive residential opposition as well as lead to deforestation, removal of vegetation and conversion of farm land.[155]
A 2014-published life-cycle analysis of land use for various sources of electricity concluded that the large-scale implementation of solar and wind potentially reduces pollution-related environmental impacts. The study found that the land-use footprint, given in square meter-years per megawatt-hour (m2a/MWh), was lowest for wind, natural gas and rooftop PV, with 0.26, 0.49 and 0.59, respectively, and followed by utility-scale solar PV with 7.9. For CSP, the footprint was 9 and 14, using parabolic troughs and solar towers, respectively. The largest footprint had coal-fired power plants with 18 m2a/MWh. The study excluded nuclear power and biomass.[156]
Industrial photovoltaic farms use vast amount of space due to relatively low surface power density and occasionally face opposition from local residents, especially in countries with high population density or when the installation involves removal of existing trees or shrubs. Construction of Cleve Hill Solar Park in Kent (United Kingdom) composed of 880'000 panels up to 3.9 m high on 490 hectares of land[157] faced opposition on the grounds of not only "destroying the local landscape" but also large-scale lithium-ion battery facility which was perceived as prone to an explosion.[158] The solar farm divided Greenpeace (which opposed) and Friends of the Earth (which supported it).[159] Similar concerns about deforestation were raised when large amounts of trees were removed for installation of solar farms in New Jersey[160] and others.[161]
Other issues
One issue that has often raised concerns is the use of cadmium (Cd), a toxic heavy metal that has the tendency to accumulate in ecological food chains. It is used as semiconductor component in CdTe solar cells and as a buffer layer for certain CIGS cells in the form of cadmium sulfide.[162] The amount of cadmium used in thin-film solar cells is relatively small (5–10 g/m2) and with proper recycling and emission control techniques in place the cadmium emissions from module production can be almost zero. Current PV technologies lead to cadmium emissions of 0.3–0.9 microgram/kWh over the whole life-cycle.[132] Most of these emissions arise through the use of coal power for the manufacturing of the modules, and coal and lignite combustion leads to much higher emissions of cadmium. Life-cycle cadmium emissions from coal is 3.1 microgram/kWh, lignite 6.2, and natural gas 0.2 microgram/kWh.
In a life-cycle analysis it has been noted, that if electricity produced by photovoltaic panels were used to manufacture the modules instead of electricity from burning coal, cadmium emissions from coal power usage in the manufacturing process could be entirely eliminated.[163]
In the case of crystalline silicon modules, the solder material, that joins together the copper strings of the cells, contains about 36 percent of lead (Pb). Moreover, the paste used for screen printing front and back contacts contains traces of Pb and sometimes Cd as well. It is estimated that about 1,000 metric tonnes of Pb have been used for 100 gigawatts of c-Si solar modules. However, there is no fundamental need for lead in the solder alloy.[162]
Some media sources have reported that concentrated solar power plants have injured or killed large numbers of birds due to intense heat from the concentrated sunrays.[164][165] This adverse effect does not apply to PV solar power plants, and some of the claims may have been overstated or exaggerated.[166]
While average solar panel life time is estimated to exceed 20 years, high temperatures, sand or weather can significantly accelerate the aging process. Due to vast space requirements by solar power it is estimated that amount of toxic (e.g. cadmium) waste that needs to be processed is 300 times higher per unit of energy than for nuclear power. Recycling is a significant challenge due to the large volumes of waste. In 2013, a US-based Solyndra solar farm left over 5,670 metric tons of hazardous waste after it bankrupted after 4 years of operations.[139]
Manufacturing of solar panels requires rare-earth elements, producing low-level radioactive waste during the mining process.
International Energy Agency study projects the demand for mined resources such as lithium, graphite, cobalt, copper, nickel and rare earths will rise 4x by 2040 and notes insufficient supply of these materials to match demand imposed by expected large-scale deployments of decentralized technologies solar and wind power, and required grid upgrades.[167][168] According to a 2018 study significant increase of PV solar power would require 3000% increase in supply of these metals by 2060, thermal solar — 6000%, requiring significant increase in mining operations.[169]
Political issues
Majority of the PV panels is manufactured in China using silicon sourced from one particular region of Xinjiang, which raises concerns about human rights violations (Xinjang internment camps) as well as supply chain dependency.[170]
Emerging technologies
This section needs additional citations for verification. (October 2021) |
Concentrator photovoltaics
Concentrator photovoltaics (CPV) systems employ sunlight concentrated onto photovoltaic surfaces for the purpose of electrical power production. Contrary to conventional photovoltaic systems, it uses lenses and curved mirrors to focus sunlight onto small, but highly efficient, multi-junction solar cells. Solar concentrators of all varieties may be used, and these are often mounted on a solar tracker in order to keep the focal point upon the cell as the sun moves across the sky.[171] Luminescent solar concentrators (when combined with a PV-solar cell) can also be regarded as a CPV system. Concentrated photovoltaics are useful as they can improve efficiency of PV-solar panels drastically.[172]
In addition, most solar panels on spacecraft are also made of high efficient multi-junction photovoltaic cells to derive electricity from sunlight when operating in the inner Solar System.
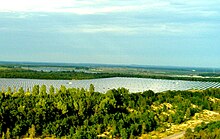
Floatovoltaics
Floatovoltaics are an emerging form of PV systems that float on the surface of irrigation canals, water reservoirs, quarry lakes, and tailing ponds. Several systems exist in France, India, Japan, Korea, the United Kingdom and the United States.[173][174][175][176] These systems reduce the need of valuable land area, save drinking water that would otherwise be lost through evaporation, and show a higher efficiency of solar energy conversion, as the panels are kept at a cooler temperature than they would be on land.[177] Although not floating, other dual-use facilities with solar power include fisheries.[178]
Solar updraft tower
The solar updraft tower (SUT) is a design concept for a renewable-energy power plant for generating electricity from low temperature solar heat. Sunshine heats the air beneath a very wide greenhouse-like roofed collector structure surrounding the central base of a very tall chimney tower. The resulting convection causes a hot air updraft in the tower by the chimney effect. This airflow drives wind turbines, placed in the chimney updraft or around the chimney base, to produce electricity. As of mid 2018, although several prototype models have been built, no full-scale practical units are in operation. Scaled-up versions of demonstration models are planned to generate significant power. They may also allow development of other applications, such as to agriculture or horticulture, to water extraction or distillation, or to improvement of urban air pollution
Perovskite solar cells

A perovskite solar cell (PSC) is a type of solar cell which includes a perovskite-structured compound, most commonly a hybrid organic-inorganic lead or tin halide-based material, as the light-harvesting active layer. Perovskite materials, such as methylammonium lead halides and all-inorganic caesium lead halide, are cheap to produce and simple to manufacture. Solar cell efficiencies of laboratory-scale devices using these materials have increased from 3.8% in 2009 to 25.5% in 2020 in single-junction architectures, and, in silicon-based tandem cells, to 29.15%, exceeding the maximum efficiency achieved in single-junction silicon solar cells. Perovskite solar cells have therefore been the fastest-advancing solar technology as of 2016. With the potential of achieving even higher efficiencies and very low production costs, perovskite solar cells have become commercially attractive. Core problems and research subjects include their short- and long-term stability.
See also
- 100% renewable energy
- Cost of electricity by source
- Index of solar energy articles
- List of cities by sunshine duration
- List of energy storage projects
- List of photovoltaic power stations
- List of renewable energy organizations
- List of solar thermal power stations
- List of renewable energy topics by country
- Renewable energy commercialization
- Solar energy
- Solar lamp
- Solar vehicle
- Sustainable energy
- Timeline of solar cells
References
- ^ "Energy Sources: Solar". Department of Energy. Archived from the original on 14 April 2011. Retrieved 19 April 2011.
- ^ "Net Zero by 2050 – Analysis". IEA. Retrieved 14 October 2021.
- ^ "Global electricity". Ember. Retrieved 14 October 2021.
- ^ a b "Levelized Cost of Energy and Levelized Cost of Storage 2020".
- ^ "Developers increasingly pair batteries with utility-scale solar to combat declining value in crowded markets". Utility Dive. Retrieved 14 October 2021.
- ^ a b c Solar Cells and their Applications Second Edition, Lewis Fraas, Larry Partain, Wiley, 2010, ISBN 978-0-470-44633-1, Section10.2.
- ^ Perlin (1999), p. 147
- ^ Perlin (1999), pp. 18–20
- ^ Corporation, Bonnier (June 1931). "Magic Plates, Tap Sun For Power". Popular Science: 41. Retrieved 19 April 2011.
- ^ Perlin (1999), p. 29
- ^ Perlin (1999), p. 29–30, 38
- ^ Black, Lachlan E. (2016). New Perspectives on Surface Passivation: Understanding the Si-Al2O3 Interface (PDF). Springer. p. 13. ISBN 9783319325217.
- ^ Lojek, Bo (2007). History of Semiconductor Engineering. Springer Science & Business Media. pp. 120& 321–323. ISBN 9783540342588.
- ^ Black, Lachlan E. (2016). New Perspectives on Surface Passivation: Understanding the Si-Al2O3 Interface (PDF). Springer. ISBN 9783319325217.
- ^ "Trends in Photovoltaic Applications Survey report of selected IEA countries between 1992 and 2009, IEA-PVPS". Archived from the original on 25 May 2017. Retrieved 8 November 2011.
- ^ Author (11 June 2018). "How CSP Works: Tower, Trough, Fresnel or Dish". Solarpaces. Retrieved 14 March 2020.
- ^ Martin and Goswami (2005), p. 45
- ^ Stephen Lacey (6 July 2011). "Spanish CSP Plant with Storage Produces Electricity for 24 Hours Straight". Archived from the original on 12 October 2012.
- ^ "Concentrated Solar Thermal Power – Now" (PDF). Archived (PDF) from the original on 10 September 2008. Retrieved 19 August 2008.
- ^ a b c "Concentrating Solar Power in 2001 – An IEA/SolarPACES Summary of Present Status and Future Prospects" (PDF). International Energy Agency – SolarPACES. Archived from the original (PDF) on 10 September 2008. Retrieved 2 July 2008.
- ^ "UNLV Solar Site". University of Las Vegas. Archived from the original on 3 September 2006. Retrieved 2 July 2008.
- ^ "Compact CLFR". Physics.usyd.edu.au. 12 June 2002. Archived from the original on 12 April 2011. Retrieved 19 April 2011.
- ^ "Ausra compact CLFR introducing cost-saving solar rotation features" (PDF). Archived from the original (PDF) on 21 July 2011. Retrieved 19 April 2011.
- ^ "An Assessment of Solar Energy Conversion Technologies and Research Opportunities" (PDF). Stanford University – Global Climate Change & Energy Project. Archived (PDF) from the original on 9 May 2008. Retrieved 2 July 2008.
- ^ Phys.org A novel solar CPV/CSP hybrid system proposed Archived 22 August 2015 at the Wayback Machine, 11 February 2015
- ^ Amanda Cain (22 January 2014). "What Is a Photovoltaic Diesel Hybrid System?". RenewableEnergyWorld.com.
- ^ a b "Hybrid Wind and Solar Electric Systems". United States Department of Energy. 2 July 2012. Archived from the original on 26 May 2015.
- ^ Kraemer, D; Hu, L; Muto, A; Chen, X; Chen, G; Chiesa, M (2008), "Photovoltaic-thermoelectric hybrid systems: A general optimization methodology", Applied Physics Letters, 92 (24): 243503, Bibcode:2008ApPhL..92x3503K, doi:10.1063/1.2947591
- ^ "Share of electricity production from solar". Our World in Data. Retrieved 18 October 2020.
- ^ Find data and sources in articles Growth of photovoltaics and Concentrated solar power#Deployment around the world
- ^ "Electricity". International Energy Agency. 2020. Data Browser section, Electricity Generation by Source indicator. Retrieved 17 July 2021.
- ^ "BP Statistical Review of World Energy June 2015, Renewables section" (PDF). BP. June 2015. Archived (PDF) from the original on 7 July 2015. Retrieved 7 July 2015.
- ^ "BP Statistical Review of World Energy June 2015, Electricity section" (PDF). BP. June 2015. Archived from the original (PDF) on 4 July 2015. Retrieved 7 July 2015.
- ^ "BP Statistical Review of World Energy 2016 - data workbook". BP. June 2016. Archived from the original on 2 December 2016. Retrieved 11 June 2016.
- ^ BP Global, solar energy: Renewable Energy 2017 in review
- ^ "Stats report" (PDF). www.bp.com. Retrieved 3 May 2021.
- ^ Scientific American. Munn & Company. 10 April 1869. p. 227.
- ^ "Photovoltaic Dreaming 1875--1905: First Attempts At Commercializing PV - CleanTechnica". cleantechnica.com. 31 December 2014. Archived from the original on 25 May 2017. Retrieved 30 April 2018.
- ^ Butti and Perlin (1981), p. 63, 77, 101
- ^ "The Solar Energy Book-Once More." Mother Earth News 31:16–17, Jan. 1975
- ^ Butti and Perlin (1981), p. 249
- ^ Yergin (1991), pp. 634, 653–673
- ^ "Chronicle of Fraunhofer-Gesellschaft". Fraunhofer-Gesellschaft. Archived from the original on 12 December 2007. Retrieved 4 November 2007.
- ^ Solar: photovoltaic: Lighting Up The World retrieved 19 May 2009 Archived 13 August 2010 at the Wayback Machine
- ^ AG, SMA Solar Technology. "Tokelau becomes the world's first 100% solar powered country". www.sma.de.
- ^ a b "Photovoltaics: Overview of installed PV in 2013". Renewables International. 14 January 2014. Archived from the original on 30 March 2014. Retrieved 23 June 2014.
- ^ a b "2016 Snapshot of Global Photovoltaic Markets" (PDF). International Energy Agency. 2017. Archived (PDF) from the original on 27 August 2017.
- ^ Colville, Finlay (30 January 2017). "Top-10 solar cell producers in 2016". PV-Tech. Archived from the original on 2 February 2017.
- ^ Ball, Jeffrey; et al. (21 March 2017). "The New Solar System - Executive Summary" (PDF). Stanford University Law School, Steyer-Taylor Center for Energy Policy and Finance. Archived (PDF) from the original on 20 April 2017. Retrieved 27 June 2017.
- ^ REN21 (2014). "Renewables 2014: Global Status Report" (PDF). Archived (PDF) from the original on 15 September 2014.
- ^ "Solar photovoltaic roadmap" (PDF). International Energy Agency. 2010. Archived (PDF) from the original on 24 September 2015. Retrieved 18 August 2014.
- ^ a b c d e f g h http://www.iea.org (2014). "Technology Roadmap: Solar Photovoltaic Energy" (PDF). IEA. Archived (PDF) from the original on 7 October 2014. Retrieved 7 October 2014.
- ^ Cork, University College. "Assessing global electricity generation potential from rooftop solar photovoltaics". techxplore.com. Retrieved 11 October 2021.
- ^ "DOE Closes on Four Major Solar Projects". Renewable Energy World. 30 September 2011. Archived from the original on 11 November 2011.
- ^ a b Ranjan, Rakesh (27 December 2019). "World's Largest Solar Park at Karnataka's Pavagada is Now Fully Operational". Mercom India. Retrieved 13 February 2020.
- ^ "Pavagada Solar Park in Karnataka fully operational". www.projectstoday.com. Retrieved 13 February 2020.
- ^ "600 MW of Solar Projects Synchronized to the Grid at Karnataka's Pavagada Park". Retrieved 18 February 2018.
- ^ "10 really cool Solar Power installations in (and above) the world". 29 January 2018. Retrieved 30 January 2018.
- ^ "宁夏在腾格里沙漠南缘建成全国最大沙漠光伏集成区 - 今日热点 - 中国储能网". www.escn.com.cn. Retrieved 20 May 2017.
- ^ www.ETEnergyworld.com. "Solar power plants of 620 MW capacity get operational at Bhadla park - ET EnergyWorld". ETEnergyworld.com. Retrieved 13 February 2020.
- ^ Prateek, Saumy (30 April 2019). "Rajasthan's Bhadla Solar Park Sees Commissioning of 200 MW by Azure and ReNew". Mercom India. Retrieved 13 February 2020.
- ^ "Country's Biggest Solar Park In Rajasthan, At The Heart Of India's Clean Energy Push". NDTV.com. Retrieved 6 June 2017.
- ^ "The World's Largest Solar Park - Kurnool, India". Retrieved 1 November 2017.
- ^ "大同光伏领跑者验收:月均发电量超过1亿度 - OFweek太阳能光伏网". solar.ofweek.com. Retrieved 20 May 2017.
- ^ "看山西大同示范基地如何领跑全国光伏行业 - 光伏电站 - 中国储能网". www.escn.com.cn. Retrieved 20 May 2017.
- ^ "China's Top Runner Program Improves Mono-si Products' Market Share to 25%_EnergyTrend PV". pv.energytrend.com. Archived from the original on 2 March 2018. Retrieved 20 May 2017.
- ^ Denis Lenardic. Large-scale photovoltaic power plants ranking 1 - 50 PVresources.com, 2011.
- ^ "KW50 - CPI completes massive hybrid solar PV/hydro plant in Western China - SolarServer".
- ^ Jun, Zhang (May 2015). "Joint Development Mode of Hydropower and New Energy" (PDF). Upstream Huanghe Hydropower Development Co., Ltd. Retrieved 22 March 2016.
- ^ "Global hydropower market shows promise for future". ESI-Africa.com. 10 March 2016. Retrieved 22 March 2016.
- ^ 750MW Madhya Pradesh solar plant starts operations, to serve Delhi Metro, The New Indian Express, 6 July 2018
- ^ Pandit, Virendra. "Adani dedicates to nation world's largest solar power plant in TN". @businessline.
- ^ "Adani Group launches world's largest solar power plant in Tamil Nadu - Times of India". Retrieved 21 September 2016.
- ^ Solar Star Project, Japan DG Demand Drive SunPower's Q3, Forbes, 10/31/2014
- ^ "solar-star-i-and-ii". www.mortenson.com.
- ^ "Earth Observatory image, using EO-1 ALI data". 5 March 2015.
- ^ Steve Leone (7 December 2011). "Billionaire Buffett Bets on Solar Energy". Renewable Energy World.
- ^ "California Valley's Topaz Solar Farm now producing electricity". sanluisobispo. Archived from the original on 3 March 2015. Retrieved 20 August 2018.
- ^ Energy Information Administration. "Topaz Solar Farm, Monthly". Electricity Data Browser. Retrieved 9 October 2013.
- ^ What is peak demand? Archived 11 August 2012 at the Wayback Machine, Energex.com.au website.
- ^ "Abengoa Solar begins construction on Extremadura's second solar concentrating solar power plant". abengoasolar.com. Archived from the original on 4 December 2009. Retrieved 30 April 2018.
- ^ "Abengoa closes financing and begin operation of Solaben 1 & 6 CSP plants in Spain". CSP-World. Archived from the original on 16 October 2013.
- ^ "Solar Photovoltaics Competing in the Energy Sector—On the road to competitiveness" (PDF). European Photovoltaic Industry Association. September 2011. p. 18. Archived from the original (PDF) on 26 February 2013.
- ^ US EIA, Levelized Cost and Levelized Avoided Cost of New Generation Resources in the Annual Energy Outlook 2014 Archived 27 October 2015 at the Wayback Machine, 17 April 2014.
- ^ The Solar Singularity: 2020 Update (Part 1)
- ^ "Solar Shingles Vs. Solar Panels: Cost, Efficiency & More (2021)". EcoWatch. 8 August 2021. Retrieved 25 August 2021.
- ^ "Solar Farms: What Are They and How Much Do They Cost? | EnergySage". Solar News. 18 June 2021. Retrieved 25 August 2021.
- ^ "Archived copy". Archived from the original on 22 August 2017. Retrieved 22 August 2017.CS1 maint: archived copy as title (link)
- ^ "Archived copy". Archived from the original on 23 September 2015. Retrieved 6 September 2015.CS1 maint: archived copy as title (link)
- ^ "Living in the Sun Belt : The Solar Power Potential for the Middle East". 27 July 2016. Archived from the original on 26 August 2017. Retrieved 22 August 2017.
- ^ "The cloudiest place". www.acgeospatial.co.uk. Archived from the original on 22 August 2017. Retrieved 30 April 2018.
- ^ Lipponen, Antti (7 January 2017). "The sunniest place on Earth in 2016". medium.com. Archived from the original on 22 August 2017. Retrieved 30 April 2018.
- ^ "3rd International Conference on Solar Photovoltaic Investments". Pvinvestmentconference.org. Archived from the original on 3 May 2009. Retrieved 19 April 2011.
- ^ "Solar Power Services: How PPAs are Changing the PV Value Chain". 11 February 2008. Archived from the original on 10 May 2009. Retrieved 21 May 2009.
- ^ Mark Clifford (8 February 2012). "China's visible solar power success". MarketWatch. Archived from the original on 1 August 2013.
- ^ Jabusch, Garvin. "These 4 solar-power stocks will leave fossil fuels in the dust". marketwatch.com. Archived from the original on 19 August 2017. Retrieved 30 April 2018.
- ^ "UNDP Yemen wins acclaimed international Ashden Awards for Humanitarian Energy". UNDP.
- ^ Going for grid parity Archived 8 June 2011 at the Wayback Machine 2005 article
- ^ a b Conkling, Joel; Rogol, Michael. "THE TRUE COST OF SOLAR POWER: 10 Cents/kWh by 2010". Archived from the original on 8 September 2008. Retrieved 22 October 2008.
- ^ Kelly-Detwiler, Peter. "Solar Grid Parity Comes to Spain". Forbes. Archived from the original on 2 January 2013.
- ^ "Gaining on the grid". BP. Archived from the original on 8 June 2011.
- ^ "The Path to Grid Parity". BP. Archived from the original on 29 October 2013.[failed verification]
- ^ Reuters Editorial (19 October 2007). "Solar power edges towards boom time". Reuters. Archived from the original on 22 July 2009.
- ^ "Money saved by producing electricity from PV and Years for payback". Archived from the original on 28 December 2014.
- ^ a b c Trends in Photovoltaic Applications 2014 (PDF) (Report). IEA-PVPS. 2014. Archived (PDF) from the original on 25 May 2017.
- ^ Stetz, T; Marten, F; Braun, M (2013). "Improved Low Voltage Grid-Integration of Photovoltaic Systems in Germany". IEEE Transactions on Sustainable Energy. 4 (2): 534–542. Bibcode:2013ITSE....4..534S. doi:10.1109/TSTE.2012.2198925. S2CID 47032066.
- ^ a b c d Salpakari, Jyri; Lund, Peter (2016). "Optimal and rule-based control strategies for energy flexibility in buildings with PV". Applied Energy. 161: 425–436. doi:10.1016/j.apenergy.2015.10.036.
- ^ Fiztgerald, Garrett; Mandel, James; Morris, Jesse; Touati, Hervé (2015). The Economics of Battery Energy Storage (PDF) (Report). Rocky Mountain Institute. Archived from the original (PDF) on 30 November 2016.
- ^ Solar Rebate Program Archived 25 July 2012 at the Wayback Machine
- ^ "Net Metering". Archived from the original on 21 October 2012.
- ^ "Net Metering and Interconnection - NJ OCE Web Site". Archived from the original on 12 May 2012.
- ^ China Racing Ahead of America in the Drive to Go Solar. Archived 6 July 2013 at the Wayback Machine
- ^ "Power & Energy Technology - IHS Technology". Archived from the original on 2 January 2010.
- ^ Approved — Feed-in tariff in Israel Archived 3 June 2009 at the Wayback Machine
- ^ [1]
- ^ Wright, matthew; Hearps, Patrick; et al. Australian Sustainable Energy: Zero Carbon Australia Stationary Energy Plan Archived 24 November 2015 at the Wayback Machine, Energy Research Institute, University of Melbourne, October 2010, p. 33. Retrieved from BeyondZeroEmissions.org website.
- ^ Innovation in Concentrating Thermal Solar Power (CSP) Archived 24 September 2015 at the Wayback Machine, RenewableEnergyFocus.com website.
- ^ Ray Stern (10 October 2013). "Solana: 10 Facts You Didn't Know About the Concentrated Solar Power Plant Near Gila Bend". Phoenix New Times. Archived from the original on 11 October 2013.
- ^ Carr (1976), p. 85
- ^ "California produced so much solar power, electricity prices just turned negative". independent.co.uk. 11 April 2017. Archived from the original on 11 December 2017. Retrieved 30 April 2018.
- ^ Fares, Robert. "3 Reasons Hawaii Put the Brakes on Solar--and Why the Same Won't Happen in Your State". scientificamerican.com. Archived from the original on 20 September 2016. Retrieved 30 April 2018.
- ^ "Pumped Hydro Storage". Electricity Storage Association. Archived from the original on 21 June 2008. Retrieved 31 July 2008.
- ^ "Advantages of Using Molten Salt". Sandia National Laboratory. Archived from the original on 5 June 2011. Retrieved 29 September 2007.
- ^ "PV Systems and Net Metering". Department of Energy. Archived from the original on 4 July 2008. Retrieved 31 July 2008.
- ^ Joern Hoppmann; Jonas Volland; Tobias S. Schmidt; Volker H. Hoffmann (July 2014). "The Economic Viability of Battery Storage for Residential Solar Photovoltaic Systems - A Review and a Simulation Model". ETH Zürich, Harvard University. Archived from the original on 3 April 2015.
- ^ FORBES, Justin Gerdes, Solar Energy Storage About To Take Off In Germany and California Archived 29 July 2017 at the Wayback Machine, 18 July 2013
- ^ "Tesla launches Powerwall home battery with aim to revolutionize energy consumption". Associated Press. 1 May 2015. Archived from the original on 7 June 2015.
- ^ Converse, Alvin O. (2012). "Seasonal Energy Storage in a Renewable Energy System" (PDF). Proceedings of the IEEE. 100 (2): 401–409. doi:10.1109/JPROC.2011.2105231. S2CID 9195655. Archived from the original (PDF) on 8 November 2016. Retrieved 30 April 2018.
- ^ "The Combined Power Plant: the first stage in providing 100% power from renewable energy". SolarServer. January 2008. Archived from the original on 14 October 2008. Retrieved 10 October 2008.
- ^ Collings AF, Critchley C. Artificial Photosynthesis. From Basic Biology to Industrial Application. Wiley-VCH. Weinheim (2005) p. x ISBN 3-527-31090-8 doi:10.1002/3527606742.
- ^ Faunce, T. A.; Lubitz, W.; Rutherford, A. W. (Bill); MacFarlane, D.; Moore, G. F.; Yang, P.; Nocera, D. G; Moore, Tom A; Gregory, Duncan H; Fukuzumi, Shunichi; Yoon, Kyung B.; Armstrong, F. A.; Wasielewski, M. R.; Styring, S. (2013), "Energy and environment policy case for a global project on artificial photosynthesis", Energy & Environmental Science, 6 (3): 695–698, doi:10.1039/C3EE00063J, S2CID 97344491
- ^ a b c d Alsema, E.A.; Wild – Scholten, M.J. de; Fthenakis, V.M. Environmental impacts of PV electricity generation – a critical comparison of energy supply options Archived 6 March 2012 at the Wayback Machine ECN, September 2006; 7p. Presented at the 21st European Photovoltaic Solar Energy Conference and Exhibition, Dresden, Germany, 4–8 September 2006.
- ^ a b c Fridleifsson, Ingvar B.; Bertani, Ruggero; Huenges, Ernst; Lund, John W.; Ragnarsson, Arni; Rybach, Ladislaus (11 February 2008). O. Hohmeyer and T. Trittin (ed.). "The possible role and contribution of geothermal energy to the mitigation of climate change" (PDF). IPCC Scoping Meeting on Renewable Energy Sources, Luebeck, Germany: 59–80. Archived from the original (PDF) on 22 July 2011. Retrieved 6 April 2009. Cite journal requires
|journal=(help) - ^ Lund, John W. (June 2007). "Characteristics, Development and utilization of geothermal resources" (PDF). Geo-Heat Centre Quarterly Bulletin. 28 (2). Klamath Falls, Oregon: Oregon Institute of Technology. pp. 1–9. ISSN 0276-1084. Archived (PDF) from the original on 17 June 2010. Retrieved 16 April 2009.
- ^ "Portable Solar Panels". Portable Solar Panels for Sale. Archived from the original on 26 July 2012.
- ^ NREL, Life Cycle Greenhouse Gas Emissions from Electricity Generation Archived 28 March 2015 at the Wayback Machine, NREL/FS-6A20-57187, Jan 2013.
- ^ David D. Hsu and others, Life Cycle Greenhouse Gas Emissions of Crystalline Silicon Photovoltaic Electricity Generation: Systematic Review and Harmonization Archived 4 March 2016 at the Wayback Machine, 2011.
- ^ "Electric cars not solar panels, says Environment Commissioner". Parliamentary Commissioner for the Environment. 22 March 2016. Archived from the original on 3 April 2016. Retrieved 23 March 2016.
- ^ a b Flanakin, Duggan (15 September 2019). "The solar panel toxic waste problem". CFACT. Retrieved 18 June 2020.
- ^ "Photovoltaics Report" (PDF). Fraunhofer ISE. 28 July 2014. pp. 28–32. Archived (PDF) from the original on 9 August 2014. Retrieved 31 August 2014.
- ^ Andrew Blakers and Klaus Weber, "The Energy Intensity of Photovoltaic Systems" Archived 17 July 2012 at the Wayback Machine, Centre for Sustainable Energy Systems, Australian National University, 2000.
- ^ Peng, Jinqing; Lu, Lin; Yang, Hongxing (2013). "Review on lifecycle assessment of energy payback and greenhouse gas emission of solar photovoltaic systems". Renewable and Sustainable Energy Reviews. 19: 255–274, Fig. 5. doi:10.1016/j.rser.2012.11.035.
- ^ C. Reich-Weiser, D. Dornfeld, and S. Horne. Environmental assessment and metrics for solar: Case study of solfocus solar concentrator systems Archived 6 April 2013 at the Wayback Machine. UC Berkeley: Laboratory for Manufacturing and Sustainability, 8 May 2008.
- ^ Service Lifetime Prediction for Encapsulated Photovoltaic Cells/Minimodules Archived 4 March 2016 at the Wayback Machine, A.W. Czanderna and G.J. Jorgensen, National Renewable Energy Laboratory, Golden, CO.
- ^ Joshua Pearce and Andrew Lau, "Net Energy Analysis For Sustainable Energy Production From Silicon Based Solar Cells" Archived 15 September 2011 at Wikiwix, Proceedings of American Society of Mechanical Engineers Solar 2002: Sunrise on the Reliable Energy Economy, editor R. Campbell-Howe, 2002.
- ^ a b Meldrum, J.; Nettles-Anderson, S.; Heath, G.; MacKnick, J. (March 2013). "Life cycle water use for electricity generation: A review and harmonization of literature estimates". Environmental Research Letters. 8 (1): 015031. Bibcode:2013ERL.....8a5031M. doi:10.1088/1748-9326/8/1/015031.
- ^ Nathan Bracken and others, Concentrating Solar Power and Water Issues in the U.S. Southwest, National Renewable Energy Laboratory, Technical Report NREL/TP-6A50-61376, March 2015, p.10.
- ^ John Macknick and others, A Review of Operational Water Consumption and Withdrawal Factors for Electricity Generating Technologies Archived 6 April 2015 at the Wayback Machine, National Renewable Energy Laboratory, Technical Report NREL/TP-6A20-50900.
- ^ Utility-Scale Solar Power: Responsible Water Resource Management, Solar Energy Industries Association, 18 March 2010.
- ^ Concentrating Solar Power Commercial Application Study Archived 26 December 2017 at the Wayback Machine, US Department of Energy, 20 Feb. 2008.
- ^ John Macknick and others, A Review of Operational Water Consumption and Withdrawal Factors for Electricity Generating Technologies Archived 9 August 2017 at the Wayback Machine, NREL, Technical Report NREL/TP-6A20-50900.
- ^ Many newer power plants have cooling systems that Reuse Water Archived 26 December 2017 at the Wayback Machine, US EIA, 11 Feb. 2014.
- ^ Van Zalk, John; Behrens, Paul (1 December 2018). "The spatial extent of renewable and non-renewable power generation: A review and meta-analysis of power densities and their application in the U.S." Energy Policy. 123: 83–91. doi:10.1016/j.enpol.2018.08.023. ISSN 0301-4215.
- ^ "Low Capacity Factors: challenges for a low carbon energy transition". Energy Central. 6 July 2018. Retrieved 15 April 2021.
- ^ Diab, Khaled. "There are grounds for concern about solar power". www.aljazeera.com. Retrieved 15 April 2021.
- ^ Hertwich and others, "Integrated life-cycle assessment of electricity-supply scenarios confirms global environmental benefit of low-carbon technologies" Archived 23 November 2015 at the Wayback Machine, Proceedings of the National Academy of Sciences, 19 May 2015, v.112 n.20.
- ^ "UK's largest solar park granted consent despite major opposition | The Planner". www.theplanner.co.uk. Retrieved 21 March 2021.
- ^ Southworth, Phoebe (10 May 2020). "UK's largest solar farm could cause explosion on scale of small nuclear bomb, residents complain". The Telegraph. ISSN 0307-1235. Retrieved 21 March 2021.
- ^ Editor, Jonathan Leake, Environment. "UK's largest solar farm 'will destroy north Kent landscape'". The Times. ISSN 0140-0460. Retrieved 21 March 2021.CS1 maint: extra text: authors list (link)
- ^ Chesler, Caren (20 June 2016). "Going Solar Isn't Green if You Cut Down Tons of Trees". Slate Magazine. Retrieved 21 March 2021.
- ^ "Down to Earth: A choice: forests or solar panels?". 10 October 2018.
- ^ a b Werner, Jürgen H. (2 November 2011). "Toxic Substances In Photovoltaic Modules" (PDF). postfreemarket.net. Institute of Photovoltaics, University of Stuttgart, Germany - The 21st International Photovoltaic Science and Engineering Conference 2011 Fukuoka, Japan. p. 2. Archived from the original (PDF) on 21 December 2014. Retrieved 23 September 2014.
- ^ "CdTe PV: Real and Perceived EHS Risks" (PDF). bnl.gov. Archived (PDF) from the original on 27 June 2017. Retrieved 30 April 2018.
- ^ "Solar plant's downside? Birds igniting in midair". CBS News. 18 August 2014. Archived from the original on 19 August 2014.
- ^ "California's new solar power plant is actually a death ray that's incinerating birds mid-flight". ExtremeTech.com. 20 August 2014. Archived from the original on 19 October 2014.
- ^ Jake Richardson (22 August 2014). "Bird Deaths From Solar Plant Exaggerated By Some Media Sources". Cleantechnica.com.
- ^ "Renewable revolution will drive demand for critical minerals". RenewEconomy. 5 May 2021. Retrieved 5 May 2021.
- ^ "Clean energy demand for critical minerals set to soar as the world pursues net zero goals - News". IEA. Retrieved 5 May 2021.
- ^ Månberger, André; Stenqvist, Björn (1 August 2018). "Global metal flows in the renewable energy transition: Exploring the effects of substitutes, technological mix and development". Energy Policy. 119: 226–241. doi:10.1016/j.enpol.2018.04.056. ISSN 0301-4215.
- ^ "Fears over China's Muslim forced labor loom over EU solar power". POLITICO. 10 February 2021. Retrieved 15 April 2021.
- ^ MSU-CSET Participation Archive with notation in the Murray Ledger & Times
- ^ Layton, Julia (5 November 2008). "What is a luminescent solar concentrator?". Science.howstuffworks.com. Archived from the original on 10 March 2010. Retrieved 19 April 2011.
- ^ "Kyocera, partners announce construction of the world's largest floating solar PV Plant in Hyogo prefecture, Japan". SolarServer.com. 4 September 2014. Archived from the original on 24 September 2015.
- ^ "Running Out of Precious Land? Floating Solar PV Systems May Be a Solution". EnergyWorld.com. 7 November 2013. Archived from the original on 26 December 2014.
- ^ "Vikram Solar commissions India's first floating PV plant". SolarServer.com. 13 January 2015. Archived from the original on 2 March 2015.
- ^ "Sunflower Floating Solar Power Plant In Korea". CleanTechnica. 21 December 2014. Archived from the original on 15 May 2016.
- ^ "Napa Winery Pioneers Solar Floatovoltaics". Forbes. 18 April 2012. Archived from the original on 1 January 2012. Retrieved 31 May 2013.
- ^ "A look at a Chinese fishery with a giant integrated solar array – feeding a world hungry for clean energy". Electrek. 29 January 2017. Archived from the original on 29 January 2017. Retrieved 29 January 2017.
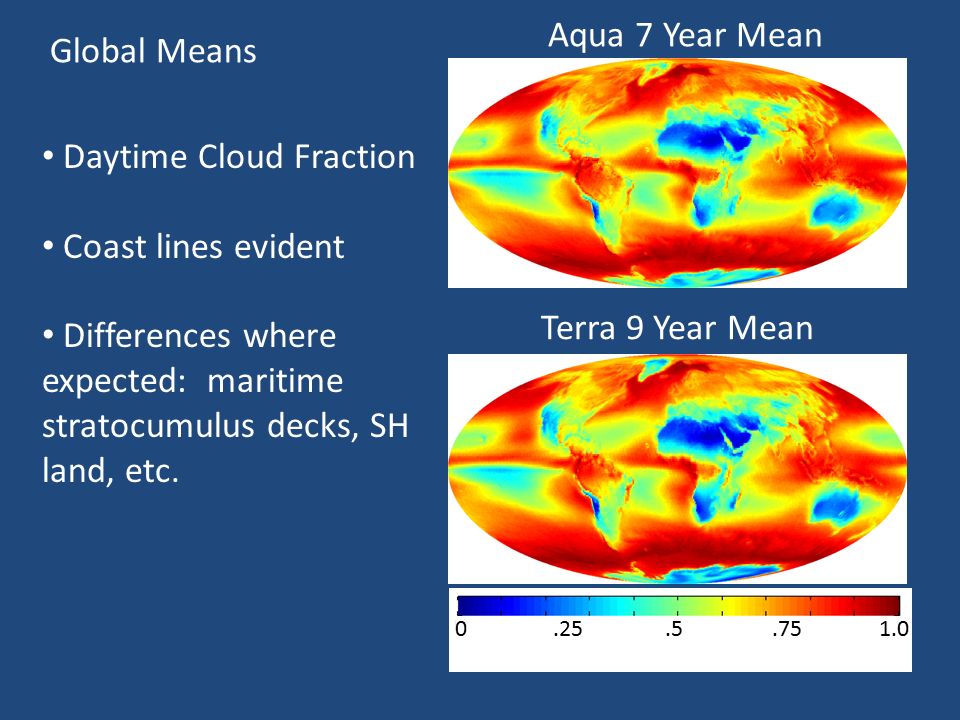
Sources
- Butti, Ken; Perlin, John (1981). A Golden Thread (2500 Years of Solar Architecture and Technology). Van Nostrand Reinhold. ISBN 978-0-442-24005-9.
- Carr, Donald E. (1976). Energy & the Earth Machine. W. W. Norton & Company. ISBN 978-0-393-06407-0.
- Halacy, Daniel (1973). The Coming Age of Solar Energy. Harper and Row. ISBN 978-0-380-00233-7.
- Martin, Christopher L.; Goswami, D. Yogi (2005). Solar Energy Pocket Reference. International Solar Energy Society. ISBN 978-0-9771282-0-4.
- Mills, David (2004). "Advances in solar thermal electricity technology". Solar Energy. 76 (1–3): 19–31. Bibcode:2004SoEn...76...19M. doi:10.1016/S0038-092X(03)00102-6.
- Perlin, John (1999). From Space to Earth (The Story of Solar Electricity). Harvard University Press. ISBN 978-0-674-01013-0.
- Tritt, T.; Böttner, H.; Chen, L. (2008). "Thermoelectrics: Direct Solar Thermal Energy Conversion". MRS Bulletin. 33 (4): 355–372. doi:10.1557/mrs2008.73.
- Yergin, Daniel (1991). The Prize: The Epic Quest for Oil, Money, and Power. Simon & Schuster. p. 885. ISBN 978-0-671-79932-8.
Further reading
| Library resources about Solar power |
- Sivaram, Varun (2018). Taming the Sun: Innovation to Harness Solar Energy and Power the Planet. Cambridge, MA: MIT Press. ISBN 978-0-262-03768-6.
External links
| Wikimedia Commons has media related to Solar power. |
Solar energy | |||||||||||||||||
|---|---|---|---|---|---|---|---|---|---|---|---|---|---|---|---|---|---|
| |||||||||||||||||
| Concepts |
|    | |||||||||||||||
| Solar power |
| ||||||||||||||||
| Distribution and uses |
| ||||||||||||||||
| Applications |
| ||||||||||||||||
| See also |
| ||||||||||||||||
| |||||||||||||||||
Photovoltaics | |||||||
|---|---|---|---|---|---|---|---|
| Concepts |
| ||||||
| Photovoltaic system |
| ||||||
| Applications | |||||||
| Generation systems |
| ||||||
| PV companies |
| ||||||
| |||||||
| Africa |
| ||||
|---|---|---|---|---|---|
| Asia |
| ||||
| Europe |
| ||||
| North America |
| ||||
| Oceania |
| ||||
| South America | |||||
| |||||
- Bright green environmentalism
- Solar power
- Energy conversion
- Sustainable energy
- Sun
- Renewable energy