Renewable energy in the Netherlands
Despite the historic usage of wind power to drain water and grind grain, the Netherlands today lags behind all other 27 EU countries in the production of energy from renewable sources. In 2019, the Netherlands produced just 8.6% of its total energy from renewables.[1] According to the most recent statistics published by the EU, it is the last among the EU countries in the shift away from global warming energy sources.[2] The leading renewable sources in the country are biomass, wind, solar and both geothermal and aerothermal power (mostly from ground source and air source heat pumps). In 2018 decisions were taken to replace natural gas as the main energy source in the Netherlands with increased electrification being a major part of this process.[3]
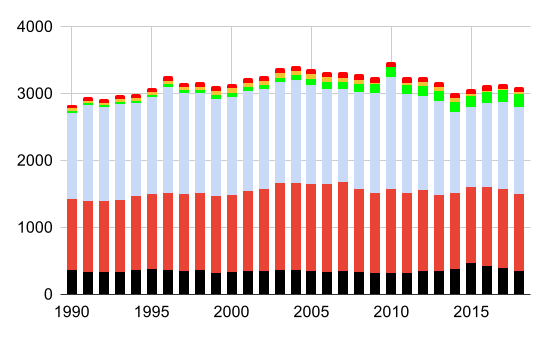
Coal Oil
Gas Renewable Electricity
NuclearThe low take up of renewable energy may be partially explained by the flat and often sub-sea level landscape and subsequent limits to hydropower resources, although hydro poor resource countries such as Denmark have still managed to make renewables the focus of their energy needs. In 2015, Dutch wind turbines had a total nameplate capacity of 3,431 MW.[4] As of 2017, a number of large offshore windfarms have either come online (Gemini wind farm) or have been granted authorisation (Borssele 1 and 2, and Borssele 3 and 4 wind farms). The total capacity of these windfarms is 11 GW.[5] Most of the tiny contribution made to electricity generation by hydroelectricity came from three power plants.
A large part of the renewable electricity sold in the Netherlands comes from Norway, a country which generates almost all its electricity from hydropower plants. In the Netherlands, household consumers can choose to buy renewable electricity. The amount of renewable energy used by household users has been steadily increasing, rising from 38% in 2008[6] to 69% in 2017.[7]
One area in which the Netherlands is a relative leader is in the adoption of electric plug in vehicles. In 2019 PEV vehicles in the Netherlands represented 15% of car sales,[8] making it the world's second highest share after Norway. Electric vehicles are able to run on renewable electricity with zero emissions and have the potential to provide grid power storage facilities.[9]
Energy consumption by sector[]
Projected total gross final energy consumption by sector in 2020.
All EU countries as well as Iceland and Norway submitted National Renewable Energy Action Plans (NREAPs)[10] to outline the steps taken, and projected progress by each country between 2010 and 2020 to meet the Renewable Energy Directive targets for each country. Each plan contains a detailed breakdown of each country's current renewable energy usage and plans for future developments. According to projections by the Dutch submission in 2020 the gross final energy consumption in the Netherlands by sector breaks down as follows:
| Projected energy use by sector in 2020[10] | ktoe | RE 2020 target |
|---|---|---|
| Heating and cooling | 24,989 | 8.7% |
| Electricity | 11,681 | 37.0% |
| Transport | 10,634 | 10.3% |
| Gross final energy consumption* | 52,088 | 14.5% |
*After adjustments.
Using the unadjusted NREAP data approximately half of energy consumption (52.8%) is used in the heating and cooling sector. The heating and cooling sector (also known as the thermal sector) includes domestic heating and air conditioning, industrial processes such as furnaces and any use of heat generally. The next largest share is the electricity sector at 24.7%, followed by the transport sector at 22.5%. Total annual energy consumption before adjustments for aviation is projected to be 52,088 ktoe (52.million tonnes of oil equivalent) by 2020. In order to meet the Netherlands overall target for 14.5% (or 14% using the slightly different renewable energy directive calculation methodology) use of renewable energy in Gross final energy consumption by 2020 (it was just 2.5% in 2005) targets have been set for each sector. Renewable energy targets for the year 2020 by sector are: 8.7% in the heating and cooling sector, 37% in the electricity sector and 10.3% in the transport sector.[10]
Recent trends in renewable energy[]
The Netherlands has a minimum target of 14% of renewable energy use by 2020. The sectoral targets for 2020 break down into national targets of 8.7% in the heating and cooling sector, 37% in the electricity sector and 10.3% in the transport sector although these figures may be slightly different from those implied by the minimum trajectory path.[11] The following table shows the actual results recorded of renewable energy use by sector:
| 2009 | 2010 | 2011 | 2012 | 2013 | 2014 | 2015 | 2016 | 2017[13] | 2018[14] | |
|---|---|---|---|---|---|---|---|---|---|---|
| Heating and cooling sector | 3.4% | 3.1% | 3.7% | 3.9% | 4.1% | 5.2% | 5.5% | 5.5% | 5.9% | 6.1% |
| Electricity sector | 9.1% | 9.6% | 9.8% | 10.4% | 10.0% | 10.0% | 11.1% | 12.5% | 13.8% | 15.1% |
| Transport sector | 4.5% | 3.3% | 4.8% | 4.9% | 5.1% | 6.2% | 5.3% | 4.6% | 5.9% | 9.6% |
| TOTAL | 4.3% | 3.9% | 4.5% | 4.7% | 4.8% | 5.5% | 5.8% | 6.0% | 6.6% | 7.4% |
Actual overall renewable energy use grew from 4.3% in 2009 to 5.5% by 2014. The minimum trajectory planned for 2013-2014 was 5.9% and for 2015-2016 7.6% of total energy use. The Netherlands is regarded as amongst the most likely countries to miss 2020 national renewable energy targets as outlined by the Renewable Energy Directive.
Renewable electricity[]
Percentage of electricity generated from renewables:

The main sources of renewable electricity are from biomass and wind power. Solar power has increased rapidly in recent years.
Sources[]
| Year | Cumulative capacity (in MW) |
|---|---|
| 2001 | 481
|
| 2002 | 682
|
| 2003 | 908
|
| 2004 | 1,078
|
| 2005 | 1,224
|
| 2006 | 1,561
|
| 2007 | 1,749
|
| 2008 | 2,149
|
| 2009 | 2,225
|
| 2010 | 2,218
|
| 2011 | 2,272
|
| 2012 | 2,391
|
| 2013 | 2,713
|
| 2014 | 2,865
|
| 2015 | 3,431
|
| 2016 | 4,328
|
| 2017 | 4,341
|
| 2018 | 4,471
|
Wind power[]
2016 was a record year for new wind turbine installations totalling 887 MW bringing the totalled installed capacity to 4,328 MW by year end. 691 MW of the new installations were offshore.[16] The Dutch government has a target of 6,000 MW of onshore wind power by 2020 and 4,450 MW of offshore wind power by 2023.[17]
In 2017, the Netherlands had 2294 wind turbines. The wind capacity installed at end 2017 will, in a normal wind year, produced 9% of electricity, when the equivalent value for Germany was 16.1%[16] and Portugal 14%.[18]
Solar power[]
By 2017 year end cumulative installed capacity of solar PV power reached a preliminary estimate of 2,749 MW with 700 MW added in that year alone.[19] Whilst the Netherlands saw its capacity grow by the fourth highest in Europe during 2017 its installed capacity per inhabitant remained relatively low at 160.9 Watts per inhabitant compared to the European average of 208.3 Watts per inhabitant.[19]
Biomass[]
Sources of biomass in the Netherlands include the biogenic fraction of waste that is burned in waste incineration plants. Waste wood is also collected for use in the Netherlands and other EU countries. Manure is used to produce biogas and wood pellets are co-fired in electricity plants. 590 kton of pellets were imported, mostly from the United States of America and around 140 kton from Dutch sources contributing 12 to 13 PJ of primary energy to co-firing in energy plants in 2013–2014. Biofuels are produced in the Netherlands for both domestic and export markets.[20]
Rapeseed and corn crops were hardly used in 2014 to produce biofuels in Holland with reasons cited being the high price of corn and resistance to using food crops for fuel production. Rapeseed is used for well over 1% of the imported biofuels (biodiesel) while corn is used for 11% (bioethanol). Germany was the largest supplier of rape seed in 2014 (53%), followed by Romania (13%). For corn the largest supplier in 2014 was Ukraine (39%), followed by France (24%). Some maize fodder is fermented for biofuel production in Holland.[20]
| Electricity | Heat | Transport | Total | |
|---|---|---|---|---|
| Waste incineration plants | 7 473 | 11 053 | 18 526 | |
| Co-firing of biomass in power stations | 6 531 | 417 | 6 948 | |
| Decentralised electricity production from solid biomass and bioliquid | 3 904 | 1 436 | 5 340 | |
| Total biomass boilers for heating in businesses | 5 474 | 5 474 | ||
| - Wood-fired boilers for heating in businesses | 4 038 | 4 038 | ||
| - Non-wood-fired boilers for heating in businesses | 1 436 | 1 436 | ||
| Total biomass in domestic use | 17 910 | 17 910 | ||
| - Wood-burning stoves for domestic use | 17 640 | 17 640 | ||
| - Charcoal for domestic consumption | 270 | 270 | ||
| Total biogas | 3 741 | 5 794 | 1 | 9 535 |
| - Biogas from landfills | 222 | 233 | 0 | 455 |
| - Biogas from wastewater treatment plants | 699 | 1 341 | - | 2 040 |
| - Biogas, co-firing of manure | 1 891 | 1 798 | - | 3 689 |
| - Other biogas | 929 | 2 422 | 1 | 3 351 |
| Total liquid biofuels for transport | *802 | 12 122 | 12 924 | |
| - Bioethanol | 5 210 | 5 210 | ||
| - Biodiesel | *802 | 6 912 | 7 714 | |
| Total biomass | 21 649 | 42 886 | 12 123 | 76 657 |
| -
*The consumption of biofuels for mobile vehicles in the construction and farming sectors are assigned to the heat sector due to statistical definitions. | ||||
Biomass produced 76,657 TJ of energy for final consumption in 2013. The largest share was destined for the heat sector at 42,886TJ followed by the electricity sector at 21, 649T J and then the transport sector with 12,123TJ.
Hydroelectricity[]
Due to its flat landscape the Netherlands has only very limited hydroelectric resources. In 2014 hydroelectricity produced just 112 Gwh of power out of a total electricity production from all sources of 103,418 GWh.[21]
Heat Pumps[]
− An interesting source of heat recovery used in the Netherlands is sourced from freshly milked milk, or warm milk. However at 0.3% of total renewable energy production[22] (2010 figures) this source is not likely to accelerate energy transition in the country. Warm milk is still not mentioned in the EU Renewable Energy Directive, nor in international energy statistics and so is not included is gross final consumption figures. It does however provide Dutch farmers with plenty of hot water.
− In 2010, 740,000 dairy cows (about half of the country's total) provided 277 TJ of heat energy avoiding 18,000 tons of CO2 emissions.[22] According to industry sources for every litre of milk cooled, 0.7 litres of warm water is produced. Water pumped through the plate heat exchanger reaches 50 °C to 55 °C. The energy recovered from 1000 litres of milk per day over a year generates heat equal to: 13,100 kWh of electrical energy, 1,900 litres of oil, 1,650 m³ of natural gas or 950 kg of propane gas.[23]
Climate change[]
According to the ex Prime Minister Jan Peter Balkenende, the Netherlands use annually 1–1.5 billion € (0.3% of national income) to protect against the risks of the sea level rise. Many areas are under sea level in the Netherlands and are protected by dam and dikes.[24] The Netherlands supported in 2010 raising the European Union emission restrictions from 20% to 30%; however, the Netherlands has only committed to reaching the minimum 14% goal for itself.[22]
Historical trends[]
Early development in overall renewable energy[]
Total renewable energy use was just 1.1% of overall energy use in 1990. This increased to 7.4% in 2018. The electricity sector first overtook the heating and cooling sector in 2005 in terms of total renewable energy use.
| Renewable energy in the Netherlands (by use, in TWh)[22] | |||||||||
|---|---|---|---|---|---|---|---|---|---|
| 1990 | 1995 | 2000 | 2005 | 2006 | 2007 | 2008 | 2009 | 2010 | |
| Electricity | 0.81 | 1.4 | 2.86 | 7.44 | 7.86 | 7.33 | 9.22 | 10.8 | 11.7 |
| Heat | 5.00 | 5.25 | 5.28 | 6.86 | 7.56 | 8.08 | 8.67 | 9.36 | 9.61 |
| Transport | 0 | 0 | 0 | 0.03 | 0.50 | 3.61 | 3.33 | 4.33 | 2.67 |
| Total | 5.81 | 6.69 | 8.17 | 14.3 | 15.9 | 19.0 | 21.2 | 24.5 | 24.0 |
| Renewable percent of total use |
1.1% | 1.2% | 1.4% | 2.3% | 2.6% | 3.1% | 3.4% | 4.1% | 3.7% |
| Note: Rounding errors may be present due to conversion from original source reported in PJ | |||||||||
See also[]
| Wikimedia Commons has media related to Renewable energy in the Netherlands. |
- Wind power in the Netherlands
- Solar power in the Netherlands
- Hydroelectric power in the Netherlands
- Electricity sector in the Netherlands
- Energy in the Netherlands
External links[]
- European Commission National Renewable Energy Action Plans
- European Commission renewable energy Progress Reports
- European Commission National Energy Efficiency Action Plans
References[]
- ^ "Verbruik hernieuwbare energie met 16 procent gegroeid". CBS. 2020-05-29. Retrieved 2020-10-06.
- ^ Renewable energy statistics European Commission, januari 2020
- ^ "PHOTOVOLTAIC POWER SYSTEMS PROGRAMME ANNUAL REPORT 2018, p91".
- ^ Wind in power: 2015 European statistics, Wind Europe, accessed May 29, 2016
- ^ "Windenergie op zee". Retrieved 2020-10-05.
- ^ "Autoriteit Consument & Markt" (PDF).
- ^ "Groene stroom". Retrieved 2020-10-05.
- ^ "Statistics Electric Vehicles in the Netherlands" (PDF). Netherlands Enterprise Agency. Retrieved 26 January 2020.
- ^ "Goedkoopste energie? Kies de goedkoopste energieleverancier. Gratis!". Energievergelijking.nl (in Dutch). Retrieved 2 November 2016.
- ^ Jump up to: a b c "National Renewable Energy Action Plans, Directive 2009/28/EC".
- ^ "The Netherlands, National Renewable Energy Action Plan. pg. 27".
- ^ "Progress report, Energy from renewable sources in the Netherlands 2015–2016".
- ^ "Eurostat - Energy from renewable sources".
- ^ "Eurostat - Energy from renewable sources".
- ^ GWEC Global Wind Report 2017
- ^ Jump up to: a b "GLOBAL WIND REPORT 2016 | GWEC". www.gwec.net. Retrieved 2018-08-21.
- ^ "GLOBAL WIND REPORT 2015 | GWEC". www.gwec.net. Retrieved 2016-08-11.
- ^ Wind in power 2010 European statistics Archived 2011-04-07 at the Wayback Machine EWEA February 2011 page 11
- ^ Jump up to: a b "Photovoltaic Barometer 2018".
- ^ Jump up to: a b c "2015 Progress Report, Dutch Ministry of Economic Affairs".
- ^ "International Energy Agency/Statistics/Netherlands/Electricity and Heat for 2014".
- ^ Jump up to: a b c d Renewable Energy in the Netherlands 2010, Statistics Netherlands, 2010
- ^ "DeLaval.com".
- ^ Alankomaissa sata miljardia euroa kuluu merenpinnan nousun estämiseen yle 03.09.2008
| hide | |||||
|---|---|---|---|---|---|
| Africa | |||||
| Asia | |||||
| Europe |
| ||||
| North America | |||||
| Oceania | |||||
| South America | |||||
| |||||
- Renewable energy in the Netherlands