F-score
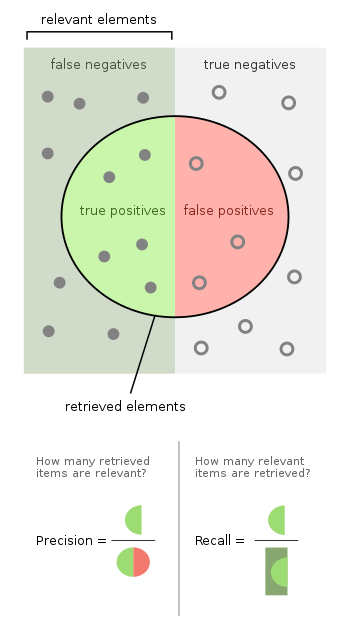
In statistical analysis of binary classification, the F-score or F-measure is a measure of a test's accuracy. It is calculated from the precision and recall of the test, where the precision is the number of true positive results divided by the number of all positive results, including those not identified correctly, and the recall is the number of true positive results divided by the number of all samples that should have been identified as positive. Precision is also known as positive predictive value, and recall is also known as sensitivity in diagnostic binary classification.
The F1 score is the harmonic mean of the precision and recall. The more generic score applies additional weights, valuing one of precision or recall more than the other.

The highest possible value of an F-score is 1.0, indicating perfect precision and recall, and the lowest possible value is 0, if either the precision or the recall is zero. The F1 score is also known as the Sørensen–Dice coefficient or Dice similarity coefficient (DSC).[citation needed]
Contents
Etymology[]
The name F-measure is believed to be named after a different F function in Van Rijsbergen's book, when introduced to the Fourth Message Understanding Conference (MUC-4, 1992).[1]
Definition[]
This section needs additional citations for verification. (December 2018) |
The traditional F-measure or balanced F-score (F1 score) is the harmonic mean of precision and recall:
- .

[]
A more general F score, , that uses a positive real factor β, where β is chosen such that recall is considered β times as important as precision, is:
- .

In terms of Type I and type II errors this becomes:
- .

Two commonly used values for β are 2, which weighs recall higher than precision, and 0.5, which weighs recall lower than precision.
The F-measure was derived so that "measures the effectiveness of retrieval with respect to a user who attaches β times as much importance to recall as precision".[2] It is based on Van Rijsbergen's effectiveness measure
- .

Their relationship is where .


Diagnostic testing[]
This is related to the field of binary classification where recall is often termed "sensitivity".
| Predicted condition | Sources: [3][4][5][6][7][8][9][10] | ||||
| Total population = P + N |
Positive (PP) | Negative (PN) | Informedness, bookmaker informedness (BM) = TPR + TNR − 1 |
Prevalence threshold (PT) = √TPR × FPR − FPR/TPR − FPR | |
| Positive (P) | True positive (TP), hit |
False negative (FN), type II error, miss, underestimation |
True positive rate (TPR), recall, sensitivity (SEN), probability of detection, hit rate, power = TP/P = 1 − FNR |
False negative rate (FNR), miss rate = FN/P = 1 − TPR | |
| Negative (N) | False positive (FP), type I error, false alarm, overestimation |
True negative (TN), correct rejection |
False positive rate (FPR), probability of false alarm, fall-out = FP/N = 1 − TNR |
True negative rate (TNR), specificity (SPC), selectivity = TN/N = 1 − FPR | |
| Prevalence = P/P + N |
Positive predictive value (PPV), precision = TP/PP = 1 − FDR |
False omission rate (FOR) = FN/PN = 1 − NPV |
Positive likelihood ratio (LR+) = TPR/FPR |
Negative likelihood ratio (LR−) = FNR/TNR | |
| Accuracy (ACC) = TP + TN/P + N | False discovery rate (FDR) = FP/PP = 1 − PPV |
Negative predictive value (NPV) = TN/PN = 1 − FOR | Markedness (MK), deltaP (Δp) = PPV + NPV − 1 |
Diagnostic odds ratio (DOR) = LR+/LR− | |
| Balanced accuracy (BA) = TPR + TNR/2 | F1 score = 2 PPV × TPR/PPV + TPR = 2 TP/2 TP + FP + FN |
Fowlkes–Mallows index (FM) = √PPV×TPR | Matthews correlation coefficient (MCC) = √TPR×TNR×PPV×NPV − √FNR×FPR×FOR×FDR |
Threat score (TS), critical success index (CSI), Jaccard index = TP/TP + FN + FP | |

Dependence of the F-score on class imbalance[]
Williams[11] has shown the explicit dependence of the precision-recall curve, and thus the score, on the ratio of positive to negative test cases. This means that comparison of the F-score across different problems with differing class ratios is problematic. One way to address this issue (see e.g., Siblini et al, 2020[12] ) is to use a standard class ratio when making such comparisons.


Applications[]
The F-score is often used in the field of information retrieval for measuring search, document classification, and query classification performance.[13] Earlier works focused primarily on the F1 score, but with the proliferation of large scale search engines, performance goals changed to place more emphasis on either precision or recall[14] and so is seen in wide application.
The F-score is also used in machine learning.[15] However, the F-measures do not take true negatives into account, hence measures such as the Matthews correlation coefficient, Informedness or Cohen's kappa may be preferred to assess the performance of a binary classifier.[16]
The F-score has been widely used in the natural language processing literature,[17] such as in the evaluation of named entity recognition and word segmentation.
Criticism[]
David Hand and others criticize the widespread use of the F1 score since it gives equal importance to precision and recall. In practice, different types of mis-classifications incur different costs. In other words, the relative importance of precision and recall is an aspect of the problem.[18]
According to Davide Chicco and Giuseppe Jurman, the F1 score is less truthful and informative than the Matthews correlation coefficient (MCC) in binary evaluation classification.[19]
David Powers has pointed out that F1 ignores the True Negatives and thus is misleading for unbalanced classes, while kappa and correlation measures are symmetric and assess both directions of predictability - the classifier predicting the true class and the true class predicting the classifier prediction, proposing separate multiclass measures Informedness and Markedness for the two directions, noting that their geometric mean is correlation.[20]
Difference from Fowlkes–Mallows index[]
While the F-measure is the harmonic mean of recall and precision, the Fowlkes–Mallows index is their geometric mean.[21]
Extension to multi-class classification[]
The F-score is also used for evaluating classification problems with more than two classes (Multiclass classification). In this setup, the final score is obtained by micro-averaging (biased by class frequency) or macro-averaging (taking all classes as equally important). For macro-averaging, two different formulas have been used by applicants: the F-score of (arithmetic) class-wise precision and recall means or the arithmetic mean of class-wise F-scores, where the latter exhibits more desirable properties.[22]
See also[]
- BLEU
- Confusion matrix
- Hypothesis tests for accuracy
- METEOR
- NIST (metric)
- Receiver operating characteristic
- ROUGE (metric)
- Uncertainty coefficient, aka Proficiency
- Word error rate
- LEPOR
References[]
- ^ Sasaki, Y. (2007). "The truth of the F-measure" (PDF).
- ^ Van Rijsbergen, C. J. (1979). Information Retrieval (2nd ed.). Butterworth-Heinemann.
- ^ Fawcett, Tom (2006). "An Introduction to ROC Analysis" (PDF). Pattern Recognition Letters. 27 (8): 861–874. doi:10.1016/j.patrec.2005.10.010.
- ^ Piryonesi S. Madeh; El-Diraby Tamer E. (2020-03-01). "Data Analytics in Asset Management: Cost-Effective Prediction of the Pavement Condition Index". Journal of Infrastructure Systems. 26 (1): 04019036. doi:10.1061/(ASCE)IS.1943-555X.0000512.
- ^ Powers, David M. W. (2011). "Evaluation: From Precision, Recall and F-Measure to ROC, Informedness, Markedness & Correlation". Journal of Machine Learning Technologies. 2 (1): 37–63.
- ^ Ting, Kai Ming (2011). Sammut, Claude; Webb, Geoffrey I. (eds.). Encyclopedia of machine learning. Springer. doi:10.1007/978-0-387-30164-8. ISBN 978-0-387-30164-8.
- ^ Brooks, Harold; Brown, Barb; Ebert, Beth; Ferro, Chris; Jolliffe, Ian; Koh, Tieh-Yong; Roebber, Paul; Stephenson, David (2015-01-26). "WWRP/WGNE Joint Working Group on Forecast Verification Research". Collaboration for Australian Weather and Climate Research. World Meteorological Organisation. Retrieved 2019-07-17.
- ^ Chicco D, Jurman G (January 2020). "The advantages of the Matthews correlation coefficient (MCC) over F1 score and accuracy in binary classification evaluation". BMC Genomics. 21 (1): 6-1–6-13. doi:10.1186/s12864-019-6413-7. PMC 6941312. PMID 31898477.
- ^ Chicco D, Toetsch N, Jurman G (February 2021). "The Matthews correlation coefficient (MCC) is more reliable than balanced accuracy, bookmaker informedness, and markedness in two-class confusion matrix evaluation". BioData Mining. 14 (13): 1-22. doi:10.1186/s13040-021-00244-z. PMC 7863449. PMID 33541410.
- ^ Tharwat A. (August 2018). "Classification assessment methods". Applied Computing and Informatics. doi:10.1016/j.aci.2018.08.003.
- ^ Williams, Christopher K. I. (2021). "The Effect of Class Imbalance on Precision-Recall Curves". Neural Computation. 33 (4): 853–857. doi:10.1162/neco_a_01362.
- ^ Siblini, W.; Fréry, J.; He-Guelton, L.; Oblé, F.; Wang, Y. Q. (2020). "Master your metrics with calibration". In M. Berthold; A. Feelders; G. Krempl (eds.). Advances in Intelligent Data Analysis XVIII. Springer. pp. 457–469. arXiv:1909.02827. doi:10.1007/978-3-030-44584-3_36.
- ^ Beitzel., Steven M. (2006). On Understanding and Classifying Web Queries (Ph.D. thesis). IIT. CiteSeerX 10.1.1.127.634.
- ^ X. Li; Y.-Y. Wang; A. Acero (July 2008). Learning query intent from regularized click graphs. Proceedings of the 31st SIGIR Conference. doi:10.1145/1390334.1390393. S2CID 8482989.
- ^ See, e.g., the evaluation of the [1].
- ^ Powers, David M. W (2015). "What the F-measure doesn't measure". arXiv:1503.06410 [cs.IR].
- ^ Derczynski, L. (2016). Complementarity, F-score, and NLP Evaluation. Proceedings of the International Conference on Language Resources and Evaluation.
- ^ Hand, David. "A note on using the F-measure for evaluating record linkage algorithms - Dimensions". app.dimensions.ai. doi:10.1007/s11222-017-9746-6. hdl:10044/1/46235. S2CID 38782128. Retrieved 2018-12-08.
- ^ Chicco D, Jurman G (January 2020). "The advantages of the Matthews correlation coefficient (MCC) over F1 score and accuracy in binary classification evaluation". BMC Genomics. 21 (6): 6. doi:10.1186/s12864-019-6413-7. PMC 6941312. PMID 31898477.
- ^ Powers, David M W (2011). "Evaluation: From Precision, Recall and F-Score to ROC, Informedness, Markedness & Correlation". Journal of Machine Learning Technologies. 2 (1): 37–63. hdl:2328/27165.
- ^ Tharwat A (August 2018). "Classification assessment methods". Applied Computing and Informatics (ahead-of-print). doi:10.1016/j.aci.2018.08.003.
- ^ J. Opitz; S. Burst (2019). "Macro F1 and Macro F1". arXiv:1911.03347 [stat.ML].
- Statistical natural language processing
- Evaluation of machine translation
- Statistical ratios
- Summary statistics for contingency tables
- Clustering criteria