Fort Rouge (electoral district)
 | |||
| Provincial electoral district | |||
| Legislature | Legislative Assembly of Manitoba | ||
| MLA |
New Democratic | ||
| District created | 1957 | ||
| First contested | 1958 | ||
| Last contested | 2019 | ||
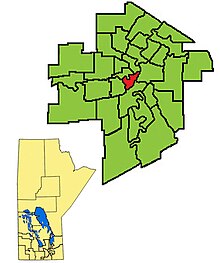
Fort Rouge is a provincial electoral division in the Canadian province of Manitoba. It was created by redistribution in 1957, and formally came into existence in the general election of 1958. The riding was eliminated in 1989, and re-established in 1999. It is located in the central section of the City of Winnipeg.
Fort Rouge is bordered on the east by St. Boniface, to the south by Fort Garry-Riverview, to the north by Logan, and to the west by River Heights. The actual Legislative Assembly of Manitoba building is located across the river from Fort Rouge.
The riding's population in 1996 was 20,364. In 1999, the average family income was $49,361, and the unemployment rate was 8.70%. 39.6% of Fort Rouge's residents are listed as low-income, the sixth-highest rate in the province. Almost 80% of occupied dwelling are rentals, and over 20% of households are single-parent families. Almost 25% of Fort Rouge's residents have a university degree—one of the highest rates in the province.
Fort Rouge has an immigrant population of 20%. Eight per cent of the riding's residents are aboriginal. The service sector accounts for 21% of Fort Rouge's industry, with a further 11% in social services.
The seat was held by the Progressive Conservatives from 1958 to 1973, and was a rare bastion of Liberal strength in the province from 1973 to 1981. Lloyd Axworthy was the riding's representative from 1973 to 1979; for a time, he was the only Liberal in the legislature.
In recent years the Liberal Party have been the main challengers to the NDP and the Liberal Leader, Rana Bokhari ran here for the 2016 provincial election, where she lost to the NDP star candidate Wab Kinew. At the 2015 federal election, according to Elections Canada data, Fort Rouge voted heavily Liberal.[1]
The district is represented by NDP leader Wab Kinew.
List of provincial representatives[]
| Name | Party | Took Office | Left Office |
|---|---|---|---|
| Gurney Evans | PC | 1958 | 1969 |
| Inez Trueman | PC | 1969 | 1973 |
| Lloyd Axworthy | Lib | 1973 | 1979 |
| June Westbury | Lib | 1979 | 1981 |
| Roland Penner | NDP | 1981 | 1988 |
| Jim Carr | Lib | 1988 | 1990 |
| See Broadway, Osborne, Crescentwood (1990-1999) | |||
| Tim Sale | NDP | 1999 | 2007 |
| Jennifer Howard | NDP | 2007 | 2016 |
| Wab Kinew | NDP | 2016 | present |
Opinion polls[]
| Polling Firm | Last Date of Polling | Link | NDP | Liberal | PC | Green | Other |
|---|---|---|---|---|---|---|---|
| Mainstreet Research/Postmedia | March 22, 2016 | HTML | 29 | 32 | 30 | 8 |
Electoral results[]
| 2019 Manitoba general election | ||||||||
|---|---|---|---|---|---|---|---|---|
| Party | Candidate | Votes | % | ±% | Expenditures | |||
| New Democratic | Wab Kinew | 5,055 | 51.0 | +13.4 | $23,922.64 | |||
| Progressive Conservative | Edna Nabess | 1,857 | 18.7 | -10.1 | $7,290.07 | |||
| Green | James Beddome | 1,580 | 15.9 | +4.9 | $8,974.33 | |||
| Liberal | Cyndy Friesen | 1,290 | 13.0 | -7.1 | $8,223.63 | |||
| Manitoba | Michael McCracken | 54 | 0.5 | -1.5 | $582.58 | |||
| Independent | Bradley Hebert | 30 | 0.3 | -0.2 | $0.00 | |||
| Total valid votes | 100.0 | |||||||
| Total rejected ballots | 30 | |||||||
| Turnout | 9,913 | |||||||
| Eligible voters | 16,870 | |||||||
| Source: Elections Manitoba[2] | ||||||||
| 2016 Manitoba general election | ||||||||
|---|---|---|---|---|---|---|---|---|
| Party | Candidate | Votes | % | ±% | Expenditures | |||
| New Democratic | Wab Kinew | 3,360 | 37.63 | –13.32 | $39,199.49 | |||
| Progressive Conservative | Audrey Gordon | 2,571 | 28.80 | +8.76 | $42,245.54 | |||
| Liberal | Rana Bokhari | 1,792 | 20.07 | –2.92 | $30,238.82 | |||
| Green | Grant Sharp | 983 | 11.01 | +5.60 | $322.90 | |||
| Manitoba | Matthew Ostrove | 175 | 1.96 | – | $945.26 | |||
| Communist | Paula Ducharme | 47 | 0.53 | – | $33.67 | |||
| Total valid votes/Expense limit | 8,928 | 100.0 | $44,855.00 | |||||
| Total rejected and declined ballots | 125 | 1.38 | ||||||
| Turnout | 9,053 | 65.15 | ||||||
| Eligible voters | 13,896 | |||||||
| New Democratic hold | Swing | –11.04 | ||||||
| Source: Elections Manitoba[3][4][5] | ||||||||
| 2011 Manitoba general election | ||||||||
|---|---|---|---|---|---|---|---|---|
| Party | Candidate | Votes | % | ±% | Expenditures | |||
| New Democratic | Jennifer Howard | 4,501 | 50.95 | +3.98 | $28,361.23 | |||
| Liberal | Paul Hesse | 2,031 | 22.99 | −7.54 | $31,673.03 | |||
| Progressive Conservative | Sonny Dominique | 1,770 | 20.04 | +5.29 | $17,369.18 | |||
| Green | Stephen Weedon | 478 | 5.41 | −0.86 | $24.14 | |||
| Total valid votes | 8,780 | |||||||
| Rejected and declined votes | 54 | |||||||
| Turnout | 8834 | 61.22% | ||||||
| Electors on the lists | 14429 | |||||||
| Source: Elections Manitoba[6] | ||||||||
| 2007 Manitoba general election | ||||||||
|---|---|---|---|---|---|---|---|---|
| Party | Candidate | Votes | % | ±% | Expenditures | |||
| New Democratic | Jennifer Howard | 3,828 | 46.97 | −10.66 | $25.968.04 | |||
| Liberal | Paul Hesse | 2,488 | 30.53 | +13.57 | $23,866.84 | |||
| Progressive Conservative | Christine Waddell | 1,202 | 14.75 | −4.97 | $11,369.89 | |||
| Green | Gerald H. Enns | 511 | 6.27 | +1.34 | $905.51 | |||
| Independent | Ron Nash | 92 | 1.13 | +1.13 | $261.98 | |||
| Communist | Frank Komarniski | 29 | 0.36 | +.36 | ||||
| Total valid votes | 8,150 | 100.00 | ||||||
| Rejected and declined votes | 53 | |||||||
| Turnout | 8,203 | 62.29 | +7.64 | |||||
| Electors on the lists | 13,169 | |||||||
| Source: Elections Manitoba[7] | ||||||||
| 2003 Manitoba general election | ||||||||
|---|---|---|---|---|---|---|---|---|
| Party | Candidate | Votes | % | ±% | Expenditures | |||
| New Democratic | Tim Sale | 4,118 | 57.63 | +9.21 | $16,724.33 | |||
| Progressive Conservative | Mike Francis | 1,409 | 19.72 | −10.51 | $8,860.98 | |||
| Liberal | David Henteleff | 1,212 | 16.96 | −2.07 | $4,299.83 | |||
| Green | Mikel Magnusson | 355 | 4.93 | +3.14 | $48.24 | |||
| Libertarian | Jim Weidman | 51 | 0.71 | $0.00 | ||||
| Total valid votes | 7,145 | 100.00 | ||||||
| Rejected and declined votes | 59 | |||||||
| Turnout | 7,204 | 54.65 | −15.94 | |||||
| Electors on the lists | 13,182 | |||||||
| 1999 Manitoba general election | ||||||||
|---|---|---|---|---|---|---|---|---|
| Party | Candidate | Votes | % | Expenditures | ||||
| New Democratic | Tim Sale | 4,759 | 48.42 | $25,152.00 | ||||
| Progressive Conservative | Ron Paley | 2,971 | 30.23 | $26,322.65 | ||||
| Liberal | John Shanski | 1,870 | 19.03 | $24,461.96 | ||||
| Green | Alex Reid | 176 | 1.79 | $256.65 | ||||
| Total valid votes | 9,776 | 99.47 | ||||||
| Rejected and declined votes | 52 | |||||||
| Turnout | 9,828 | 70.59 | ||||||
| Electors on the lists | 13,923 | |||||||
| Source: Elections Manitoba[8] | ||||||||
| 1988 Manitoba general election | ||||||||
|---|---|---|---|---|---|---|---|---|
| Party | Candidate | Votes | % | ±% | ||||
| Liberal | Jim Carr | 5,127 | 48.91 | |||||
| New Democratic | Roland Penner | 2,912 | 27.78 | |||||
| Progressive Conservative | Robert Haier | 2,303 | 21.97 | |||||
| Progressive | Gordon Pratt | 75 | ||||||
| Libertarian | Dennis Owens | 66 | ||||||
| Total valid votes | 10,483 | 100.00 | ||||||
| Rejected ballots | 50 | – | – | |||||
| Turnout | 10,533 | 69.95 | ||||||
| Eligible voters | 15,057 | |||||||
| Source: Elections Manitoba[9] | ||||||||
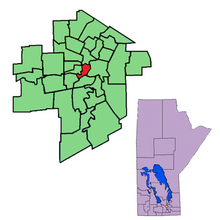
Previous boundaries[]
References[]
- ^ CBC "2015 federal election: How did your Manitoba neighbours vote?" 2 March 2016
- ^ "2019 Voting Area Maps and Station-by-Station Results" (PDF). Elections Manitoba. Retrieved June 27, 2020.
- ^ "Candidates: 41st General Election". Elections Manitoba. March 29, 2016. Retrieved March 31, 2016.
- ^ "41st General Election Official Results" (PDF). Elections Manitoba. 2016. Retrieved September 16, 2016.
- ^ "Election Returns: 41st General Election". Elections Manitoba. 2016. Retrieved August 23, 2018.
- ^ "Election Returns: 40th General Election". Elections Manitoba. 2011. Retrieved August 23, 2018.
- ^ "Fort Rouge — SUMMARY OF OFFICIAL RESULTS".
- ^ "Summary of Electoral Results - 1999 General Election".
- ^ "Candidates: 34th General Election" (PDF). Elections Manitoba. April 26, 1988. Retrieved October 2, 2018.
- Manitoba provincial electoral districts
- Politics of Winnipeg
- Fort Rouge, Winnipeg