Lac du Bonnet (electoral district)
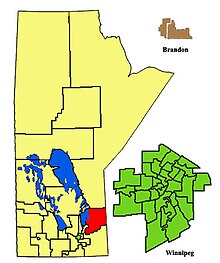 The 2011 – boundaries for Lac du Bonnet highlighted in red | |||
| Provincial electoral district | |||
| Legislature | Legislative Assembly of Manitoba | ||
| MLA |
Progressive Conservative | ||
| District created | 1957 | ||
| First contested | 1958 | ||
| Last contested | 2019 | ||
| Demographics | |||
| Population (2008) | 19,645 | ||
| Electors (2007) | 14,132 | ||
Lac du Bonnet is a provincial electoral division in the Canadian province of Manitoba. It was created by redistribution in 1957, and has formally existed since the provincial election of 1958. It is a relatively large constituency, located to the northeast of Winnipeg.
Lac du Bonnet is bordered to the west by Selkirk and Springfield, to the south by La Verendrye, to the north by Rupertsland and to the east by the Ontario border. Communities in the riding include Lac Du Bonnet, Pinawa, Beausejour (known as the birthplace of Edward Schreyer) and Whitemouth.
The riding is currently regarded as a Progressive Conservative/New Democratic Party marginal. The Tories have held the seat since 1988, though they retained it by only a narrow majority in 2003.
Demographics[]
The riding's population in 1996 was 20,035. In 1999, the average family income was $45,693, and the unemployment rate was 9.00%. There are a number of diverse economic communities in the riding, including farming, forestry and nuclear research. The service sector accounted for 12% of the riding's industry in 1999, followed by 10% in health and social services.
Lac Du Bonnet is an ethnically diverse riding. Eighteen per cent of the riding's residents are aboriginal, along with 9% German and 6% Ukrainian. Six per cent of the riding's residents are francophone.
List of provincial representatives[]
This riding has elected the following MLAs:
| Parliament | Years | Member | Party | |
|---|---|---|---|---|
| Riding created from Rupertsland, St. Clements, and Springfield | ||||
| 22nd | 1958–1959 | A.A. Trapp | Liberal-Progressive | |
| 23rd | 1959–1962 | Oscar Bjornson | Progressive Conservative | |
| 24th | 1962–1966 | |||
| 25th | 1966–1969 | |||
| 26th | 1969–1973 | Sam Uskiw | New Democratic | |
| 27th | 1973–1977 | |||
| 28th | 1977–1981 | |||
| 29th | 1981–1986 | |||
| 30th | 1986–1988 | Clarence Baker | ||
| 31st | 1988–1990 | Darren Praznik | Progressive Conservative | |
| 32nd | 1990–1995 | |||
| 33rd | 1995–1999 | |||
| 34th | 1999–2002 | |||
| 2002–2003 | Gerald Hawranik | |||
| 35th | 2003–2007 | |||
| 36th | 2007–2011 | |||
| 37th | 2011–2016 | Wayne Ewasko | ||
| 38th | 2016–2019 | |||
| 39th | 2019- | |||
Electoral results[]
| 2019 Manitoba general election | ||||||||
|---|---|---|---|---|---|---|---|---|
| Party | Candidate | Votes | % | ±% | Expenditures | |||
| Progressive Conservative | Wayne Ewasko | 6,170 | 66.09 | -11.38 | $23,226.73 | |||
| New Democratic | Sidney Klassen | 1,793 | 19.21 | -3.31 | $1,256.85 | |||
| Liberal | Terry Hayward | 1,373 | 14.71 | New | $4,507.33 | |||
| Total valid votes | 100.0 | |||||||
| Total rejected ballots | ||||||||
| Turnout | ||||||||
| Eligible voters | ||||||||
| 2016 Manitoba general election | ||||||||
|---|---|---|---|---|---|---|---|---|
| Party | Candidate | Votes | % | ±% | Expenditures | |||
| Progressive Conservative | Wayne Ewasko | 5,666 | 77.47 | +22.53 | $ | |||
| New Democratic | Wendy Sol | 1,647 | 22.52 | -14.22 | $ | |||
| Total valid votes/Expense limit | 7,313 | 100.0 | $43037.00 | |||||
| Eligible voters | – | |||||||
| Source: Elections Manitoba[1] | ||||||||
| 2011 Manitoba general election | ||||||||
|---|---|---|---|---|---|---|---|---|
| Party | Candidate | Votes | % | ±% | Expenditures | |||
| Progressive Conservative | Wayne Ewasko | 4,266 | 54.94 | −3.87 | $20,568.00 | |||
| New Democratic | Elana Spence | 2,853 | 36.74 | +3.23 | $13,574.10 | |||
| Liberal | Charlett Millen | 351 | 4.52 | −2.81 | $2,966.68 | |||
| Green | Dan Green | 295 | 3.80 | – | $1,517.95 | |||
| Total valid votes | 8,011 | |||||||
| Rejected and declined votes | 24 | |||||||
| Turnout | 8,035 | 58.04 | ||||||
| Registered voters | 13,844 | |||||||
| Source: Elections Manitoba[2] | ||||||||
| 2007 Manitoba general election | ||||||||
|---|---|---|---|---|---|---|---|---|
| Party | Candidate | Votes | % | ±% | Expenditures | |||
| Progressive Conservative | Gerald Hawranik | 4,866 | 58.81 | +7.56 | $24,695.70 | |||
| New Democratic | Patrick O'Connor | 2,773 | 33.51 | −11.83 | $11,782.23 | |||
| Liberal | Christopher Gmiterek | 607 | 7.33 | +3.94 | $340.29 | |||
| Total valid votes | 8,246 | 99.67 | ||||||
| Rejected and declined votes | 27 | |||||||
| Turnout | 8,273 | 58.54 | ||||||
| Registered voters | 14,132 | |||||||
| 2003 Manitoba general election | ||||||||
|---|---|---|---|---|---|---|---|---|
| Party | Candidate | Votes | % | ±% | Expenditures | |||
| Progressive Conservative | Gerald Hawranik | 4,380 | 51.25 | $17415.31 | ||||
| NDP | Michael Hameluck | 3,875 | 45.34 | $34330.87 | ||||
| Liberal | Cheryl Appleyard | 290 | 3.39 | $239.00 | ||||
| Source: Elections Manitoba[5] | ||||||||
| Manitoba provincial by-election, March 12, 2002 | ||||||||
|---|---|---|---|---|---|---|---|---|
| Party | Candidate | Votes | % | ±% | Expenditures | |||
| Progressive Conservative | Gerald Hawranik | 3,398 | 40.9 | |||||
| NDP | Michael Hameluck | 3,234 | 38.9 | |||||
| Liberal | George Harbottle | 1,647 | 19.8 | |||||
| 1999 Manitoba general election | ||||||||
|---|---|---|---|---|---|---|---|---|
| Party | Candidate | Votes | % | Expenditures | ||||
| Progressive Conservative | Darren Praznik | 4,835 | 50.44% | $26,804.49 | ||||
| New Democratic | Michael Hameluck | 4,686 | 48.89% | $29,666.00 | ||||
| Total valid votes | 9,521 | |||||||
| Rejected and declined votes | 64 | |||||||
| Turnout | 9,585 | 66.56 | ||||||
| Registered voters | 14,397 | |||||||
| 1986 Manitoba general election: Lac du Bonnet | ||||||||
|---|---|---|---|---|---|---|---|---|
| Party | Candidate | Votes | % | ±% | ||||
| New Democratic | Clarence Baker | 3,903 | 46.12 | |||||
| Progressive Conservative | Darren Praznik | 3,601 | 42.55 | |||||
| Liberal | Jerry Fontaine | 959 | 11.33 | |||||
| Total valid votes | 8,463 | 100.00 | ||||||
| Rejected ballots | 17 | |||||||
| Turnout | 8,480 | 73.94 | ||||||
| Electors on the lists | 11,469 | |||||||
Previous boundaries[]

References[]
- ^ "Candidates: 41st General Election". Elections Manitoba. March 29, 2016. Retrieved March 31, 2016.
- ^ "Election Returns: 40th General Election". Elections Manitoba. 2011. Retrieved September 13, 2018.
- ^ "Archived copy". Archived from the original on March 21, 2012. Retrieved November 24, 2010.
{{cite web}}: CS1 maint: archived copy as title (link) – 2007 results - ^ "41ST GENERAL ELECTION, APRIL 19, 2016 – OFFICIAL RESULTS". Elections Manitoba. April 19, 2016. Retrieved November 10, 2016.
- ^ "Election Returns: 38th General Election". Elections Manitoba. 2003. Retrieved September 16, 2018.
- ^ "Archived copy". Archived from the original on August 7, 2011. Retrieved August 10, 2010.
{{cite web}}: CS1 maint: archived copy as title (link) – 1999 Results

- Manitoba provincial electoral districts