Gel electrophoresis
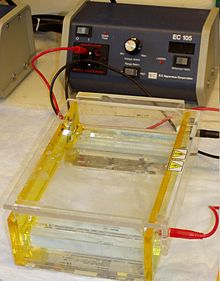 Gel electrophoresis apparatus – an agarose gel is placed in this buffer-filled box and an electrical current is applied via the power supply to the rear. The negative terminal is at the far end (black wire), so DNA migrates toward the positively charged anode (red wire). | |
| Classification | Electrophoresis |
|---|---|
| Other techniques | |
| Related | Capillary electrophoresis SDS-PAGE Two-dimensional gel electrophoresis Temperature gradient gel electrophoresis |
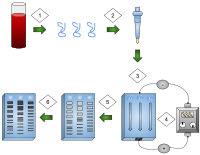
1) DNA is extracted.
2) Isolation and amplification of DNA.
3) DNA added to the gel wells.
4) Electric current applied to the gel.
5) DNA bands are separated by size.
6) DNA bands are stained.
Gel electrophoresis is a method for separation and analysis of macromolecules (DNA, RNA and proteins) and their fragments, based on their size and charge. It is used in clinical chemistry to separate proteins by charge or size (IEF agarose, essentially size independent) and in biochemistry and molecular biology to separate a mixed population of DNA and RNA fragments by length, to estimate the size of DNA and RNA fragments or to separate proteins by charge.[1]
Nucleic acid molecules are separated by applying an electric field to move the negatively charged molecules through a matrix of agarose or other substances. Shorter molecules move faster and migrate farther than longer ones because shorter molecules migrate more easily through the pores of the gel. This phenomenon is called sieving.[2] Proteins are separated by the charge in agarose because the pores of the gel are too small to sieve proteins. Gel electrophoresis can also be used for the separation of nanoparticles.
Gel electrophoresis uses a gel as an anticonvective medium or sieving medium during electrophoresis, the movement of a charged particle in an electrical current. Gels suppress the thermal convection caused by the application of the electric field, and can also act as a sieving medium, retarding the passage of molecules; gels can also simply serve to maintain the finished separation so that a post electrophoresis stain can be applied.[3] DNA Gel electrophoresis is usually performed for analytical purposes, often after amplification of DNA via polymerase chain reaction (PCR), but may be used as a preparative technique prior to use of other methods such as mass spectrometry, RFLP, PCR, cloning, DNA sequencing, or Southern blotting for further characterization.
Physical basis[]
Electrophoresis is a process that enables the sorting of molecules based on size. Using an electric field, molecules (such as DNA) can be made to move through a gel made of agarose or polyacrylamide. The electric field consists of a negative charge at one end which pushes the molecules through the gel, and a positive charge at the other end that pulls the molecules through the gel. The molecules being sorted are dispensed into a well in the gel material. The gel is placed in an electrophoresis chamber, which is then connected to a power source. When the electric field is applied, the larger molecules move more slowly through the gel while the smaller molecules move faster. The different sized molecules form distinct bands on the gel.[4]
The term "gel" in this instance refers to the matrix used to contain, then separate the target molecules. In most cases, the gel is a crosslinked polymer whose composition and porosity are chosen based on the specific weight and composition of the target to be analyzed. When separating proteins or small nucleic acids (DNA, RNA, or oligonucleotides) the gel is usually composed of different concentrations of acrylamide and a cross-linker, producing different sized mesh networks of polyacrylamide. When separating larger nucleic acids (greater than a few hundred bases), the preferred matrix is purified agarose. In both cases, the gel forms a solid, yet porous matrix. Acrylamide, in contrast to polyacrylamide, is a neurotoxin and must be handled using appropriate safety precautions to avoid poisoning. Agarose is composed of long unbranched chains of uncharged carbohydrates without cross-links resulting in a gel with large pores allowing for the separation of macromolecules and macromolecular complexes.[5]
Electrophoresis refers to the electromotive force (EMF) that is used to move the molecules through the gel matrix. By placing the molecules in wells in the gel and applying an electric field, the molecules will move through the matrix at different rates, determined largely by their mass when the charge-to-mass ratio (Z) of all species is uniform. However, when charges are not all uniform the electrical field generated by the electrophoresis procedure will cause the molecules to migrate differentially according to charge. Species that are net positively charged will migrate towards the cathode which is negatively charged (because this is an electrolytic rather than galvanic cell), whereas species that are net negatively charged will migrate towards the positively charged anode. Mass remains a factor in the speed with which these non-uniformly charged molecules migrate through the matrix toward their respective electrodes.[6]
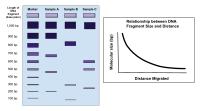
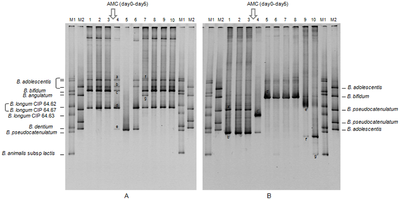
If several samples have been loaded into adjacent wells in the gel, they will run parallel in individual lanes. Depending on the number of different molecules, each lane shows the separation of the components from the original mixture as one or more distinct bands, one band per component. Incomplete separation of the components can lead to overlapping bands, or indistinguishable smears representing multiple unresolved components.[citation needed] Bands in different lanes that end up at the same distance from the top contain molecules that passed through the gel at the same speed, which usually means they are approximately the same size. There are molecular weight size markers available that contain a mixture of molecules of known sizes. If such a marker was run on one lane in the gel parallel to the unknown samples, the bands observed can be compared to those of the unknown to determine their size. The distance a band travels is approximately inversely proportional to the logarithm of the size of the molecule.[citation needed]
There are limits to electrophoretic techniques. Since passing a current through a gel causes heating, gels may melt during electrophoresis. Electrophoresis is performed in buffer solutions to reduce pH changes due to the electric field, which is important because the charge of DNA and RNA depends on pH, but running for too long can exhaust the buffering capacity of the solution. There are also limitations in determining the molecular weight by SDS-PAGE, especially when trying to find the MW of an unknown protein. Certain biological variables are difficult or impossible to minimize and can affect electrophoretic migration. Such factors include protein structure, post-translational modifications, and amino acid composition. For example, tropomyosin is an acidic protein that migrates abnormally on SDS-PAGE gels. This is because the acidic residues are repelled by the negatively charged SDS, leading to an inaccurate mass-to-charge ratio and migration.[7] Further, different preparations of genetic material may not migrate consistently with each other, for morphological or other reasons.
Types of gel[]
The types of gel most typically used are agarose and polyacrylamide gels. Each type of gel is well-suited to different types and sizes of the analyte. Polyacrylamide gels are usually used for proteins and have very high resolving power for small fragments of DNA (5-500 bp). Agarose gels, on the other hand, have lower resolving power for DNA but have a greater range of separation, and are therefore used for DNA fragments of usually 50–20,000 bp in size, but the resolution of over 6 Mb is possible with pulsed field gel electrophoresis (PFGE).[8] Polyacrylamide gels are run in a vertical configuration while agarose gels are typically run horizontally in a submarine mode. They also differ in their casting methodology, as agarose sets thermally, while polyacrylamide forms in a chemical polymerization reaction.
Agarose[]

Agarose gels are made from the natural polysaccharide polymers extracted from seaweed. Agarose gels are easily cast and handled compared to other matrices because the gel setting is a physical rather than chemical change. Samples are also easily recovered. After the experiment is finished, the resulting gel can be stored in a plastic bag in a refrigerator.
Agarose gels do not have a uniform pore size, but are optimal for electrophoresis of proteins that are larger than 200 kDa.[9] Agarose gel electrophoresis can also be used for the separation of DNA fragments ranging from 50 base pair to several megabases (millions of bases)[citation needed], the largest of which require specialized apparatus. The distance between DNA bands of different lengths is influenced by the percent agarose in the gel, with higher percentages requiring longer run times, sometimes days. Instead high percentage agarose gels should be run with a pulsed field electrophoresis (PFE), or .
"Most agarose gels are made with between 0.7% (good separation or resolution of large 5–10kb DNA fragments) and 2% (good resolution for small 0.2–1kb fragments) agarose dissolved in electrophoresis buffer. Up to 3% can be used for separating very tiny fragments but a vertical polyacrylamide gel is more appropriate in this case. Low percentage gels are very weak and may break when you try to lift them. High percentage gels are often brittle and do not set evenly. 1% gels are common for many applications."[10]
Polyacrylamide[]
Polyacrylamide gel electrophoresis (PAGE) is used for separating proteins ranging in size from 5 to 2,000 kDa due to the uniform pore size provided by the polyacrylamide gel. Pore size is controlled by modulating the concentrations of acrylamide and bis-acrylamide powder used in creating a gel. Care must be used when creating this type of gel, as acrylamide is a potent neurotoxin in its liquid and powdered forms.
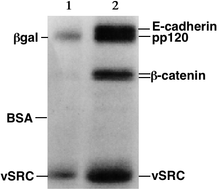
Traditional DNA sequencing techniques such as Maxam-Gilbert or Sanger methods used polyacrylamide gels to separate DNA fragments differing by a single base-pair in length so the sequence could be read. Most modern DNA separation methods now use agarose gels, except for particularly small DNA fragments. It is currently most often used in the field of immunology and protein analysis, often used to separate different proteins or isoforms of the same protein into separate bands. These can be transferred onto a nitrocellulose or PVDF membrane to be probed with antibodies and corresponding markers, such as in a western blot.
Typically are made in 6%, 8%, 10%, 12% or 15%. Stacking gel (5%) is poured on top of the resolving gel and a gel comb (which forms the wells and defines the lanes where proteins, sample buffer, and ladders will be placed) is inserted. The percentage chosen depends on the size of the protein that one wishes to identify or probe in the sample. The smaller the known weight, the higher the percentage that should be used. Changes in the buffer system of the gel can help to further resolve proteins of very small sizes.[11]
Starch[]
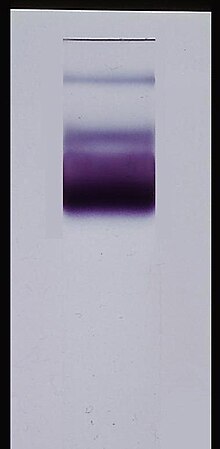
Partially hydrolysed potato starch makes for another non-toxic medium for protein electrophoresis. The gels are slightly more opaque than acrylamide or agarose. Non-denatured proteins can be separated according to charge and size. They are visualised using Napthal Black or Amido Black staining. Typical starch gel concentrations are 5% to 10%.[12][13][14]
Gel conditions[]
Denaturing[]
Denaturing gels are run under conditions that disrupt the natural structure of the analyte, causing it to unfold into a linear chain. Thus, the mobility of each macromolecule depends only on its linear length and its mass-to-charge ratio. Thus, the secondary, tertiary, and quaternary levels of biomolecular structure are disrupted, leaving only the primary structure to be analyzed.
Nucleic acids are often denatured by including urea in the buffer, while proteins are denatured using sodium dodecyl sulfate, usually as part of the SDS-PAGE process. For full denaturation of proteins, it is also necessary to reduce the covalent disulfide bonds that stabilize their tertiary and quaternary structure, a method called reducing PAGE. Reducing conditions are usually maintained by the addition of beta-mercaptoethanol or dithiothreitol. For a general analysis of protein samples, reducing PAGE is the most common form of protein electrophoresis.
Denaturing conditions are necessary for proper estimation of molecular weight of RNA. RNA is able to form more intramolecular interactions than DNA which may result in change of its electrophoretic mobility. Urea, DMSO and glyoxal are the most often used denaturing agents to disrupt RNA structure. Originally, highly toxic methylmercury hydroxide was often used in denaturing RNA electrophoresis,[15] but it may be method of choice for some samples.[16]
Denaturing gel electrophoresis is used in the DNA and RNA banding pattern-based methods temperature gradient gel electrophoresis (TGGE)[17] and denaturing gradient gel electrophoresis (DGGE).[18]
Native[]
Native gels are run in non-denaturing conditions so that the analyte's natural structure is maintained. This allows the physical size of the folded or assembled complex to affect the mobility, allowing for analysis of all four levels of the biomolecular structure. For biological samples, detergents are used only to the extent that they are necessary to lyse lipid membranes in the cell. Complexes remain—for the most part—associated and folded as they would be in the cell. One downside, however, is that complexes may not separate cleanly or predictably, as it is difficult to predict how the molecule's shape and size will affect its mobility. Addressing and solving this problem is a major aim of quantitative native PAGE.
Unlike denaturing methods, native gel electrophoresis does not use a charged denaturing agent. The molecules being separated (usually proteins or nucleic acids) therefore differ not only in molecular mass and intrinsic charge, but also the cross-sectional area, and thus experience different electrophoretic forces dependent on the shape of the overall structure. For proteins, since they remain in the native state they may be visualized not only by general protein staining reagents but also by specific enzyme-linked staining.
A specific experiment example of an application of native gel electrophoresis is to check for enzymatic activity to verify the presence of the enzyme in the sample during protein purification. For example, for the protein alkaline phosphatase, the staining solution is a mixture of 4-chloro-2-2methylbenzenediazonium salt with 3-phospho-2-naphthoic acid-2'-4'-dimethyl aniline in Tris buffer. This stain is commercially sold as a kit for staining gels. If the protein is present, the mechanism of the reaction takes place in the following order: it starts with the de-phosphorylation of 3-phospho-2-naphthoic acid-2'-4'-dimethyl aniline by alkaline phosphatase (water is needed for the reaction). The phosphate group is released and replaced by an alcohol group from water. The electrophile 4- chloro-2-2 methylbenzenediazonium (Fast Red TR Diazonium salt) displaces the alcohol group forming the final product Red Azo dye. As its name implies, this is the final visible-red product of the reaction. In undergraduate academic experimentation of protein purification, the gel is usually run next to commercial purified samples to visualize the results and conclude whether or not purification was successful.[20]
Native gel electrophoresis is typically used in proteomics and metallomics. However, native PAGE is also used to scan genes (DNA) for unknown mutations as in Single-strand conformation polymorphism.
Buffers[]
Buffers in gel electrophoresis are used to provide ions that carry a current and to maintain the pH at a relatively constant value. These buffers have plenty of ions in them, which is necessary for the passage of electricity through them. Something like distilled water or benzene contains few ions, which is not ideal for the use in electrophoresis.[21] There are a number of buffers used for electrophoresis. The most common being, for nucleic acids Tris/Acetate/EDTA (TAE), Tris/Borate/EDTA (TBE). Many other buffers have been proposed, e.g. lithium borate, which is rarely used, based on Pubmed citations (LB), isoelectric histidine, pK matched goods buffers, etc.; in most cases the purported rationale is lower current (less heat) matched ion mobilities, which leads to longer buffer life. Borate is problematic; Borate can polymerize, or interact with cis diols such as those found in RNA. TAE has the lowest buffering capacity but provides the best resolution for larger DNA. This means a lower voltage and more time, but a better product. LB is relatively new and is ineffective in resolving fragments larger than 5 kbp; However, with its low conductivity, a much higher voltage could be used (up to 35 V/cm), which means a shorter analysis time for routine electrophoresis. As low as one base pair size difference could be resolved in 3% agarose gel with an extremely low conductivity medium (1 mM Lithium borate).[22]
Most SDS-PAGE protein separations are performed using a "discontinuous" (or DISC) buffer system that significantly enhances the sharpness of the bands within the gel. During electrophoresis in a discontinuous gel system, an ion gradient is formed in the early stage of electrophoresis that causes all of the proteins to focus on a single sharp band in a process called isotachophoresis. Separation of the proteins by size is achieved in the lower, "resolving" region of the gel. The resolving gel typically has a much smaller pore size, which leads to a sieving effect that now determines the electrophoretic mobility of the proteins.
Visualization[]
After the electrophoresis is complete, the molecules in the gel can be stained to make them visible. DNA may be visualized using ethidium bromide which, when intercalated into DNA, fluoresce under ultraviolet light, while protein may be visualised using silver stain or Coomassie Brilliant Blue dye. Other methods may also be used to visualize the separation of the mixture's components on the gel. If the molecules to be separated contain radioactivity, for example in a DNA sequencing gel, an autoradiogram can be recorded of the gel. Photographs can be taken of gels, often using a Gel Doc system.
Downstream processing[]
After separation, an additional separation method may then be used, such as isoelectric focusing or SDS-PAGE. The gel will then be physically cut, and the protein complexes extracted from each portion separately. Each extract may then be analysed, such as by peptide mass fingerprinting or de novo peptide sequencing after in-gel digestion. This can provide a great deal of information about the identities of the proteins in a complex.
Applications[]
- Estimation of the size of DNA molecules following restriction enzyme digestion, e.g. in restriction mapping of cloned DNA.
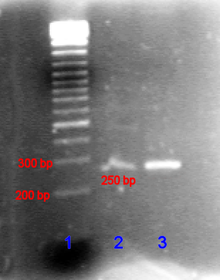
- Analysis of PCR products, e.g. in molecular genetic diagnosis or genetic fingerprinting
- Separation of restricted genomic DNA prior to Southern transfer, or of RNA prior to Northern transfer.
Gel electrophoresis is used in forensics, molecular biology, genetics, microbiology and biochemistry. The results can be analyzed quantitatively by visualizing the gel with UV light and a gel imaging device. The image is recorded with a computer-operated camera, and the intensity of the band or spot of interest is measured and compared against standard or markers loaded on the same gel. The measurement and analysis are mostly done with specialized software.
Depending on the type of analysis being performed, other techniques are often implemented in conjunction with the results of gel electrophoresis, providing a wide range of field-specific applications.
Nucleic acids[]
In the case of nucleic acids, the direction of migration, from negative to positive electrodes, is due to the naturally occurring negative charge carried by their sugar-phosphate backbone.[23]
Double-stranded DNA fragments naturally behave as long rods, so their migration through the gel is relative to their size or, for cyclic fragments, their radius of gyration. Circular DNA such as plasmids, however, may show multiple bands, the speed of migration may depend on whether it is relaxed or supercoiled. Single-stranded DNA or RNA tends to fold up into molecules with complex shapes and migrate through the gel in a complicated manner based on their tertiary structure. Therefore, agents that disrupt the hydrogen bonds, such as sodium hydroxide or formamide, are used to denature the nucleic acids and cause them to behave as long rods again.[24]
Gel electrophoresis of large DNA or RNA is usually done by agarose gel electrophoresis. See the "Chain termination method" page for an example of a polyacrylamide DNA sequencing gel. Characterization through ligand interaction of nucleic acids or fragments may be performed by mobility shift affinity electrophoresis.
Electrophoresis of RNA samples can be used to check for genomic DNA contamination and also for RNA degradation. RNA from eukaryotic organisms shows distinct bands of 28s and 18s rRNA, the 28s band being approximately twice as intense as the 18s band. Degraded RNA has less sharply defined bands, has a smeared appearance, and the intensity ratio is less than 2:1.
Proteins[]
Proteins, unlike nucleic acids, can have varying charges and complex shapes, therefore they may not migrate into the polyacrylamide gel at similar rates, or all when placing a negative to positive EMF on the sample. Proteins, therefore, are usually denatured in the presence of a detergent such as sodium dodecyl sulfate (SDS) that coats the proteins with a negative charge.[3] Generally, the amount of SDS bound is relative to the size of the protein (usually 1.4g SDS per gram of protein), so that the resulting denatured proteins have an overall negative charge, and all the proteins have a similar charge-to-mass ratio. Since denatured proteins act like long rods instead of having a complex tertiary shape, the rate at which the resulting SDS coated proteins migrate in the gel is relative only to its size and not its charge or shape.[3]
Proteins are usually analyzed by sodium dodecyl sulfate polyacrylamide gel electrophoresis (SDS-PAGE), by native gel electrophoresis, by preparative gel electrophoresis (QPNC-PAGE), or by 2-D electrophoresis.
Characterization through ligand interaction may be performed by electroblotting or by affinity electrophoresis in agarose or by capillary electrophoresis as for estimation of binding constants and determination of structural features like glycan content through lectin binding.
Nanoparticles[]
A novel application for gel electrophoresis is to separate or characterize metal or metal oxide nanoparticles (e.g. Au, Ag, ZnO, SiO2) regarding the size, shape, or surface chemistry of the nanoparticles. The scope is to obtain a more homogeneous sample (e.g. narrower particle size distribution), which then can be used in further products/processes (e.g. self-assembly processes). For the separation of nanoparticles within a gel, the particle size about the mesh size is the key parameter, whereby two migration mechanisms were identified: the unrestricted mechanism, where the particle size << mesh size, and the restricted mechanism, where particle size is similar to mesh size.[25]
History[]
- 1930s – first reports of the use of sucrose for gel electrophoresis
- 1955 – introduction of starch gels, mediocre separation (Smithies)[13]
- 1959 – introduction of acrylamide gels; disc electrophoresis (Ornstein and Davis); accurate control of parameters such as pore size and stability; and (Raymond and Weintraub)
- 1966 – first use of agar gels[26]
- 1969 – introduction of denaturing agents especially SDS separation of protein subunit (Weber and Osborn)[27]
- 1970 – Laemmli separated 28 components of T4 phage using a stacking gel and SDS
- 1972 – agarose gels with ethidium bromide stain[28]
- 1975 – 2-dimensional gels (O’Farrell); isoelectric focusing then SDS gel electrophoresis
- 1977 – sequencing gels
- 1983 – pulsed field gel electrophoresis enables separation of large DNA molecules
- 1983 – introduction of capillary electrophoresis
- 2004 – introduction of a standardized time of polymerization of acrylamide gels enables clean and predictable separation of native proteins (Kastenholz)[29]
A 1959 book on electrophoresis by Milan Bier cites references from the 1800s.[30] However, Oliver Smithies made significant contributions. Bier states: "The method of Smithies ... is finding wide application because of its unique separatory power." Taken in context, Bier clearly implies that Smithies' method is an improvement.
See also[]
References[]
- ^ Kryndushkin DSTer-Avanesyan MD, Kushnirov VV (2003). "Yeast [PSI+] prion aggregates are formed by small Sup35 polymers fragmented by Hsp104". Journal of Biological Chemistry. 278 (49): 49636–43. doi:10.1074/jbc.M307996200. PMID 14507919.
- ^ Sambrook J, Russel DW (2001). Molecular Cloning: A Laboratory Manual 3rd Ed. Cold Spring Harbor Laboratory Press. Cold Spring Harbor, NY.
- ^ Jump up to: a b c Berg JM, Tymoczko JL, Stryer L (2002). Biochemistry (5th ed.). WH Freeman. ISBN 978-0-7167-4955-4.
- ^ Hofmann, Andreas; Clokie, Samuel, eds. (19 April 2018). Wilson and Walker's Principles and Techniques of Biochemistry and Molecular Biology. Great Britain: Cambridge University Press. ISBN 9781316614761.
- ^ Boyer, Rodney F. (20 August 2000). Modern Experimental Biochemistry. US: Pearson, 3rd edition. ISBN 978-0805331110.
- ^ Robyt, John F.; White, Bernard J. (1990). Biochemical Techniques Theory and Practice. Waveland Press. ISBN 978-0-88133-556-9.
- ^ "Molecular Weight Determination by SDS-PAGE" (PDF). www.bio-rad.com.
- ^ Tom Maniatis; E. F. Fritsch; Joseph Sambrook (1982). "Chapter 5, protocol 1". Molecular Cloning - A Laboratory Manual. 1 (3rd ed.). p. 5.2–5.3. ISBN 978-0879691363.
- ^ Smisek, D. L.; Hoagland, D. A. (1989). "Agarose gel electrophoresis of high molecular weight, synthetic polyelectrolytes". Macromolecules. 22 (5): 2270–2277. Bibcode:1989MaMol..22.2270S. doi:10.1021/ma00195a048.
- ^ "Agarose gel electrophoresis (basic method)". Biological Protocols. Retrieved 23 August 2011.
- ^ Schägger, Hermann (2006). "Tricine–SDS-PAGE". Nature Protocols. 1 (1): 16–22. doi:10.1038/nprot.2006.4. PMID 17406207. S2CID 209529082.
- ^ Gordon, A.H. (1975). Electrophoresis of proteins in polyacrylamide and starch gels. New York: American Elsevier Publishing Company, Inc.
- ^ Jump up to: a b Smithies, O. (1955). "Zone electrophoresis in starch gels: group variations in the serum proteins of normal adults". Biochem. J. 61 (4): 629–641. doi:10.1042/bj0610629. PMC 1215845. PMID 13276348.
- ^ Wraxall, B.G.D.; Culliford, B.J. (1968). "A thin-layer starch gel method for enzyme typing of bloodstains". J. Forensic Sci. Soc. 8 (2): 81–82. doi:10.1016/S0015-7368(68)70449-7. PMID 5738223.
- ^ Buell, GN; Wickens, MP; Payvar, F; Schimke, RT (10 April 1978). "Synthesis of full length cDNAs from four partially purified oviduct mRNAs". The Journal of Biological Chemistry. 253 (7): 2471–82. doi:10.1016/S0021-9258(17)38097-3. PMID 632280.
- ^ Schelp, C; Kaaden, OR (May 1989). "Enhanced full-length transcription of Sindbis virus RNA by effective denaturation with methylmercury hydroxide". Acta Virologica. 33 (3): 297–302. PMID 2570517.
- ^ Fromin N, Hamelin J, Tarnawski S, Roesti D, Jourdain-Miserez K, Forestier N, Teyssier-Cuvelle S, Gillet F, Aragno M, Rossi P (November 2002). "Statistical analysis of denaturing gel electrophoresis (DGE) fingerprinting patterns" (PDF). Environ. Microbiol. 4 (11): 634–43. doi:10.1046/j.1462-2920.2002.00358.x. PMID 12460271.
- ^ Fischer SG, Lerman LS (January 1979). "Length-independent separation of DNA restriction fragments in two-dimensional gel electrophoresis". Cell. 16 (1): 191–200. doi:10.1016/0092-8674(79)90200-9. PMID 369706. S2CID 9369012.
- ^ Hempelmann E, Wilson RJ (1981). "Detection of glucose-6-phosphate dehydrogenase in malarial parasites". Molecular and Biochemical Parasitology. 2 (3–4): 197–204. doi:10.1016/0166-6851(81)90100-6. PMID 7012616.
- ^ Ninfa AJ, Ballou DP (1998). Fundamental Approaches to Biochemistry and Biotechnology. Bethesda, Md: Fitzgerald Science Press. ISBN 9781891786006.
- ^ Ninfa, Alexander J.; Ballou, David P.; Benore, Marilee (2009). fundamental laboratory approaches for biochemistry and biotechnology. Hoboken, NJ: Wiley. p. 161. ISBN 978-0470087664.
- ^ Brody JR, Kern SE (October 2004). "History and principles of conductive media for standard DNA electrophoresis" (PDF). Anal. Biochem. 333 (1): 1–13. doi:10.1016/j.ab.2004.05.054. PMID 15351274.
- ^ Lodish H; Berk A; Matsudaira P (2004). Molecular Cell Biology (5th ed.). WH Freeman: New York, NY. ISBN 978-0-7167-4366-8.
- ^ Troubleshooting DNA agarose gel electrophoresis. Focus 19:3 p.66 (1997).
- ^ Barasinski, M.; Garnweitner, G. Restricted and Unrestricted Migration Mechanisms of Silica Nanoparticles in Agarose Gels and Their Utilization for the Separation of Binary Mixtures. J. Phys. Chem. C. 2020, 124, 5157-5166. https://pubs.acs.org/doi/abs/10.1021/acs.jpcc.9b10644
- ^ Thorne HV (1966). "Electrophoretic separation of polyoma virus DNA from host cell DNA". Virology. 29 (2): 234–9. doi:10.1016/0042-6822(66)90029-8. PMID 4287545.
- ^ Weber, K; Osborn, M (1969). "The reliability of molecular weight determinations by dodecyl sulfate-polyacrylamide gel electrophoresis". The Journal of Biological Chemistry. 244 (16): 4406–12. doi:10.1016/S0021-9258(18)94333-4. PMID 5806584.
- ^ Aaij C, Borst P (1972). "The gel electrophoresis of DNA". Biochim Biophys Acta. 269 (2): 192–200. doi:10.1016/0005-2787(72)90426-1. PMID 5063906.
- ^ Kastenholz B (2004). "Preparative native continuous polyacrylamide gel electrophoresis (PNC‐PAGE): an efficient method for isolating cadmium cofactors in biological systems". Analytical Letters. 37 (4): 657–665. doi:10.1081/AL-120029742. S2CID 97636537.
- ^ Milan Bier (1959). Electrophoresis. Theory, Methods and Applications (3rd ed.). Academic Press. p. 225. OCLC 1175404. LCC 59-7676.
- ^ Minde DP (2012). "Determining biophysical protein stability in lysates by a fast proteolysis assay, FASTpp". PLOS ONE. 7 (10): e46147. Bibcode:2012PLoSO...746147M. doi:10.1371/journal.pone.0046147. PMC 3463568. PMID 23056252.
External links[]
| Wikimedia Commons has media related to Gel electrophoresis. |
- Biotechniques Laboratory electrophoresis demonstration, from the University of Utah's Genetic Science Learning Center
- Discontinuous native protein gel electrophoresis
- Drinking straw electrophoresis
- How to run a DNA or RNA gel
- Animation of gel analysis of DNA restriction
- Step by step photos of running a gel and extracting DNA
- A typical method from wikiversity
- Protein methods
- Molecular biology
- Laboratory techniques
- Electrophoresis
- Polymerase chain reaction
- Gels