Government spending
| Public finance |
|---|
 |
|
Government spending or expenditure includes all government consumption, investment, and transfer payments.[1][2] In national income accounting, the acquisition by governments of goods and services for current use, to directly satisfy the individual or collective needs of the community, is classed as government final consumption expenditure. Government acquisition of goods and services intended to create future benefits, such as infrastructure investment or research spending, is classed as government investment (government gross capital formation). These two types of government spending, on final consumption and on gross capital formation, together constitute one of the major components of gross domestic product.
Government spending can be financed by government borrowing, taxes, custom duties, the sale or lease of natural resources, and various fees like national park entry fees or licensing fees.[3] When Governments choose to borrow money, they have to pay interest on the money borrowed which can lead to government debt.[4] Changes in government spending is a major component of fiscal policy used to stabilize the macroeconomic business cycle.
Macroeconomic fiscal policy[]
Government spending can be a useful economic policy tool for governments. Fiscal policy can be defined as the use of government spending and/or taxation as a mechanism to influence an economy.[5][6] There are two types of fiscal policy: expansionary fiscal policy, and contractionary fiscal policy. Expansionary fiscal policy is an increase in government spending or a decrease in taxation, while contractionary fiscal policy is a decrease in government spending or an increase in taxes. Expansionary fiscal policy can be used by governments to stimulate the economy during a recession. For example, an increase in government spending directly increases demand for goods and services, which can help increase output and employment. On the other hand, contractionary fiscal policy can be used by governments to cool down the economy during an economic boom. A decrease in government spending can help keep inflation in check.[5] During economic downturns, in the short run, government spending can be changed either via automatic stabilization or discretionary stabilization. Automatic stabilization is when existing policies automatically change government spending or taxes in response to economic changes, without the additional passage of laws.[7][5] A primary example of an automatic stabilizer is unemployment insurance, which provides financial assistance to unemployed workers. Discretionary stabilization is when a government takes actions to change government spending or taxes in direct response to changes in the economy. For instance, a government may decide to increase government spending as a result of a recession.[7] With discretionary stabilization, the government must pass a new law to make changes in government spending.[5]
John Maynard Keynes was one of the first economists to advocate for government deficit spending as part of the fiscal policy response to an economic contraction. According to Keynesian economics, increased government spending raises aggregate demand and increases consumption, which leads to increased production and faster recovery from recessions. Classical economists, on the other hand, believe that increased government spending exacerbates an economic contraction by shifting resources from the private sector, which they consider productive, to the public sector, which they consider unproductive.[8]
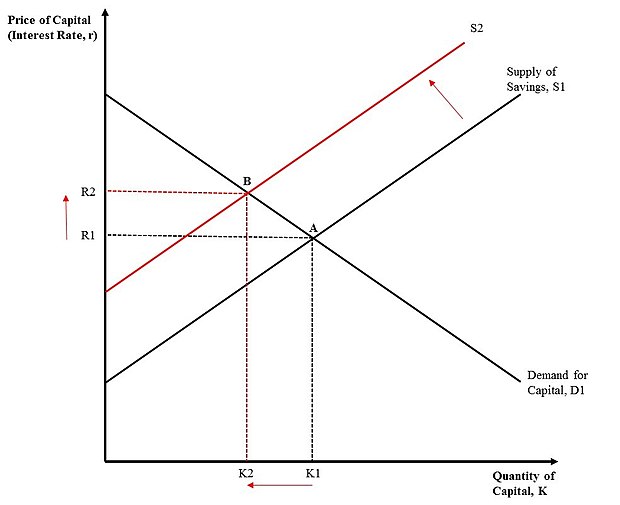
In economics, the potential "shifting" in resources from the private sector to the public sector as a result of an increase in government deficit spending is called crowding out.[5] The figure to the right depicts the market for capital, otherwise known as the market for loanable funds. The downward sloping demand curve D1 represents demand for private capital by firms and investors, and the upward sloping supply curve S1 represents savings by private individuals. The initial equilibrium in this market is represented by point A, where the equilibrium quantity of capital is K1 and the equilibrium interest rate is R1. If the government increases deficit spending, it will borrow money from the private capital market and reduce the supply of savings to S2. The new equilibrium is at point B, where the interest rate has increased to R2 and the quantity of capital available to the private sector has decreased to K2. The government has essentially made borrowing more expensive and has taken away savings from the market, which "crowds out" some private investment. The crowding out of private investment could limit the economic growth from the initial increase government spending.[7][6]
Heterodox Economics disagrees[]
The above explanation of the impacts of government spending comes from conventional, orthodox economics, a set of models that did not predict the largest economic event of the last 80 years—the Global Financial Crisis (GFC), or sub-prime mortgage derivatives meltdown. Although economics provokes controversy, empirical evidence that orthodox economics is valid in explaining current conditions is at least questionable. See Steve Keen's Debunking Economics: The Naked Emperor Dethroned for a complete account of its failings. Keen himself won the Revere Prize in economics for correctly predicting the GFC.
, a fellow at the Open Markets Institute, says the point of orthodox economics "is to create a language and methodology for governing that hides political assumptions from the public"[9] Calling it a "science" in the conventional sense of that word is at least open to question.
Among the questionable concepts orthodox economics promotes is Crowding Out, which presumes the economy is a zero-sum game. If that were true, then the assumption is that resources are 100% utilized, and when government employs additional resources, it must do so at the expense of the private sector. But the U.S. economy, as of this writing, is at only 77% of its current capacity (never mind adding capacity), and as the COVID-19 epidemic proceeds, that figure 77% is likely to go lower. A more realistic economics would conclude that government spending would employ idle resources, not "crowd out" private use of those resources.
History demonstrates this conclusion is realistic, too. Historical GDP growth rates increase dramatically when the U.S. government spent for the New Deal and for big public works projects like World War II. One could conclude the additional GDP grown was a result of bringing resources un- or under-employed during the Great Depression back into production.
Orthodox economists contend that government 'borrowing' competes for savings, too. The orthodox model says: "If government tries to borrow more by issuing and selling more bonds, then the competition for finance would push up interest rates [emphasis added]. Some private firms would decide not to borrow at the higher rates and hence investment would be lower. Also, durable consumption expenditure by households will decline because some of it is financed by borrowing.
"However, that model is incorrect. Government fiscal deficits generate non-government surpluses (flows) that accumulate to the non-government sector's net acquisition of financial assets (a stock)... Since there are more savings (as a result of higher income levels arising from the deficits) and greater financial wealth, it is not true that government is competing with private sector borrowers for a limited supply of savings (a flow) to place government bonds into wealth portfolios that are fixed in size. Both savings and portfolios expand as government deficits grow."[10] And contrariwise, as government practices austerity, savings shrink and economic instability grows. Historically, whenever government has succumbed to the siren song of this "fiscal responsibility" and significantly reduced deficits, the economy goes into a tailspin...100% of the time.[11]
Perhaps the clearest evidence of its failings is orthodox economics' prediction for the consequences for larger government 'debt.'
Note: Government 'debt' is nothing like household debt, it's like bank debt. If you have a bank account, that is your asset, but to the bank, it's a liability, a 'debt.' Reducing the bank's 'debt' reduces the size of depositors' accounts. As the above paragraph indicates, what follows reducing people's savings is an economic downturn, replete with waves of asset forfeitures and foreclosures when people are unable to pay their obligations out of (reduced) savings.
Because it discouraged government 'debt,' orthodox economics blessed the Clinton federal budget surplus, deregulated markets, reduced government spending, and encouraged Wall Street's derivatives that led to the GFC in 2007–8. An estimated 8,000,000 people lost their homes in that debacle.
Despite these events, according to orthodox economics, there's a threshold for government debt, beyond which the economy suffers, and bond markets will demand higher interest rates, or they cannot sell government debt. People often point to Greece, which has to pay high interest rates to borrow, as an example. But, unlike the U.S, Greece no longer makes its own currency, so it isn't comparable to a monetary sovereign who can "print" the means to repay such 'debt.' There is no credit risk when monetary sovereigns with floating exchange rates can "print" the means to repay their 'debt,' just as there would be no credit risk banks would be unable to pay depositors if they could print banknotes.
Orthodox economists Reinhart and Rogoff even wrote a study concluding that government 'debt' larger than 90% of GDP impaired economic performance. However, others examined their work found they cherry-picked their examples, and even had a mistake in the spreadsheet formulas they used to calculate this result.[12]
What is comparable to the monetary sovereign U.S.' situation is Japan's. Japan makes its own fiat currency (Yen) and has a floating exchange rate. Its current 'debt'-to-GDP ratio is roughly 240%--far above Reinhart and Rogoff's 90% threshold. The orthodox economics school would conclude that the Japanese have borrowed too much, and they have impaired their ability to repay government 'debt.' Therefore, the orthodox economics prediction is that bond markets would charge a risk premium (higher interest rates) before Japan's central bank could sell Yen-denominated bonds. The truth is that the National debt of Japan sells at near a zero interest rate.
These conclusions stir controversy because they contradict the narrative so widely disseminated by the press and orthodox economic journals. Heterodox economists have had to found their own journals, had to deal with difficulty getting tenure and employment as a result of their conclusions. Nevertheless, the events cited above, the Federal Reserve's response to the GFC (extending $16 - $29 trillion in credit to the financial sector[13]) and the current multi-trillion-dollar response to the COVID-19 pandemic appear to validate the conclusions of the heterodox economists, particularly Modern Money Theory.
Current use: final consumption[]
Government acquisition of goods and services for current use to directly satisfy individual or collective needs of the members of the community is called government final consumption expenditure (GFCE.) It is a purchase from the national accounts "use of income account" for goods and services directly satisfying of individual needs (individual consumption) or collective needs of members of the community (collective consumption). GFCE consists of the value of the goods and services produced by the government itself other than own-account capital formation and sales and of purchases by the government of goods and services produced by market producers that are supplied to households—without any transformation—as "social transfers" in kind.[14]
Government spending or government expenditure can be divided into three primary groups, government consumption, transfer payments, and interest payments.[15]
- Government consumption are government purchases of goods and services. Examples include road and infrastructure repairs, national defence, schools, healthcare, and government workers’ salaries.
- Transfer payments are government payments to individuals. Such payments are made without the exchange of good or services, for example Old Age Security payments, Employment Insurance benefits, veteran and civil service pensions, foreign aid, and social assistance payments. Subsidies to businesses are also included in this category.
- Interest payments are the interest paid to the holders of government bonds, such as Saving Bonds and Treasury bills.
National defense spending[]
The United States spends vastly more than other countries on national defense. For example, In 2019 the United States approved a budget of 686.1 billion in discretionary military spending,[16]China was second with an estimated 261 billion dollars in military spending.[17]The table below shows the top 10 countries with the largest military expenditures as of 2015, the most recent year with publicly available data. As the table suggests, the United States spent nearly 3 times as much on the military as China, the country with the next largest military spending. The U.S. military budget dwarfed spending by all other countries in the top 10, with 8 out of countries spending less than $100 billion in 2016.
| List by the Stockholm International Peace Research Institute 2017 Fact Sheet (for 2016)[18] SIPRI Military Expenditure Database[19]
|
Healthcare and medical research[]
Research Australia[22] found 91% of Australians think 'improving hospitals and the health system' should be the Australian Government's first spending priority.
Crowding 'in' also[23] happens in university life science research Subsidies, funding and government business or projects like this are often justified on the basis of their positive return on investment. Life science crowding in contrasts with crowding out in public funding of research more widely:[24] "10% increase in government R&D funding reduced private R&D expenditure by 3%...In Australia, the average cost of public funds is estimated to be $1.20 and $1.30 for each dollar raised (Robson, 2005). The marginal cost is probably higher, but estimates differ widely depending on the tax that is increased".
In the US the total investment in medical and health research and development (R&D) in the US had grown by 27% over the five years from 2013 to 2017, and it is led by industry and the federal government. However, the industry accounted for 67% of total spending in 2017, followed by the federal government at 22%. According to the National Institute of Health (NIH) accounted for the lion's share of federal spending in medical and health research in 2017 was $32.4 billion or 82.1%.[25]
Also, academic and research institutions, this includes colleges, and universities, independent research (IRIs), and independent hospital medical research centres also increased spending, dedicating more than $14.2 billion of their own funds (endowment, donations etc.) to medical and health R&D in 2017. Although other funding sources - foundations, state and local government, voluntary health associations and professional societies - accounted for 3.7% of total medical and health R&D expenditure.
On the other hand, global health spending continues to increase and rise rapidly – to US$7.8 trillion in 2017 or about 10% of GDP and $1.80 per capita – up from US£7.6 trillion in 2016. In addition, about 605 of this spending was public and 40% private, with donor funding representing less than 0.2% of the total although the health spending in real terms has risen by 3.79% in a year while global GDP had grown by 3.0%.
According to the World Health Organisation (WHO), the increase in health spending in low-income countries, and it rose by 7.8% a year between 2000 and 2017 while their economy grew by 6.4%, it is explained in the figure. However, the middle-income economies health spending grew more than 6%, and average annual growth in high-income countries was 3.5%, which is about twice as fast as economic growth. In contrast, health spending by the high-income countries continues to represent to be the largest share of global spending, which is about 81%, despite it covers only 16% of world's population; although it down from 87% in 2000. The primary driver of this change in global spending on healthcare is India and China, which they moved to higher-income groups. Furthermore, just over 40% of the world population lived in low-income countries, which is now they dropped to 10%. Moreover, significant spending increment was in upper-middle-income economies population share has more than doubled over the period of, and share of global health spending nearly also doubled due to China and India's vast population joining that group. Unfortunately, all other spending share income groups had declined.[26]
From the continent view, North America, Western Europe, and Oceanic countries have the highest levels of spending, and West Central Asia, and East Africa the lowest, which is followed closely by South Asia, it is explained in the figure.
It is also true that fast economic growth is associated with increased health spending and sustained rapid economic growth between 2000 and 2017. Even more, fast economic growth which is generally associated with the higher government revenues and health spending is mostly located in Asia such as China, India and Indonesia followed by the Middle East and Latin America. In these countries, the real health spending per capita grew by 2.2 times and increased by 0.6 percentage point as per a share of GDP from 2000 to 2017.
Infrastructure and investment: gross fixed capital formation[]
Government acquisition intended to create future benefits, such as infrastructure investment or research spending, is called gross fixed capital formation, or government investment, which usually is the largest part of the government.[27] Acquisition of goods and services is made through production by the government (using the government's labour force, fixed assets and purchased goods and services for intermediate consumption) or through purchases of goods and services from market producers. In economic theory or in macroeconomics, investment is the amount purchased of goods which are not consumed but are to be used for future production (i.e. capital). Examples include railroad or factory construction.
Infrastructure spending is considered government investment because it will usually save money in the long run, and thereby reduce the net present value of government liabilities.
Spending on physical infrastructure in the U.S. returns an average of about $1.92 for each $1.00 spent on nonresidential construction because it is almost always less expensive to maintain than repair or replace once it has become unusable.[28]
Likewise, government spending on social infrastructure, such as preventative health care, can save several hundreds of billions of dollars per year in the U.S., because for example cancer patients are more likely to be diagnosed at Stage I where curative treatment is typically a few outpatient visits, instead of at Stage III or later in an emergency room where treatment can involve years of hospitalization and is often terminal.[29]
Infrastructure and investment: gross fixed capital formation
Government acquisition intended to create future benefits, such as infrastructure investment or research spending, is called gross fixed capital formation, or government investment, which usually is the largest part of the government.[27] Acquisition of goods and services is made through production by the government (using the government's labour force, fixed assets and purchased goods and services for intermediate consumption) or through purchases of goods and services from market producers. In economic theory or in macroeconomics, investment is the amount purchased per unit of time of goods which are not consumed but are to be used for future production (i.e. capital). Examples include railroad or factory construction.
Infrastructure spending is considered government investment because it will usually save money in the long run, and thereby reduce the net present value of government liabilities.
Per capita spending[]
In 2010 national governments spent an average of $2,376 per person, while the average for the world's 20 largest economies (in terms of GDP) was $16,110 per person. Norway and Sweden expended the most at $40,908 and $26,760 per capita respectively. The federal government of the United States spent $11,041 per person. Other large economy country spending figures include South Korea ($4,557), Brazil ($2,813), Russia ($2,458), China ($1,010), and India ($226).[30] The figures below of 42% of GDP spending and a GDP per capita of $54,629 for the U.S. indicate a total per person spending including national, state, and local governments was $22,726 in the U.S.
As a percentage of GDP[]


>55% 50–55% 45–50% 40–45% 35–40% 30–35%
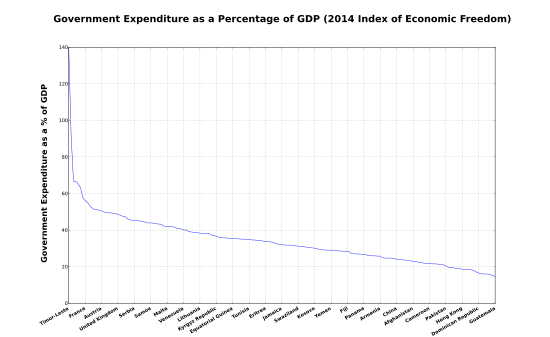
This is a list of countries by government spending as a percentage of gross domestic product (GDP) for the listed countries, according to the 2014 Index of Economic Freedom[31] by The Heritage Foundation and The Wall Street Journal. Tax revenue is included for comparison. These statistics utilize the United Nations' System of National Accounts (SNA), which measures the government sector differently than the U.S. Bureau of Economic Analysis (BEA). The SNA counts as government spending the gross cost of public services such as state universities and public hospitals. For example, the SNA counts the entire cost of running the public-university system, not just what legislators appropriate to supplement students' tuition payments. Those adjustments push up the SNA's measure of spending by roughly 4 percent of GDP compared with the standard measure tallied by the BEA.[32]
| Country | Tax burden % GDP | Govt. expend. % GDP |
|---|---|---|
| 9 | 23 | |
| 23 | 28 | |
| 10 | 40 | |
| 6 | 39 | |
| 35 | 41 | |
| 17 | 25 | |
| 26 | 35 | |
| 42 | 51 | |
| 13 | 34 | |
| 16 | 23 | |
| 3 | 31 | |
| 10 | 16 | |
| 27 | 41 | |
| 25 | 36 | |
| 44 | 53 | |
| 23 | 29 | |
| 16 | 22 | |
| 14 | 38 | |
| 22 | 35 | |
| 39 | 49 | |
| 28 | 32 | |
| 35 | 39 | |
| 26 | 34 | |
| 14 | 24 | |
| 4 | 19 | |
| 14 | 40 | |
| 11 | 20 | |
| 11 | 22 | |
| 31 | 42 | |
| 20 | 32 | |
| 9 | 16 | |
| 5 | 26 | |
| 19 | 23 | |
| 19 | 24 | |
| 15 | 29 | |
| 12 | 22 | |
| 24 | 29 | |
| 8 | 26 | |
| 22 | 18 | |
| 13 | 26 | |
| 33 | 43 | |
| 24 | 67 | |
| 27 | 46 | |
| 35 | 43 | |
| 48 | 58 | |
| 20 | 35 | |
| 24 | 36 | |
| 13 | 16 | |
| 18 | 44 | |
| 14 | 32 | |
| 15 | 22 | |
| 2 | 35 | |
| 50 | 34 | |
| 33 | 38 | |
| 11 | 18 | |
| 23 | 28 | |
| 43 | 55 | |
| 44 | 56 | |
| 10 | 25 | |
| 13 | 26 | |
| 25 | 32 | |
| 37 | 45 | |
| 15 | 24 | |
| 31 | 52 | |
| 11 | 15 | |
| 16 | 22 | |
| 9 | 21 | |
| 21 | 31 | |
| 13 | 34 | |
| 16 | 26 | |
| 14 | 19 | |
| 36 | 49 | |
| 36 | 47 | |
| 19.262 | 29.245[33] | |
| 12 | 19 | |
| 9 | 22 | |
| 2 | 45 | |
| 28 | 48 | |
| 33 | 45 | |
| 43 | 50 | |
| 23 | 32 | |
| 28 | 42 | |
| 14 | 33 | |
| 15 | 22 | |
| 20 | 29 | |
| 20 | 92 | |
| N/A | N/A | |
| 26 | 30 | |
| 1 | 39 | |
| 19 | 36 | |
| 14 | 21 | |
| 27 | 39 | |
| 17 | 30 | |
| 38 | 63 | |
| 20 | 31 | |
| 1 | 67 | |
| N/A | N/A | |
| 16 | 38 | |
| 37 | 42 | |
| 35 | 17 | |
| 11 | 16 | |
| 20 | 35 | |
| 15 | 29 | |
| 16 | 43 | |
| 14 | 25 | |
| 34 | 42 | |
| 18 | 28 | |
| 18 | 25 | |
| 11 | 27 | |
| 12 | 65 | |
| 31 | 39 | |
| 33 | 45 | |
| 24 | 44 | |
| 23 | 35 | |
| 20 | 34 | |
| 28 | 37 | |
| 13 | 19 | |
| 39 | 50 | |
| 32 | 48 | |
| 18 | 26 | |
| 14 | 20 | |
| 5 | 29 | |
| 26 | 31 | |
| 43 | 44 | |
| 2 | 38 | |
| 9 | 20 | |
| 18 | 27 | |
| 26 | 29 | |
| 13 | 19 | |
| 17 | 19 | |
| 12 | 16 | |
| 32 | 44 | |
| 31 | 49 | |
| 3 | 31 | |
| 28 | 37 | |
| 30 | 36 | |
| 13 | 27 | |
| 25 | 35 | |
| 22 | 30 | |
| 23 | 44 | |
| 17 | 49 | |
| 4 | 35 | |
| 19 | 29 | |
| 35 | 45 | |
| 32 | 36 | |
| 12 | 22 | |
| 14 | 17 | |
| 29 | 38 | |
| 37 | 51 | |
| 37 | 51 | |
| 27 | 32 | |
| 32 | 45 | |
| 12 | 21 | |
| 7 | 18 | |
| 19 | 27 | |
| 23 | 31 | |
| 45 | 51 | |
| 29 | 34 | |
| 10 | N/A | |
| 9 | 23 | |
| 20 | 27 | |
| 15 | 27 | |
| 16 | 23 | |
| 61.5 | 51.2 | |
| 17 | 24 | |
| 18 | 29 | |
| 17 | 35 | |
| 21 | 35 | |
| 25 | 35 | |
| 18 | 15 | |
| 17 | 21 | |
| 38 | 46 | |
| 6 | 24 | |
| 36 | 49 | |
| 25.1 | 41.6 | |
| 27 | 33 | |
| 20 | 31 | |
| 16 | 25 | |
| 13 | 40 | |
| 21 | 31 | |
| 5 | 29 | |
| 19 | 24 | |
| 30 | 35 | |
| N/A | N/A | |
| 24 | 34 |
Public social spending by country[]
Public social spending comprises cash benefits, direct in-kind provision of goods and services, and tax breaks with social purposes provided by general government (that is central, state, and local governments, including social security funds).[34]
| Country | Public social spending % of GDP |
|---|---|
| 31.7 | |
| 30.6 | |
| 29.2 | |
| 28.9 | |
| 28.8 | |
| 28.0 | |
| 26.7 | |
| 26.4 | |
| 25.4 | |
| 25.0 | |
| 24.1 | |
| 23.9 | |
| 22.4 | |
| 22.3 | |
| 22.2 | |
| 21.5 | |
| OECD | 21.0 |
| 20.7 | |
| 19.7 | |
| 19.6 | |
| 19.5 | |
| 19.4 | |
| 19.4 | |
| 19.0 | |
| 18.8 | |
| 17.2 | |
| 17.0 | |
| 17.0 | |
| 16.0 | |
| 15.7 | |
| 14.4 | |
| 11.2 | |
| 10.1 |
See also[]
- Rahn curve
- Open government
- Government operations
- Public expenditure
- Public finance
- Government budget
- Government waste
- Fiscal policy
- Fiscal council
- Sovereign wealth fund
- Tax
- Mandatory spending
- Taxpayers unions
- Eurostat
- Government spending in the United Kingdom
- Government spending in the United States
- List of countries by government spending as percentage of GDP
References[]
- ^ "Government | U.S. Bureau of Economic Analysis (BEA)".
- ^ Robert Barro and Vittorio Grilli (1994), European Macroeconomics, Ch. 15–16. Macmillan, ISBN 0-333-57764-7.
- ^ "Sources of Federal Government Revenue | U.S. Treasury Data Lab". datalab.usaspending.gov.
- ^ "Borrowing and the Federal Debt".
- ^ Jump up to: a b c d e Taylor, Timothy (2017). Principles of Macroeconomics: Economics and the Economy (Fourth ed.). Minneapolis: Textbook Media Press. pp. 366–340. ISBN 9780996996334. OCLC 1001342630.
- ^ Jump up to: a b Gregory, Mankiw (2014). Principles of Economics (Seventh ed.). Stamford, CT: Southwestern Publishing Group. ISBN 9781285165875. OCLC 884664951.
- ^ Jump up to: a b c Jonathan, Gruber (28 December 2015). Public Finance and Public Policy (Fifth ed.). New York: Worth Publishers. ISBN 9781464143335. OCLC 914290290.
- ^ Irvin, Tucker (2012). Macroeconomics for Today (8th ed.). Mason, OH: Cengage Learning. ISBN 9781133435051. OCLC 830731890.
- ^ Stoller, Matt. "What Is the Point of Economics?". mattstoller.substack.com. Retrieved 17 April 2020.
- ^ Mitchell, William, 1952- (25 February 2019). Macroeconomics. Wray, L. Randall, 1953-, Watts, Martin, 1949-. London. ISBN 978-1-137-61066-9. OCLC 967762036.CS1 maint: multiple names: authors list (link)
- ^ R, L.; Wray, all; Economics, ContributorProfessor of; Employment, Research Director of the Center for Full; Stability, Price; City, University of Missouri-Kansas (12 April 2010). "The Federal Budget Is Not Like a Household Budget: Here's Why". HuffPost. Retrieved 17 April 2020.
- ^ Alexander, Ruth (20 April 2013). "The student who caught out the profs of austerity". BBC News. Retrieved 2 May 2020.
- ^ "$29,000,000,000,000: A Detailed Look at the Fed's Bailout of the Financial System | Levy Economics Institute". www.levyinstitute.org. Retrieved 2 May 2020.
- ^ F. Lequiller, D. Blades: Understanding National Accounts, Paris: OECD 2006, pp. 127–30
- ^ Acemoglu, Daron (2018). Macroeconomics. David I. Laibson, John A. List (Second ed.). New York. ISBN 978-0-13-449205-6. OCLC 956396690.
- ^ https://dod.defense.gov/Portals/1/Documents/pubs/FY2019-Budget-Request-Overview-Book.pdf
- ^ https://www.sipri.org/sites/default/files/2020-04/fs_2020_04_milex_0_0.pdf
- ^ "Trends in World Military Expenditure, 2016" (PDF). Stockholm International Peace Research Institute. Retrieved 24 April 2017.
- ^ "Data for all countries from 1988–2016 in constant (2015) USD (pdf)" (PDF). SIPRI. Retrieved 24 April 2017.
- ^ Jump up to: a b SIPRI estimate.
- ^ The figures for Saudi Arabia include expenditure for public order and safety and might be slightly overestimated.
- ^ "Research Australia". crm.researchaustralia.org.
- ^ http://www.nber.org/papers/w15146.pdf
- ^ "Do innovation programs actually increase innovation?". robwiblin.com. 24 September 2012.
- ^ "Strong but uneven spending in medical and health R&D across sectors over five-year period". EurekAlert!. Retrieved 27 April 2020.
- ^ "WHO | Global Spending on Health: A World in Transition". WHO. Retrieved 27 April 2020.
- ^ Jump up to: a b "Gross capital formation" Statistics Explained European Union Statistics Directorate, European Commission
- ^ Cohen, Isabelle; Freiling, Thomas; Robinson, Eric (January 2012). The Economic Impact and Financing of Infrastructure Spending (PDF) (report). Williamsburg, Virginia: Thomas Jefferson Program in Public Policy, College of William & Mary. p. 5. Archived from the original (PDF) on 3 May 2012. Retrieved 1 October 2012.
- ^ Hogg, W.; Baskerville, N.; Lemelin, J. (2005). "Cost savings associated with improving appropriate and reducing inappropriate preventive care: Cost-consequences analysis". BMC Health Services Research. 5 (1): 20. doi:10.1186/1472-6963-5-20. PMC 1079830. PMID 15755330.
- ^ CIA World Factbook, population data from 2010, Spending and GDP data from 2011. Note: these numbers do not include U.S. state and local government spending which when included bring the per capita spending to $16,755
- ^ Jump up to: a b c "Economic Data and Statistics on World Economy and Economic Freedom". www.heritage.org.
- ^ "Is Government Spending Really 41 Percent of GDP?". Center on Budget and Policy Priorities. 18 October 2011. Retrieved 17 May 2019.
- ^ "Report for Selected Countries and Subjects".
- ^ Jump up to: a b "Social spending Public, % of GDP, 2015". OECD. OECD data
External links[]
| Wikimedia Commons has media related to Government Spending. |
| Wikimedia Commons has media related to Public expenditure. |
| Wikiquote has quotations related to: Government spending |
- OECD Government spending statistics
- Canadian Governments Compared
- Eurostat's government spending per sector
| show Authority control |
|---|
- Government spending
- Government finances
- Fiscal policy