Harborne (ward)
| Harborne | |
|---|---|
| Ward | |
 Harborne Ward shown within Birmingham | |
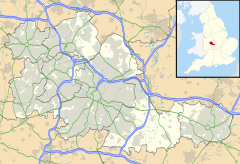 Harborne Location within the West Midlands | |
| Population | 23,001 (2011)[1] |
| OS grid reference | SP020836 |
| Metropolitan borough | |
| Metropolitan county | |
| Region | |
| Country | England |
| Sovereign state | United Kingdom |
| Post town | BIRMINGHAM |
| Postcode district | B17 |
| Dialling code | 0121 |
| Police | West Midlands |
| Fire | West Midlands |
| Ambulance | West Midlands |
| UK Parliament | |
| Councillors |
|

Harborne ward is a local government district, one of 40 wards that make up Birmingham City Council. Harborne lies to the south west of Birmingham city centre. It has a slightly older age profile than the city average. The percentage of ethnic minority residents is below the city average.[2] Unemployment is below the city average.[3] The ward population at the 2011 census was 23,001.[4]
Politics[]
The Harborne ward is currently represented by one Labour Party Councillor; Jayne Francis (2016-)[5] and one Conservative Councillor; Peter Fowler (2018-).
The ward of Harborne forms part of the Parliamentary constituency of Birmingham Edgbaston along with Bartley Green, Edgbaston (ward), and Quinton, which has been represented by Labour Co-operative MP Preet Gill since 2017.
Election results[]
2010s[6][]
| Party | Candidate | Votes | % | ±% | |
|---|---|---|---|---|---|
| Labour | Jayne Francis | 2,623 | 22.69 | ||
| Conservative | Peter Fowler | 2,533 | 21.91 | ||
| Conservative | Akaal Sidhu | 2390 | 20.67 | ||
| Labour | Sundip Meghani | 2061 | 17.82 | ||
| Liberal Democrats | Colin Green | 657 | 5.68 | ||
| Green | Phil Simpson | 650 | 5.62 | ||
| Liberal Democrats | Ian Garrett | 646 | 5.59 | ||
| Majority | |||||
| Turnout | 6,109 | 38.60 | |||
| Labour hold | Swing | ||||
| Conservative gain from Labour | Swing | ||||
| Party | Candidate | Votes | % | ±% | |
|---|---|---|---|---|---|
| Labour | Jayne Francis | 2,841 | 44.7 | ||
| Conservative | Akaal Sidhu | 2,404 | 37.8 | ||
| Green | Phil Simpson | 494 | 7.8 | ||
| UKIP | Mary Morris | 376 | 5.9 | ||
| Liberal Democrats | Philip Banting | 240 | 3.8 | ||
| Majority | 437 | 6.9 | |||
| Turnout | 6,355 | 39.23 | |||
| Labour hold | Swing | ||||
| Party | Candidate | Votes | % | ±% | |
|---|---|---|---|---|---|
| Labour | James McKay | 4,922 | 43.0 | ||
| Conservative | Jane James | 4,384 | 38.3 | ||
| Green | Phil Simpson | 964 | 8.4 | ||
| UKIP | Charles Brecknell | 654 | 5.7 | ||
| Liberal Democrats | Philip Banting | 528 | 4.6 | ||
| Majority | 538 | 4.7 | |||
| Turnout | 11,452 | ||||
| Labour hold | Swing | ||||
| Party | Candidate | Votes | % | ±% | |
|---|---|---|---|---|---|
| Conservative | John Alden | 2,816 | |||
| Labour | Nabila Zulfiqar | 2,518 | |||
| Green | Phil Simpson | 637 | |||
| UKIP | Charles Brecknell | 574 | |||
| Liberal Democrats | Philip Banting | 258 | |||
| Majority | 298 | ||||
| Turnout | |||||
| Conservative hold | Swing | ||||
| Party | Candidate | Votes | % | ±% | |
|---|---|---|---|---|---|
| Labour | Elaine Williams | 3,264 | 50.2 | ||
| Conservative | John Alden | 2,441 | 37.5 | ||
| Green | Phil Simpson | 394 | 6.1 | ||
| UKIP | Keith Rowe | 233 | 3.6 | NEW | |
| Liberal Democrats | Alaine Christian | 178 | 2.6 | ||
| Majority | 823 | 17.7 | |||
| Turnout | 6,529 | 37.95 | |||
| Labour gain from Conservative | Swing | ||||
| Party | Candidate | Votes | % | ±% | |
|---|---|---|---|---|---|
| Labour | James McKay | 3,655 | 46.6 | ||
| Conservative | Geoff Hewitt | 3,071 | 39.15 | ||
| Green | Phil Simpson | 633 | 8.07 | ||
| Liberal Democrats | Christopher Bates | 426 | 5.4 | ||
| Majority | 584 | 7.5 | |||
| Turnout | 7,844 | 46.04 | |||
| Labour gain from Conservative | Swing | ||||
| Party | Candidate | Votes | % | ±% | |
|---|---|---|---|---|---|
| Conservative | Mike Whitby | 4,640 | 42.0 | ||
| Labour | James McKay | 3,766 | 34.1 | ||
| Liberal Democrats | Mohammed Sagier | 1,609 | 14.6 | ||
| Green | Phil Simpson | 744 | 6.7 | ||
| BNP | Roy Bevington | 289 | 2.6 | ||
| Majority | 874 | 7.9 | |||
| Turnout | 11,078 | 66.3 | |||
| Conservative hold | Swing | ||||
2000s[]
| Party | Candidate | Votes | % | ±% | |
|---|---|---|---|---|---|
| Conservative | John Alden | 2,717 | 49.5 | ||
| Labour | John Priest | 1,389 | 25.3 | ||
| Green | Phil Simpson | 691 | 12.6 | ||
| Liberal Democrats | Mohammed Sagier | 405 | 7.4 | ||
| BNP | Howard Hamilton | 193 | 3.5 | ||
| UKIP | Edward Siddall-Jones | 80 | 1.5 | NEW | |
| Majority | 1,328 | 24.2 | |||
| Turnout | 5,475 | 33.4 | |||
| Conservative hold | Swing | ||||
| Party | Candidate | Votes | % | ±% | |
|---|---|---|---|---|---|
| Conservative | Peter Hollingworth | 2,699 | 44.5 | ||
| Labour | John Priest | 1,662 | 27.4 | ||
| Green | Philip Simpson | 786 | 13.0 | ||
| Liberal Democrats | Miriam Banting | 649 | 10.7 | ||
| BNP | Lynette Orton | 265 | 4.4 | ||
| Majority | 1,937 | 17.1 | |||
| Turnout | 6,083 | 36.98 | |||
| Conservative hold | Swing | ||||
| Party | Candidate | Votes | % | ±% | |
|---|---|---|---|---|---|
| Conservative | Mike Whitby | 3,200 | 48.3 | ||
| Labour | John Priest | 1,823 | 27.5 | ||
| Green | Philip Simpson | 665 | 10.0 | ||
| Liberal Democrats | Mohammed Sagier | 577 | 8.7 | ||
| BNP | Josephine Larkin | 364 | 5.5 | ||
| Majority | 1,377 | 20.8 | |||
| Turnout | 6,609 | 40.5 | |||
| Conservative hold | Swing | ||||
| Party | Candidate | Votes | % | ±% | |
|---|---|---|---|---|---|
| Conservative | John Alden | 3,268 | 16.93 | ||
| Conservative | Peter Hollingworth | 3,170 | 16.42 | ||
| Conservative | Mike Whitby | 3,100 | 16.06 | ||
| Labour | Badley, C. | 1,879 | 9.73 | ||
| Labour | McCarthy, K. | 1,589 | 8.23 | ||
| Labour | Hepburn, M. | 1,514 | 7.84 | ||
| Liberal Democrats | Banting, M. | 1,189 | 6.16 | ||
| Liberal Democrats | Sagier, M. | 1,155 | 5.98 | ||
| Liberal Democrats | Selwood, B. | 1,035 | 5.36 | ||
| Green | Carins, D. | 990 | 5.13 | ||
| BNP | Bellinger, S. | 378 | 1.96 | ||
| Majority | |||||
| Turnout | 19,301 | 41.33 | |||
| Conservative hold | Swing | ||||
| Conservative hold | Swing | ||||
| Conservative hold | Swing | ||||
| Party | Candidate | Votes | % | ±% | |
|---|---|---|---|---|---|
| Conservative | Peter Hollingworth | 3,008 | 52.4 | ||
| Labour | Badley, C. | 1,816 | 31.7 | ||
| Liberal Democrats | Banting, M. | 652 | 11.4 | ||
| Green | Vaze, P. | 261 | 4.5 | ||
| Majority | 1,192 | 20.4 | |||
| Turnout | 5,737 | 33.4 | |||
| Conservative hold | Swing | ||||
| Party | Candidate | Votes | % | ±% | |
|---|---|---|---|---|---|
| Conservative | Alden, J. | 3,029 | 54.8 | ||
| Labour | Sampson, R. | 1,782 | 32.2 | ||
| Liberal Democrats | Dow, C. | 512 | 9.3 | ||
| Green | Vaze, P. | 203 | 3.7 | NEW | |
| Majority | 1,247 | 22.6 | |||
| Turnout | 5,589 | 31.8 | |||
| Conservative hold | Swing | ||||
1990[]
| Party | Candidate | Votes | % | ±% | |
|---|---|---|---|---|---|
| Conservative | Hollingworth, P. | 2,995 | 57.1 | ||
| Labour | Smith-O'Gorman, W. | 1,724 | 32.9 | ||
| Liberal Democrats | Boyle, C. | 527 | 10 | ||
| Majority | 1,271 | 24.2 | |||
| Turnout | 5,246 | 30.1 | |||
| Conservative hold | Swing | ||||
| Party | Candidate | Votes | % | ±% | |
|---|---|---|---|---|---|
| Conservative | Mike Whitby | 2,719 | 53.4 | ||
| Labour | Stephen Cormell | 1,859 | 36.5 | ||
| Liberal Democrats | Conall Boyle | 420 | 8.2 | ||
| Green | Peter Beck | 96 | 1.9 | ||
| Majority | 860 | 16.9 | |||
| Turnout | 5,094 | 29.0 | |||
| Conservative gain from Labour | Swing | ||||
| Party | Candidate | Votes | % | ±% | |
|---|---|---|---|---|---|
| Conservative | Alden, J. | 2,981 | 44.9 | ||
| Labour | Emery, B. | 2,875 | 43.3 | ||
| Liberal Democrats | Moss, J. | 633 | 9.5 | ||
| Green | Bozic, N. | 153 | 2.3 | ||
| Majority | 106 | 1.6 | |||
| Turnout | 6,642 | 38.2 | |||
| Conservative hold | Swing | - | |||
| Party | Candidate | Votes | % | ±% | |
|---|---|---|---|---|---|
| Labour | Rust, A. | 3,288 | 45.8 | ||
| Conservative | Zissman, B. | 2,802 | 39.1 | ||
| Liberal Democrats | Moss, J. | 912 | 12.7 | ||
| Green | Squire, A. | 171 | 2.4 | ||
| Margin of victory | 486 | 6.8 | |||
| Turnout | 7,173 | 41.2 | |||
| Labour gain from Conservative | Swing | - | |||
| Party | Candidate | Votes | % | ±% | |
|---|---|---|---|---|---|
| Conservative | Hollingworth, P. | 3,309 | 41.5 | ||
| Labour | Bowen, S. | 2,714 | 34.0 | ||
| Liberal Democrats | Harmer, R. | 1,686 | 21.1 | ||
| Green | Squire, A. | 263 | 3.3 | ||
| Majority | 595 | 7.5 | |||
| Turnout | 7,972 | 46.1 | |||
| Conservative hold | Swing | - | |||
| Party | Candidate | Votes | % | ±% | |
|---|---|---|---|---|---|
| Conservative | Alden, J. | 4,425 | 63.2 | ||
| Labour | Harrison, D. | 1,743 | 24.9 | ||
| Liberal Democrats | Harmer, R. | 590 | 8.4 | ||
| Green | Squire, A. | 247 | 3.5 | ||
| Majority | 2,682 | 38.3 | |||
| Turnout | 7005 | 40.0 | |||
| Conservative hold | Swing | - | |||
| Party | Candidate | Votes | % | ±% | |
|---|---|---|---|---|---|
| Conservative | Zissman, B. | 4,043 | 51.9 | ||
| Labour | Fargher, B. | 2,374 | 30.5 | ||
| Liberal Democrats | Boyle, C. | 956 | 12.3 | NEW | |
| Green | Hurdley, J. | 411 | 5.3 | ||
| Majority | 1,669 | 21.4 | |||
| Turnout | 7,784 | 44.2 | |||
| Conservative hold | Swing | - | |||
| Party | Candidate | Votes | % | ±% | |
|---|---|---|---|---|---|
| Conservative | Hollingworth, P. | 3,950 | 45.9 | ||
| Labour | Fargher, B. | 3,588 | 41.7 | ||
| Green | Hurdley, J. | 1,061 | 12.3 | ||
| Majority | 362 | 4.2 | |||
| Turnout | 8,599 | 48.7 | |||
| Conservative hold | Swing | - | |||
1980[]
| Party | Candidate | Votes | % | ±% | |
|---|---|---|---|---|---|
| Conservative | Alden, J. | 3,786 | 51.0 | ||
| Labour | Fargher, B. | 2,542 | 34.2 | ||
| SLD | Bertram, C. | 814 | 11.0 | NEW | |
| Green | Squire, A. | 282 | 3.8 | ||
| Majority | 1,244 | 16.8 | |||
| Turnout | 7,424 | 41.2 | |||
| Conservative hold | Swing | - | |||
| Party | Candidate | Votes | % | ±% | |
|---|---|---|---|---|---|
| Conservative | Zissman, B. | 4,449 | 53.4 | ||
| Labour | Chandler, A. | 1,875 | 22.5 | ||
| Alliance | Vaughan, C. | 1,813 | 21.7 | ||
| Green | Hurdley, J. | 202 | 2.4 | ||
| Majority | 2,574 | 30.9 | |||
| Turnout | 8,339 | 46.1 | |||
| Conservative hold | Swing | - | |||
| Party | Candidate | Votes | % | ±% | |
|---|---|---|---|---|---|
| Conservative | Hollingworth, P. | 3,430 | 46.4 | ||
| Labour | Chandler, A. | 1,963 | 26.5 | ||
| Alliance | Vaughan, C. | 1,765 | 23.9 | ||
| Green | Squire, A. | 242 | 3.3 | NEW | |
| Majority | 1,467 | 19.8 | |||
| Turnout | 7,400 | 41.4 | |||
| Conservative hold | Swing | - | |||
| Party | Candidate | Votes | % | ±% | |
|---|---|---|---|---|---|
| Conservative | Alden, J. | 3,821 | 54.3 | ||
| Labour | Bridger, D. | 2,089 | 29.7 | ||
| Alliance | Vaughan, C. | 926 | 13.2 | ||
| Ecology | Hurdley, J. | 152 | 2.2 | ||
| Communist | Davis, P. | 43 | 0.6 | NEW | |
| Majority | 1,732 | 24.6 | |||
| Turnout | 7,031 | 39.3 | |||
| Conservative hold | Swing | - | |||
| Party | Candidate | Votes | % | ±% | |
|---|---|---|---|---|---|
| Conservative | Zissman, B. | 4,249 | 57.5 | ||
| Labour | Bridger, D. | 1,775 | 24.0 | ||
| Alliance | Vaughan, C. | 1,123 | 15.2 | ||
| Ecology | Hurdley, J. | 241 | 3.3 | ||
| Majority | 2,474 | 33.5 | |||
| Turnout | 7,388 | 41.2 | |||
| Conservative hold | Swing | - | |||
| Party | Candidate | Votes | % | ±% | |
|---|---|---|---|---|---|
| Conservative | Hollingworth, P. | 3,910 | 48.3 | ||
| Conservative | Bailey, J. | 3,544 | |||
| Conservative | Zissman, B. | 3,506 | |||
| Alliance | Chitham, E. | 1,939 | 24.0 | NEW | |
| Alliance | Holt, R. | 1,702 | |||
| Labour | Bridger, D. | 1,693 | 20.9 | ||
| Labour | Green, D. | 1,655 | |||
| Alliance | Wheldall, K. | 1,647 | - | ||
| Labour | Hadley, P. | 1,558 | - | ||
| Ecology | Hurdley, J. | 546 | 6.8 | ||
| Majority | - | 24.4 | |||
| Turnout | - | 42.5 | |||
| Conservative hold | Swing | - | |||
| Conservative hold | Swing | - | |||
| Conservative hold | Swing | - | |||
| Party | Candidate | Votes | % | ±% | |
|---|---|---|---|---|---|
| Conservative | ZIssman, B. | 3,229 | 53.6 | ||
| Labour | Lovekin, I. | 1,701 | 28.2 | ||
| Liberal | Weston, C. | 653 | 10.8 | NEW | |
| Ecology | Hunt, R. | 365 | 6.1 | NEW | |
| E&D | Goulden, D. | 76 | 1.3 | NEW | |
| Majority | 1,528 | 25.4 | |||
| Turnout | 6,024 | 32.9 | |||
| Conservative hold | Swing | - | |||
1970s[]
| Party | Candidate | Votes | % | ±% | |
|---|---|---|---|---|---|
| Conservative | Bailey, J. | 8,316 | 64.2 | ||
| Labour | Allcock, R. | 4,639 | 35.8 | ||
| Majority | 1,677 | 28.4 | |||
| Turnout | 12,955 | 70.0 | |||
| Conservative hold | Swing | - | |||
| Party | Candidate | Votes | % | ±% | |
|---|---|---|---|---|---|
| Conservative | Hollingworth, P. | 4,219 | 69.3 | ||
| Labour | Eynon, G. | 1,482 | 24.3 | ||
| Liberal | Kierman, P. | 387 | 6.4 | ||
| Majority | 2,737 | 45.0 | |||
| Turnout | 6,088 | 33.2 | |||
| Conservative hold | Swing | - | |||
| Party | Candidate | Votes | % | ±% | |
|---|---|---|---|---|---|
| Conservative | Zissman, B. | 5,004 | 71.3 | ||
| Labour | Yapp, C. | 1,367 | 19.5 | ||
| Liberal | Eden, L. | 646 | 9.2 | ||
| Majority | 3,637 | 51.8 | |||
| Turnout | 7,017 | 37.8 | |||
| Conservative hold | Swing | - | |||
| Party | Candidate | Votes | % | ±% | |
|---|---|---|---|---|---|
| Conservative | Bailey, J. | 3,939 | 63.5 | ||
| Labour | Paris, C. | 1,111 | 17.9 | ||
| Liberal | Eden, L. | 771 | 12.4 | ||
| National Front | Barlow, R. | 294 | 4.7 | NEW | |
| Independent Liberal | Goulden, D. | 93 | 1.5 | NEW | |
| Majority | 2,828 | 45.6 | |||
| Turnout | 6,208 | 32.6 | |||
| Conservative hold | Swing | - | |||
| Party | Candidate | Votes | % | ±% | |
|---|---|---|---|---|---|
| Conservative | Hollingworth, P. | 3,490 | 63.0 | {{{change}}} | |
| Conservative | Zissman, B. | 3,318 | - | ||
| Conservative | Bailey, J. | 3,265 | - | ||
| Labour | Griffiths, B. | 1,348 | 24.3 | ||
| Labour | Symons, A. | 1,268 | |||
| Labour | Knowles, R. | 1,168 | - | ||
| Liberal | Goulden, D. | 705 | 12.7 | - | |
| Liberal | Snow, R. | 659 | - | ||
| Liberal | Bates, K. | 632 | - | ||
| Majority | - | 38.6 | - | ||
| Turnout | - | 29.2 | - | ||
| Conservative win | (new seat) | ||||
| Conservative win | (new seat) | ||||
| Conservative win | (new seat) | ||||
Birmingham council constituencies and wards | ||
| Edgbaston | 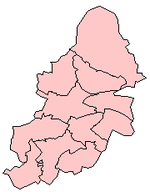 | |
| Erdington | ||
| Hall Green | ||
| Hodge Hill | ||
| Ladywood | ||
| Northfield | ||
| Perry Barr | ||
| Selly Oak | ||
| Sutton Coldfield | ||
| Yardley | ||
References[]
- ^ "Birmingham Ward population 2011". Retrieved 14 December 2015.
- ^ "Birmingham Ward ethnic group 2011". Retrieved 6 April 2017.
- ^ "Birmingham Ward last worked 2011". Retrieved 6 April 2017.
- ^ "Birmingham Ward population 2011". Retrieved 6 April 2017.
- ^ "Councillor Jayne Francis". Birmingham City Council. Retrieved 6 April 2017.
- ^ Elections Centre, University of Plymouth. "Birmingham City Council Elections 1973-2012" (PDF).
{{cite web}}: CS1 maint: url-status (link) - ^ "Birmingham City Council Election Results 2007". Birmingham City Council. Retrieved 6 April 2017.
- ^ "Birmingham City Council Election Results 2006". Birmingham City Council. Retrieved 6 April 2017.
- ^ "Birmingham City Council Election Results 2004". Birmingham City Council. Retrieved 6 April 2017.
- ^ a b c "Birmingham City Council Election Results 1998-2002". Birmingham City Council. Retrieved 6 April 2017.
- Wards of Birmingham, West Midlands
- Harborne