La Gabarra
La Gabarra | |
|---|---|
 La Gabarra Location in Norte de Santander Department and Colombia | |
| Coordinates: 9°0′0.5″N 72°53′49.4″W / 9.000139°N 72.897056°WCoordinates: 9°0′0.5″N 72°53′49.4″W / 9.000139°N 72.897056°W | |
| Country | |
| Department | Norte de Santander |
| Municipality | Tibú municipality |
| Elevation | 144 ft (44 m) |
| Population (2018) | |
| • Total | 4,986 [1] |
| Time zone | UTC-5 (Colombia Standard Time) |
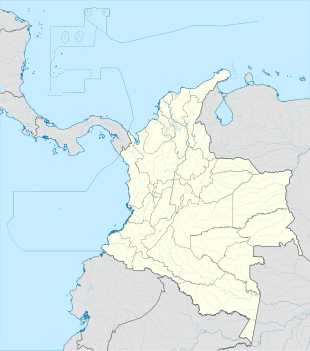

La Gabarra is a village in Tibù Municipality, Norte de Santander Department in Colombia.
Climate[]
La Gabarra has a tropical rainforest climate (Af) with heavy rainfall from January to March and very heavy rainfall in the remaining months with extremely heavy rainfall in October and November.
| Climate data for La Gabarra | |||||||||||||
|---|---|---|---|---|---|---|---|---|---|---|---|---|---|
| Month | Jan | Feb | Mar | Apr | May | Jun | Jul | Aug | Sep | Oct | Nov | Dec | Year |
| Average high °C (°F) | 32.2 (90.0) |
32.5 (90.5) |
32.8 (91.0) |
32.3 (90.1) |
32.3 (90.1) |
32.2 (90.0) |
32.6 (90.7) |
32.8 (91.0) |
32.3 (90.1) |
31.6 (88.9) |
31.4 (88.5) |
31.7 (89.1) |
32.2 (90.0) |
| Daily mean °C (°F) | 26.8 (80.2) |
27.0 (80.6) |
27.7 (81.9) |
27.8 (82.0) |
28.0 (82.4) |
27.7 (81.9) |
27.8 (82.0) |
28.0 (82.4) |
27.8 (82.0) |
27.5 (81.5) |
27.2 (81.0) |
26.9 (80.4) |
27.5 (81.5) |
| Average low °C (°F) | 21.4 (70.5) |
21.6 (70.9) |
22.7 (72.9) |
23.3 (73.9) |
23.7 (74.7) |
23.3 (73.9) |
23.0 (73.4) |
23.2 (73.8) |
23.3 (73.9) |
23.4 (74.1) |
23.0 (73.4) |
22.2 (72.0) |
22.8 (73.1) |
| Average rainfall mm (inches) | 139.4 (5.49) |
130.6 (5.14) |
178.3 (7.02) |
473.1 (18.63) |
581.2 (22.88) |
424.9 (16.73) |
399.5 (15.73) |
500.8 (19.72) |
545.9 (21.49) |
764.9 (30.11) |
672.8 (26.49) |
373.5 (14.70) |
5,184.9 (204.13) |
| Source: IDEAM (as Puerto Barco)[2] | |||||||||||||
References[]
- ^ "La Gabarra (Tibú, Norte de Santander, Colombia) - Population Statistics, Charts, Map, Location, Weather and Web Information". www.citypopulation.de.
- ^ "Data". www.ideam.gov.co. Retrieved 2021-01-22.
This Colombian location article is a stub. You can help Wikipedia by . |
Categories:
- Populated places in the Norte de Santander Department
- Colombia geography stubs