List of administrative divisions of Greater China by Human Development Index
 | |
| First or provincial level Administrative divisions of China by: | |
|---|---|
|
|
This is a list of the first-level administrative divisions of the People's Republic of China (PRC), including all provinces, autonomous regions, municipalities, and special administrative regions in order of their Human Development Index (HDI), alongside the Republic of China (ROC, Taiwan). The 2018/2019 figures for PRC/ROC divisions come from the Subnational Human Development Index (SHDI), published by the Global Data Lab at Radboud University. This report did not cover Macau, a special administrative region of the PRC. Only divisions of Mainland China are ranked in the list as China's average figure which given by the UNDP Human Development Report is exclusively for mainland only.
List of administrative divisions by HDI[]

The Subnational Human Development Database (2019 data)[]
| Rank | Provincial-level division / National average | HDI [1] | Comparable country[2][a] |
|---|---|---|---|
| Very high human development | |||
| – | 0.949 | ||
| – | 0.922[c] | ||
| – | 0.916[e] | ||
| 1 | Beijing | 0.904 | |
| 2 | Shanghai | 0.873 | |
| 3 | Tianjin | 0.838 | |
| 4 | Jiangsu | 0.803 | |
| High human development | |||
| 5 | Zhejiang | 0.795 | |
| 6 | Guangdong | 0.793 | |
| 7 | Liaoning | 0.774 | |
| 8 | Inner Mongolia | 0.771 | |
| 9 | Fujian | 0.769 | |
| Hubei | |||
| 11 | Chongqing | 0.768 | |
| 12 | Hainan | 0.763 | |
| 13 | Shaanxi | 0.762 | |
| – | 0.761 | ||
| 14 | Shandong | 0.759 | |
| 15 | Hunan | 0.755 | |
| 16 | Shanxi | 0.752 | |
| 17 | Jilin | 0.745 | |
| 18 | Henan | 0.742 | |
| 19 | Jiangxi | 0.741 | |
| 20 | Anhui | 0.738 | |
| Hebei | |||
| 22 | Heilongjiang | 0.737 | |
| 23 | Sichuan | 0.734 | |
| 24 | Xinjiang | 0.732 | |
| 25 | Guangxi | 0.728 | |
| Ningxia | |||
| Medium human development | |||
| 27 | Yunnan | 0.691 | |
| 28 | Qinghai | 0.689 | |
| 29 | Gansu | 0.687 | |
| 30 | Guizhou | 0.685 | |
| 31 | Tibet | 0.608 | |
Notes:
- ^ Compared according to the dataset, but not given in the original source.
- ^ Jump up to: a b Hong Kong and Macau are special administrative regions of the People's Republic of China.
- ^ Macao's HDI is not included in the SHDI database or any UNDP annual report. According to the 2021 annual report published by Statistics and Census Service of the Government of Macao Special Administrative Region, the HDI for Macau was 0.922 in 2019.[3]
- ^ Taiwan is under separate rule by the Republic of China as a de facto independent state since 1950, but is claimed by the People's Republic of China as a province. The ROC also claims the mainland as its constitutional-defined territory.[4]
- ^ In the 2018 Subnational Human Development Index (SHDI) Database, from which the HDIs of every first-level administrative regions of China except Macao are acquired, Taiwan's HDI was 0.880.[5] However, from 2019 onward, Taiwan and Hong Kong are no longer included in the SHDI Database among Chinese divisions.[1] By contrast, the HDIs which published by the Statistical Bureau of Taiwan in its 2019 & 2020 reports were displayed as 0.911 in 2018, and 0.916 in 2019 respectively.[6][7] The cause of discrepancy was due to lack of available national data in the UNDP database for Taiwan. The SHDI claimed that the data collection for Taiwan was also derived from the Taiwanese Directorate General of Budget, Accounting and Statistics;[8] in this list the latter source is used as primary data.
- ^ Figures refer to mainland China only.[9]
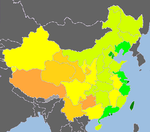
Trend[]
| Legend | ||||
|---|---|---|---|---|
|
Very High human development 0.900 and above
0.850–0.899
0.800–0.849
|
High human development 0.750–0.799
0.700–0.749
|
Medium human development 0.650–0.699
0.600–0.649
0.550–0.599
|
Data unavailable
| |
- 2010-2014 HDI

2014 data

2010 data


| Legend | ||||
|---|---|---|---|---|
|
Very High human development 0.900–0.949
|
High human development 0.850–0.899
0.800–0.849
|
Medium human development 0.750–0.799
0.700–0.749
0.650–0.699
0.600–0.649
0.550–0.599
0.500–0.549
|
Low human development 0.450–0.499
0.400–0.449
0.350–0.399
|
Data unavailable
|
- 1982-2008 HDI

2008 data
2005 data

2003 data

1999 data

1997 data
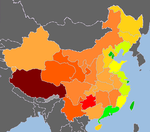
1995 data

1990 data

1982 data


See also[]
References[]
- ^ Jump up to: a b "Human Development Indices (5.0)- China". Global Data Lab. Retrieved 9 June 2021.
- ^ "Human Development Report 2020 The Next Frontier: Human Development and the Anthropocene" (PDF). hdr.undp.org.
- ^ "Macau in Figures, 2021". 澳門統計暨普查局(DSEC). p. 4. Retrieved 2021-06-09.
- ^ "Taiwan Country Profile". World Affairs Journal. Retrieved 2020-08-29.
- ^ "GDL Area Database". Subnational Human Development Index (SHDI). Retrieved 12 March 2021.
- ^ "國情統計通報(第 019 號)" (PDF) (in Chinese). Directorate General of Budget, Accounting and Statistics, Executive Yuan, Taiwan (ROC). 4 February 2020. Retrieved 26 January 2021.
- ^ "國情統計通報(第 014 號)" (PDF) (in Chinese). Directorate General of Budget, Accounting and Statistics, Executive Yuan, Taiwan (ROC). 21 January 2021. Retrieved 26 January 2021.
- ^ Smits, J., Permanyer, I. (12 March 2019). "The Subnational Human Development Database. Sci Data 6, 190038". The Subnational Human Development Database. Retrieved 11 March 2021.CS1 maint: multiple names: authors list (link)
- ^ "Human Development Report 2020: Reader's Guide". United Nation Development Program. 2020. Retrieved 12 March 2021.
External links[]
- Ranked lists of Chinese administrative divisions
- Demographics of China
- Human Development Index
- Economy of China by province
- Economy of China-related lists