List of countries by proven oil reserves
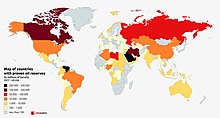


This is a list of countries by proven oil reserves. Proven reserves are those quantities of petroleum which, by analysis of geological and engineering data, can be estimated, with a high degree of confidence, to be commercially recoverable from a given date forward from known reservoirs and under current economic conditions.
Some statistics on this page are disputed and controversial. Different sources (OPEC, CIA World Factbook, oil companies) give different figures. Some of the differences reflect different types of oil included. Different estimates may or may not include oil shale, mined oil sands or natural gas liquids.
Because proven reserves include oil recoverable under current economic conditions, nations may see large increases in proven reserves when known, but previously uneconomic deposits become economic to develop. In this way, Canada's proven reserves increased suddenly in 2003 when the oil sands of Alberta were seen to be economically viable. Similarly, Venezuela's proven reserves jumped in the late 2000s when the heavy oil of the Orinoco Belt was judged economic.
Sources[]
Sources sometimes differ on the volume of proven oil reserves. The differences sometimes result from different classes of oil included, and sometimes result from different definitions of proven.
Comparison of proven oil reserves from some widely used sources (billions of barrels, as of 31 Dec. 2014/1 Jan. 2015)
| Source | Canada | Iran | Iraq | Russia | Saudi Arabia | United States | Venezuela |
|---|---|---|---|---|---|---|---|
| BP[1] | 172.9 | 157.8 | 143 | 103.2 | 267.0 | 48.5 | 298.3 |
| OPEC[2] | 4.2 | 157.5 | 147.2 | 80.0 | 266.6 | 36.5 | 300.0 |
| US CIA[3] | 171.0 | 157.8 | 147 | 103.2 | 268.3 | 36.5 | 298.4 |
| US EIA[4] | 172.5 | 157.8 | 145 | 80.0 | 268.3 | 39.9 | 298.4 |
Countries[]
Reserves amounts are listed in millions of barrels. The column "Years of production in reserve" uses the daily production figures as of 2016[5] (multiplied with 365).
* indicates "Oil reserves in COUNTRY or TERRITORY" or "Energy in COUNTRY or TERRITORY" links.
| Country | US EIA [6] |
OPEC [7] |
BP [8] |
Others | Production[5] (million bbl/year) |
Years of production in reserve |
|---|---|---|---|---|---|---|
| 303,806 | 302,809 | 300,900 | 831.1 | 366 | ||
| 258,600 | 266,260 | 266,000 | 3,818.1 | 68 | ||
| 208,600 | [9] 208,600 | 155,600 | 1,452.9 | 144 | ||
| 170,300 | 4,421 | 172,200 | [10] 171,000 | 1,336.8 | 127 | |
| 145,019 | 147,223 | 143,100 | 1,624.8 | 89 | ||
| 101,500 | 104,000 | 104,000 | 1,067.2 | 95 | ||
| 97,800 | 98,630 | 98,630 | 1,133.7 | 86 | ||
| 80,000 | 80,000 | 102,400 | 3,851.3 | 21 | ||
| 48,363 | 74,363 | 78,400 | 366.1 | 132 | ||
| 47,107 | 32,773 | 55,000 | [11] 43,629 | 3,239.7 | 15 | |
| 36,890 | 37,453 | 37,100 | 730.0 | 51 | ||
| 30,000 | 30,000 | 30,000 | 582.2 | 52 | ||
| 26,022 | 25,627 | 18,500 | 1,452.9 | 18 | ||
| 25,244 | 25,244 | 25,244 | 555.9 | 45 | ||
| 12,714 | 12,634 | 13,000 | [11] 16,848 | 918.1 | 14 | |
| 12,200 | 12,200 | 12,200 | 492.1 | 25 | ||
| 10,000[12] | ||||||
| 8,273 | 8,273 | 8,000 | 200.2 | 41 | ||
| 8,122 | 6,376 | 8,000 | 601.5 | 14 | ||
| 7,783 | 8,384 | 12,700 | 645.9 | 12 | ||
| 7,000 | 7,000 | 7,000 | 304.2 | 23 | ||
| 5,786 | 6,537 | 10,800 | [13] 9.700 | 798.2 | 7 | |
| 5,373 | 5,373 | 5,300 | 367.5 | 15 | ||
| 5,000 | 5,000 | 1,500 | 93.1 | 54 | ||
| 4,604 | 4,495 | 5,680 | [11] 4,409 | 267 | 17 | |
| 4,400 | 4,400 | 4,000 | 110.2 | 40 | ||
| 3,600 | 3,600 | 3,600 | [11] 5,542 | 241.3 | 15 | |
| 3,300 | 4,400 | 3,500 | 180.4 | 18 | ||
| 3,000 | 3,000 | |||||
| 2,882 | 1,600 | |||||
| 2,500 | 2,069 | 2,800 | 2,618 | 343.1 | 7 | |
| 2,500 | 2,500 | 2,500 | ||||
| 2,500 | ||||||
| 2,482 | 2,162 | 2,400 | 2,330 | |||
| 2,480 | 3,310 | 3,600 | [11] 3,497 | 304.2 | 8 | |
| 2,446 | 3,985 | 4,000 | 4,002 | |||
| 2,036 | 1,665 | 2,300 | ||||
| 2,000 | 2,000 | 2,000 | ||||
| 1,500 | 1,500 | |||||
| 1,100 | 1,100 | 1,100 | ||||
| 1,100 | 1,100 | |||||
| 858 | 1,400 | [11] 1,489 | ||||
| 660 | ||||||
| 600 | 600 | |||||
| 600 | 600 | 600 | ||||
| 594 | 594 | 600 | ||||
| 540 | [11] 236 | |||||
| 497 | 600 | [11] 595 | ||||
| 441 | 439 | 600 | [11] 550 | |||
| 425 | 400 | |||||
| 395 | 395 | |||||
| 366 | [11] 284 | |||||
| 252 | 400 | |||||
| 242 | 700 | [11] 830 | ||||
| 240 | [11] 210 | |||||
| 200 | ||||||
| 198 | 198 | |||||
| 186 | ||||||
| 180 | ||||||
| 159 | [11] 158 | |||||
| 150 | ||||||
| 150 | ||||||
| 150 | ||||||
| 150 | ||||||
| 139 | ||||||
| 138 | ||||||
| 137 | [11] 141 | |||||
| 124 | [11] 124 | |||||
| 115 | [11] 229 | |||||
| 113 | [11] 151 | |||||
| 100 | ||||||
| 89 | ||||||
| 86 | ||||||
| 77 | ||||||
| 71 | ||||||
| 61 | ||||||
| 44 | ||||||
| 40 | ||||||
| 40 | ||||||
| 35 | ||||||
| 35 | ||||||
| 28 | ||||||
| 20 | ||||||
| 15 | ||||||
| 15 | 15.0 | |||||
| 15 | 15 | |||||
| 12 | [11] 12 | |||||
| 12 | [11] 35 | |||||
| 12 | ||||||
| 12 | ||||||
| 10 | ||||||
| 9 | ||||||
| 8 | ||||||
| 6 | ||||||
| 2 | ||||||
| 1 | ||||||
| 1 | [11] 1 | |||||
| 0.6 | ||||||
| 0.4 | ||||||
| 0 | 750 | |||||
| World | 1,661,905 | 1,535,773 | 1,750,600 | 29,427 | 56 |
See also[]
- List of countries by oil production
- List of countries by oil consumption
- List of countries by natural gas proven reserves
References[]
- ^ BP Statistical Review of World Energy, 2015
- ^ OPEC Statistical Bulletin, 2015.
- ^ World Factbook, US Central Intelligence Agency, 2015.
- ^ "U.S. Crude Oil plus Lease Condensate Proved Reserves". www.eia.gov. Retrieved 13 June 2021.
- ^ a b "Production of Crude Oil including Lease Condensate 2016" (CVS download). U.S. Energy Information Administration. Retrieved 27 May 2017.
- ^ U.S. Energy Information Administration, International Energy Statistics, crude oil including lease condensate, accessed 17 June 2,020.
- ^ Economou, Andreas; Fattouh, Bassam (7 May 2021). "OPEC at 60: the world with and without OPEC". OPEC Energy Review. 45: 3–28. doi:10.1111/opec.12205. ISSN 1753-0229.
- ^ "Figure 3—figure supplement 1. All 188 single base-pair M2R quartets for add riboswitch". 15 February 2018. doi:10.7554/elife.29602.009. Cite journal requires
|journal=(help) - ^ "OPEC : Iran". www.opec.org. Retrieved 13 June 2021.
- ^ Oil Resources, Natural Resources Canada, 16 Feb. 2,016.
- ^ a b c d e f g h i j k l m n o p q r s t Reolon, Dario; Di Maggio, Federica; Moriggi, Sara; Galli, Giuseppe; Pirrone, Marco (24 June 2020). "Unlocking Data Analytics for the Automatic Evaluation of Cement Bond Scenarios". SPWLA 61st Annual Online Symposium Transactions. Society of Petrophysicists and Well Log Analysts. doi:10.30632/spwla-5060.
- ^ "ExxonMobil increases Stabroek resource estimate to approximately 10 billion barrels". ExxonMobil. Retrieved 21 January 2022.
- ^ "Request Rejected". www.pemex.com. Retrieved 13 June 2021.
- Energy-related lists by country
- Petroleum by country
- Petroleum economics
- Lists of countries
- Oil reserves by country