Mühledorf, Solothurn
Mühledorf | |
|---|---|
 | |
 Coat of arms | |
show Location of Mühledorf | |
 Mühledorf | |
| Coordinates: 47°08′N 7°29′E / 47.133°N 7.483°ECoordinates: 47°08′N 7°29′E / 47.133°N 7.483°E | |
| Country | Switzerland |
| Canton | Solothurn |
| District | Bucheggberg |
| Area | |
| • Total | 3.32 km2 (1.28 sq mi) |
| Elevation | 557 m (1,827 ft) |
| Population (Dec 2011) | |
| • Total | 336 |
| • Density | 100/km2 (260/sq mi) |
| Time zone | UTC+01:00 (Central European Time) |
| • Summer (DST) | UTC+02:00 (Central European Summer Time) |
| Postal code(s) | 4583 |
| SFOS number | 2458 |
| Surrounded by | Aetigkofen, Aetingen, Brügglen, Hessigkofen, Lüterswil-Gächliwil, Tscheppach, Unterramsern |
| Website | www SFSO statistics |


Mühledorf is a former municipality in the Bucheggberg District, in the canton of Solothurn, Switzerland. On 1 January 2014 the former municipalities of Mühledorf (SO), Tscheppach, Brügglen, Aetingen, Aetigkofen, Bibern (SO), Gossliwil, Hessigkofen, Küttigkofen, Kyburg-Buchegg merged into the new municipality of Buchegg.[1]
History[]
Mühledorf is first mentioned around 1264 as Mulidorf though this is from a copy from 1415-20. In 1276 it was mentioned as Mvlidorf.[2]
Geography[]

Before the merger, Mühledorf had a total area of 3.3 km2 (1.3 sq mi).[3] Of this area, 1.8 km2 (0.69 sq mi) or 54.9% is used for agricultural purposes, while 1.26 km2 (0.49 sq mi) or 38.4% is forested. Of the rest of the land, 0.25 km2 (0.097 sq mi) or 7.6% is settled (buildings or roads) and 0.01 km2 (2.5 acres) or 0.3% is unproductive land.[4]
Of the built up area, housing and buildings made up 4.9% and transportation infrastructure made up 1.8%. Out of the forested land, 37.2% of the total land area is heavily forested and 1.2% is covered with orchards or small clusters of trees. Of the agricultural land, 35.1% is used for growing crops and 17.1% is pastures, while 2.7% is used for orchards or vine crops.[4]
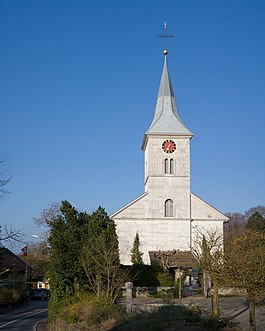
The former municipality is located in the Bucheggberg district, in the Mühle valley. It consists of the linear village of Mühledorf.
Coat of arms[]
The blazon of the municipal coat of arms is Or a Mill-Wheel Sable.[5]
Demographics[]
Mühledorf had a population (as of 2011) of 336.[3] As of 2008, 0.9% of the population are resident foreign nationals.[6] Over the last 10 years (1999–2009) the population has changed at a rate of 1.5%.[3]
Most of the population (as of 2000) speaks German (321 or 97.9%), with French being second most common (4 or 1.2%) and Italian being third (1 or 0.3%).[7]
As of 2008, the gender distribution of the population was 48.5% male and 51.5% female. The population was made up of 163 Swiss men (47.4% of the population) and 4 (1.2%) non-Swiss men. There were 171 Swiss women (49.7%) and 6 (1.7%) non-Swiss women.[8] Of the population in the municipality 102 or about 31.1% were born in Mühledorf and lived there in 2000. There were 89 or 27.1% who were born in the same canton, while 124 or 37.8% were born somewhere else in Switzerland, and 10 or 3.0% were born outside of Switzerland.[7]
In 2008 there were 4 live births to Swiss citizens and were 4 deaths of Swiss citizens. Ignoring immigration and emigration, the population of Swiss citizens remained the same while the foreign population remained the same. There were 2 Swiss men who immigrated back to Switzerland. At the same time, there were 2 non-Swiss men who immigrated from another country to Switzerland. The total Swiss population change in 2008 (from all sources, including moves across municipal borders) was a decrease of 14 and the non-Swiss population increased by 1 person. This represents a population growth rate of -3.6%.[6]
The age distribution, as of 2000, in Mühledorf is; 30 children or 9.1% of the population are between 0 and 6 years old and 73 teenagers or 22.3% are between 7 and 19. Of the adult population, 21 people or 6.4% of the population are between 20 and 24 years old. 94 people or 28.7% are between 25 and 44, and 72 people or 22.0% are between 45 and 64. The senior population distribution is 26 people or 7.9% of the population are between 65 and 79 years old and there are 12 people or 3.7% who are over 80.[9]
As of 2000, there were 142 people who were single and never married in the municipality. There were 154 married individuals, 20 widows or widowers and 12 individuals who are divorced.[7]
In 2000 there were 54 single family homes (or 52.4% of the total) out of a total of 103 inhabited buildings. There were 12 multi-family buildings (11.7%), along with 29 multi-purpose buildings that were mostly used for housing (28.2%) and 8 other use buildings (commercial or industrial) that also had some housing (7.8%).[10]
In 2000 there were 132 apartments in the municipality. Of these apartments, a total of 113 apartments (85.6% of the total) were permanently occupied, while 11 apartments (8.3%) were seasonally occupied and 8 apartments (6.1%) were empty.[10] As of 2009, the construction rate of new housing units was 2.9 new units per 1000 residents.[3] The vacancy rate for the municipality, in 2010, was 0.71%.[3]
The historical population is given in the following chart:[2][11]

Politics[]
In the 2007 federal election the most popular party was the FDP which received 34.8% of the vote. The next three most popular parties were the SP (22.97%), the SVP (22.28%) and the Green Party (11.05%). In the federal election, a total of 167 votes were cast, and the voter turnout was 59.9%.[12]
Economy[]
As of 2010, Mühledorf had an unemployment rate of 1.9%. As of 2008, there were 40 people employed in the primary economic sector and about 14 businesses involved in this sector. 20 people were employed in the secondary sector and there were 6 businesses in this sector. 62 people were employed in the tertiary sector, with 8 businesses in this sector.[3] There were 173 residents of the municipality who were employed in some capacity, of which females made up 46.2% of the workforce.
In 2008 the total number of full-time equivalent jobs was 85. The number of jobs in the primary sector was 28, of which 22 were in agriculture and 6 were in forestry or lumber production. The number of jobs in the secondary sector was 16 of which 9 or (56.3%) were in manufacturing and 7 (43.8%) were in construction. The number of jobs in the tertiary sector was 41. In the tertiary sector; 12 or 29.3% were in wholesale or retail sales or the repair of motor vehicles, 8 or 19.5% were in the movement and storage of goods, 12 or 29.3% were in a hotel or restaurant, 4 or 9.8% were technical professionals or scientists, .[13]
In 2000, there were 67 workers who commuted into the municipality and 107 workers who commuted away. The municipality is a net exporter of workers, with about 1.6 workers leaving the municipality for every one entering.[14] Of the working population, 11% used public transportation to get to work, and 56.6% used a private car.[3]
Religion[]
From the 2000 census, 38 or 11.6% were Roman Catholic, while 241 or 73.5% belonged to the Swiss Reformed Church. Of the rest of the population, and there were 2 individuals (or about 0.61% of the population) who belonged to another Christian church. 40 (or about 12.20% of the population) belonged to no church, are agnostic or atheist, and 7 individuals (or about 2.13% of the population) did not answer the question.[7]
Education[]
In Mühledorf about 135 or (41.2%) of the population have completed non-mandatory upper secondary education, and 46 or (14.0%) have completed additional higher education (either university or a Fachhochschule). Of the 46 who completed tertiary schooling, 69.6% were Swiss men, 28.3% were Swiss women.[7]
As of 2000, there was one student in Mühledorf who came from another municipality, while 69 residents attended schools outside the municipality.[14]
References[]
- ^ Nomenklaturen – Amtliches Gemeindeverzeichnis der Schweiz (in German) accessed 13 December 2014
- ^ Jump up to: a b Mühledorf in German, French and Italian in the online Historical Dictionary of Switzerland.
- ^ Jump up to: a b c d e f g Swiss Federal Statistical Office accessed 8 January 2014
- ^ Jump up to: a b Swiss Federal Statistical Office-Land Use Statistics 2009 data (in German) accessed 25 March 2010
- ^ Flags of the World.com accessed 21-March-2011
- ^ Jump up to: a b Swiss Federal Statistical Office - Superweb database - Gemeinde Statistics 1981-2008 (in German) accessed 19 June 2010
- ^ Jump up to: a b c d e STAT-TAB Datenwürfel für Thema 40.3 - 2000 Archived 2013-08-09 at the Wayback Machine (in German) accessed 2 February 2011
- ^ Canton of Solothurn Statistics - Wohnbevölkerung der Gemeinden nach Nationalität und Geschlecht Archived 2011-03-05 at the Wayback Machine (in German) accessed 11 March 2011
- ^ Canton of Solothurn Statistics - Wohnbevölkerung nach Gemeinden, Nationalität, Altersgruppen und Zivilstand, Total (Männer + Frauen) Archived 2011-07-07 at the Wayback Machine (in German) accessed 11 March 2011
- ^ Jump up to: a b Federal Statistical Office STAT-TAB - Datenwürfel für Thema 09.2 - Gebäude und Wohnungen Archived 2015-01-21 at the Wayback Machine (in German) accessed 28 January 2011
- ^ Swiss Federal Statistical Office STAT-TAB Bevölkerungsentwicklung nach Region, 1850-2000 Archived 2014-09-30 at the Wayback Machine (in German) accessed 29 January 2011
- ^ Swiss Federal Statistical Office, Nationalratswahlen 2007: St��rke der Parteien und Wahlbeteiligung, nach Gemeinden/Bezirk/Canton (in German) accessed 28 May 2010
- ^ Swiss Federal Statistical Office STAT-TAB Betriebszählung: Arbeitsstätten nach Gemeinde und NOGA 2008 (Abschnitte), Sektoren 1-3 Archived 2014-12-25 at the Wayback Machine (in German) accessed 28 January 2011
- ^ Jump up to: a b Swiss Federal Statistical Office - Statweb Archived 2012-08-04 at archive.today (in German) accessed 24 June 2010
External links[]
| Wikimedia Commons has media related to Mühledorf SO. |
- Official website
- Mühledorf (SO) in German, French and Italian in the online Historical Dictionary of Switzerland.
| show Authority control |
|---|
- Former municipalities of the canton of Solothurn
- Populated places disestablished in 2014