MRI sequence

An MRI sequence in magnetic resonance imaging (MRI) is a particular setting of pulse sequences and pulsed field gradients, resulting in a particular image appearance.[1]
A multiparametric MRI is a combination of two or more sequences, and/or including other specialized MRI configurations such as spectroscopy.[2][3]
Overview table
This table does not include uncommon and experimental sequences.
| Group | Sequence | Abbr. | Physics | Main clinical distinctions | Example |
|---|---|---|---|---|---|
| Spin echo | T1 weighted | T1 | Measuring spin–lattice relaxation by using a short repetition time (TR) and echo time (TE). |
Standard foundation and comparison for other sequences |

|
| T2 weighted | T2 | Measuring spin–spin relaxation by using long TR and TE times |
Standard foundation and comparison for other sequences |

| |
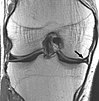
| Proton density weighted | PD | Long TR (to reduce T1) and short TE (to minimize T2).[7] | Joint disease and injury.[8]
|
| |
| Gradient echo (GRE) | Steady-state free precession | SSFP | Maintenance of a steady, residual transverse magnetisation over successive cycles.[10] | Creation of cardiac MRI videos (pictured).[10] | 
|
| Effective T2 or "T2-star" |
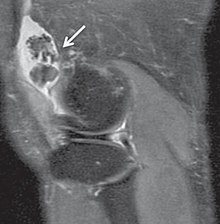
T2* | Spoiled gradient recalled echo (GRE) with a long echo time and small flip angle[11] | Low signal from hemosiderin deposits (pictured) and hemorrhages.[11] | 
| |
| Susceptibility-weighted | SWI | Spoiled gradient recalled echo (GRE), fully flow compensated, long echo time, combines phase image with magnitude image[12] | Detecting small amounts of hemorrhage (diffuse axonal injury pictured) or calcium.[12] | 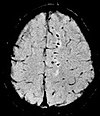
| |
| Inversion recovery | Short tau inversion recovery | STIR | Fat suppression by setting an inversion time where the signal of fat is zero.[13] | High signal in edema, such as in more severe stress fracture.[14] Shin splints pictured: | 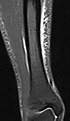
|
| Fluid-attenuated inversion recovery | FLAIR | Fluid suppression by setting an inversion time that nulls fluids | High signal in lacunar infarction, multiple sclerosis (MS) plaques, subarachnoid haemorrhage and meningitis (pictured).[15] | 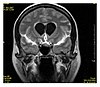
| |
| Double inversion recovery | DIR | Simultaneous suppression of cerebrospinal fluid and white matter by two inversion times.[16] | High signal of multiple sclerosis plaques (pictured).[16] | 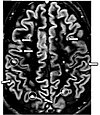
| |
| Diffusion weighted (DWI) | Conventional | DWI | Measure of Brownian motion of water molecules.[17] | High signal within minutes of cerebral infarction (pictured).[18] | 
|
| Apparent diffusion coefficient | ADC | Reduced T2 weighting by taking multiple conventional DWI images with different DWI weighting, and the change corresponds to diffusion.[19] | Low signal minutes after cerebral infarction (pictured).[20] | 
| |
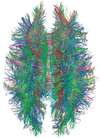
| Diffusion tensor | DTI | Mainly tractography (pictured) by an overall greater Brownian motion of water molecules in the directions of nerve fibers.[21] |
|
| |
| Perfusion weighted (PWI) | Dynamic susceptibility contrast | DSC | Measures changes over time in susceptibility-induced signal loss due to gadolinium contrast injection.[23] |
|

|
| Arterial spin labelling | ASL | Magnetic labeling of arterial blood below the imaging slab, which subsequently enters the region of interest.[25] It does not need gadolinium contrast.[26] | |||
| Dynamic contrast enhanced | DCE | Measures changes over time in the shortening of the spin–lattice relaxation (T1) induced by a gadolinium contrast bolus.[27] | Faster Gd contrast uptake along with other features is suggestive of malignancy (pictured).[28] | 
| |
| Functional MRI (fMRI) | Blood-oxygen-level dependent imaging | BOLD | Changes in oxygen saturation-dependent magnetism of hemoglobin reflects tissue activity.[29] | Localizing brain activity from performing an assigned task (e.g. talking, moving fingers) before surgery, also used in research of cognition.[30] | 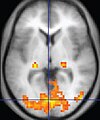
|
| Magnetic resonance angiography (MRA) and venography | Time-of-flight | TOF | Blood entering the imaged area is not yet magnetically saturated, giving it a much higher signal when using short echo time and flow compensation. | Detection of aneurysm, stenosis, or dissection[31] | 
|
| Phase-contrast magnetic resonance imaging | PC-MRA | Two gradients with equal magnitude, but opposite direction, are used to encode a phase shift, which is proportional to the velocity of spins.[32] | Detection of aneurysm, stenosis, or dissection (pictured).[31] | 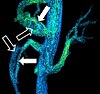 (VIPR) |
Spin echo[]
T1 and T2[]
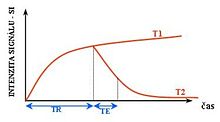
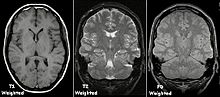
Each tissue returns to its equilibrium state after excitation by the independent relaxation processes of T1 (spin-lattice; that is, magnetization in the same direction as the static magnetic field) and T2 (spin-spin; transverse to the static magnetic field). To create a T1-weighted image, magnetization is allowed to recover before measuring the MR signal by changing the repetition time (TR). This image weighting is useful for assessing the cerebral cortex, identifying fatty tissue, characterizing focal liver lesions, and in general, obtaining morphological information, as well as for post-contrast imaging. To create a T2-weighted image, magnetization is allowed to decay before measuring the MR signal by changing the echo time (TE). This image weighting is useful for detecting edema and inflammation, revealing white matter lesions, and assessing zonal anatomy in the prostate and uterus.
The standard display of MRI images is to represent fluid characteristics in black and white images, where different tissues turn out as follows:
| Signal | T1-weighted | T2-weighted |
|---|---|---|
| High |
|
|
| Inter- mediate | Gray matter darker than white matter[35] | White matter darker than grey matter[35] |
| Low |
|
|
Proton density[]
Proton density (PD)- weighted images are created by having a long repetition time (TR) and a short echo time (TE).[36] On images of the brain, this sequence has a more pronounced distinction between gray matter (bright) and white matter (darker gray), but with little contrast between brain and CSF.[36] It is very useful for the detection of joint disease and injury.[37]
Gradient echo[]
A gradient echo sequence is the base of many important derived sequences such as echo-planar imaging and SSFP stationary sequences. It allows to obtain very short repetition times (TR), and therefore to acquire images in a short time.
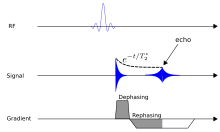
The gradient echo sequence is characterized by a single excitation followed by a gradient applied along the reading axis called the dephasing gradient. This gradient modifies the spin phase in a spatially dependent manner so that at the end of the gradient, the signal will be completely canceled because the coherence between the spins will be completely destroyed.
At this point, the reading gradient of opposite polarity is applied, so as to compensate for the effect of the disparity gradient. When the area of the reading gradient is equal to that of the mismatching gradient, the spins will have a coherent new phase (except for the effects of T2* relaxation), and therefore, a signal will be detectable again. This signal takes the name of echo, or more specifically, gradient echo signal, because it is produced by rephasing due to a gradient (unlike the spin echo signal, whose rephasing is due to a radiofrequency pulse).
The sequences of the gradient echo type allow to achieve very short repetition times since the acquisition of an echo corresponds to the acquisition of a k-space line, and this acquisition can be made quick by increasing the amplitude of the gradients of rephasing and reading. A sequence of the spin echo type must instead wait for the exhaustion of the signal that is formed spontaneously after the application of the excitation impulse before it can produce an echo (free induction decay).
For comparison purposes, the repetition time of a gradient echo sequence is of the order of 3 milliseconds, versus about 30 ms of a spin echo sequence.
Spoiling[]
At the end of the reading, the residual transverse magnetization can be terminated (through the application of suitable gradients and the excitation through pulses with a variable phase radiofrequency) or maintained.
In the first case there is a spoiled sequence, such as the FLASH (Fast Low-Angle Shot) sequence, while in the second case there are SSFP (Steady-state free precession imaging) sequences.
Steady-state free precession[]
Steady-state free precession imaging (SSFP MRI) is an MRI technique which uses steady states of magnetizations. In general, SSFP MRI sequences are based on a (low flip angle) gradient-echo MRI sequence with a short repetition time, which in its generic form has been described as the FLASH MRI technique. While spoiled gradient-echo sequences refer to a steady state of the longitudinal magnetization only, SSFP gradient-echo sequences include transverse coherences (magnetizations) from overlapping multi-order spin echoes and stimulated echoes. This is usually accomplished by refocusing the phase-encoding gradient in each repetition interval in order to keep the phase integral (or gradient moment) constant. Fully balanced SSFP MRI sequences achieve a phase of zero by refocusing all imaging gradients.
New methods and variants of existing methods are often published when they are able to produce better results in specific fields. Examples of these recent improvements are T*
2-weighted turbo spin-echo (T2 TSE MRI), double inversion recovery MRI (DIR-MRI) or phase-sensitive inversion recovery MRI (PSIR-MRI), all of them able to improve imaging of brain lesions.[39][40] Another example is MP-RAGE (magnetization-prepared rapid acquisition with gradient echo),[41] which improves images of multiple sclerosis cortical lesions.[42]
In-phase and out-of-phase[]
In-phase (IP) and out-of-phase (OOP) sequences correspond to paired gradient echo sequences using the same repetition time (TR) but with two different echo times (TE).[43] This can detect even microscopic amounts of fat, which has a drop in signal on OOP compared to IP. Among renal tumors that do not show macroscopic fat, such a signal drop is seen in 80% of the clear cell type of renal cell carcinoma as well as in minimal fat angiomyolipoma.[44]
Effective T2 (T2* or "T2-star")[]
T2*-weighted imaging can be created as a postexcitation refocused gradient echo sequence with small flip angle. The sequence of a GRE T2*WI requires high uniformity of the magnetic field.[45]
Commercial names of gradient echo sequences[]
| Academic Classification | Spoiled gradient echo | Steady-State Free Precession (SSFP) | Balanced Steady-State Free Precession (bSSFP) | ||
| Ordinary type | Turbo type (, extremely low angle shot, short TR) |
FID-like | Echo-like | ||
| Siemens | FLASH Fast Imaging using Low Angle Shot |
TurboFLASH Turbo FLASH |
FISP Fast Imaging with Steady-state Precession |
PSIF Reversed FISP |
TrueFISP True FISP |
| GE | SPGR Spoiled GRASS |
FastSPGR Fast SPGR |
GRASS Gradient Recall Acquisition using Steady States |
SSFP Steady State Free Precession |
FIESTA Fast Imaging Employing Steady-state Acquisition |
| Philips | T1 FFE T1-weighted Fast Field Echo |
TFE Turbo Field Echo |
FFE Fast Field Echo |
T2-FFE T2-weighted Fast Field Echo |
b-FFE Balanced Fast Field Echo |
Inversion recovery[]
Fluid-attenuated inversion recovery[]
Fluid-attenuated inversion recovery (FLAIR)[46] is an inversion-recovery pulse sequence used to nullify the signal from fluids. For example, it can be used in brain imaging to suppress cerebrospinal fluid so as to bring out periventricular hyperintense lesions, such as multiple sclerosis plaques. By carefully choosing the inversion time TI (the time between the inversion and excitation pulses), the signal from any particular tissue can be suppressed.
Turbo inversion recovery magnitude[]
Turbo inversion recovery magnitude (TIRM) measures only the magnitude of a turbo spin echo after a preceding inversion pulse, thus is phase insensitive.[47]
TIRM is superior in the assessment of osteomyelitis and in suspected head and neck cancer.[48][49] Osteomyelitis appears as high intensity areas.[50] In head and neck cancers, TIRM has been found to both give high signal in tumor mass, as well as low degree of overestimation of tumor size by reactive inflammatory changes in the surrounding tissues.[51]
Diffusion weighted[]
Diffusion MRI measures the diffusion of water molecules in biological tissues.[52] Clinically, diffusion MRI is useful for the diagnoses of conditions (e.g., stroke) or neurological disorders (e.g., multiple sclerosis), and helps better understand the connectivity of white matter axons in the central nervous system.[53] In an isotropic medium (inside a glass of water for example), water molecules naturally move randomly according to turbulence and Brownian motion. In biological tissues however, where the Reynolds number is low enough for laminar flow, the diffusion may be anisotropic. For example, a molecule inside the axon of a neuron has a low probability of crossing the myelin membrane. Therefore, the molecule moves principally along the axis of the neural fiber. If it is known that molecules in a particular voxel diffuse principally in one direction, the assumption can be made that the majority of the fibers in this area are parallel to that direction.
The recent development of diffusion tensor imaging (DTI)[54] enables diffusion to be measured in multiple directions, and the fractional anisotropy in each direction to be calculated for each voxel. This enables researchers to make brain maps of fiber directions to examine the connectivity of different regions in the brain (using tractography) or to examine areas of neural degeneration and demyelination in diseases like multiple sclerosis.
Another application of diffusion MRI is diffusion-weighted imaging (DWI). Following an ischemic stroke, DWI is highly sensitive to the changes occurring in the lesion.[55] It is speculated that increases in restriction (barriers) to water diffusion, as a result of cytotoxic edema (cellular swelling), is responsible for the increase in signal on a DWI scan. The DWI enhancement appears within 5–10 minutes of the onset of stroke symptoms (as compared to computed tomography, which often does not detect changes of acute infarct for up to 4–6 hours) and remains for up to two weeks. Coupled with imaging of cerebral perfusion, researchers can highlight regions of "perfusion/diffusion mismatch" that may indicate regions capable of salvage by reperfusion therapy.
Like many other specialized applications, this technique is usually coupled with a fast image acquisition sequence, such as echo planar imaging sequence.
Perfusion weighted[]

Perfusion-weighted imaging (PWI) is performed by 3 main techniques:
- Dynamic susceptibility contrast (DSC): Gadolinium contrast is injected, and rapid repeated imaging (generally gradient-echo echo-planar T2 weighted) quantifies susceptibility-induced signal loss.[56]
- Dynamic contrast enhanced (DCE): Measuring shortening of the spin–lattice relaxation (T1) induced by a gadolinium contrast bolus.[57]
- Arterial spin labelling (ASL): Magnetic labeling of arterial blood below the imaging slab, without the need of gadolinium contrast.[58]
The acquired data is then postprocessed to obtain perfusion maps with different parameters, such as BV (blood volume), BF (blood flow), MTT (mean transit time) and TTP (time to peak).
In cerebral infarction, the penumbra has decreased perfusion.[24] Another MRI sequence, diffusion-weighted MRI, estimates the amount of tissue that is already necrotic, and the combination of those sequences can therefore be used to estimate the amount of brain tissue that is salvageable by thrombolysis and/or thrombectomy.
Functional MRI[]
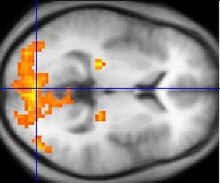
Functional MRI (fMRI) measures signal changes in the brain that are due to changing neural activity. It is used to understand how different parts of the brain respond to external stimuli or passive activity in a resting state, and has applications in behavioral and cognitive research, and in planning neurosurgery of eloquent brain areas.[59][60] Researchers use statistical methods to construct a 3-D parametric map of the brain indicating the regions of the cortex that demonstrate a significant change in activity in response to the task. Compared to anatomical T1W imaging, the brain is scanned at lower spatial resolution but at a higher temporal resolution (typically once every 2–3 seconds). Increases in neural activity cause changes in the MR signal via T*
2 changes;[61] this mechanism is referred to as the BOLD (blood-oxygen-level dependent) effect. Increased neural activity causes an increased demand for oxygen, and the vascular system actually overcompensates for this, increasing the amount of oxygenated hemoglobin relative to deoxygenated hemoglobin. Because deoxygenated hemoglobin attenuates the MR signal, the vascular response leads to a signal increase that is related to the neural activity. The precise nature of the relationship between neural activity and the BOLD signal is a subject of current research. The BOLD effect also allows for the generation of high resolution 3D maps of the venous vasculature within neural tissue.
While BOLD signal analysis is the most common method employed for neuroscience studies in human subjects, the flexible nature of MR imaging provides means to sensitize the signal to other aspects of the blood supply. Alternative techniques employ arterial spin labeling (ASL) or weighting the MRI signal by cerebral blood flow (CBF) and cerebral blood volume (CBV). The CBV method requires injection of a class of MRI contrast agents that are now in human clinical trials. Because this method has been shown to be far more sensitive than the BOLD technique in preclinical studies, it may potentially expand the role of fMRI in clinical applications. The CBF method provides more quantitative information than the BOLD signal, albeit at a significant loss of detection sensitivity.[citation needed]
Magnetic resonance angiography[]
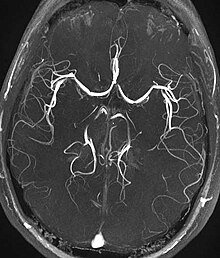
Magnetic resonance angiography (MRA) is a group of techniques based to image blood vessels. Magnetic resonance angiography is used to generate images of arteries (and less commonly veins) in order to evaluate them for stenosis (abnormal narrowing), occlusions, aneurysms (vessel wall dilatations, at risk of rupture) or other abnormalities. MRA is often used to evaluate the arteries of the neck and brain, the thoracic and abdominal aorta, the renal arteries, and the legs (the latter exam is often referred to as a "run-off").
Phase contrast[]
Phase contrast MRI (PC-MRI) is used to measure flow velocities in the body. It is used mainly to measure blood flow in the heart and throughout the body. PC-MRI may be considered a method of magnetic resonance velocimetry. Since modern PC-MRI typically is time-resolved, it also may be referred to as 4-D imaging (three spatial dimensions plus time).[62]
Susceptibility weighted imaging[]
Susceptibility-weighted imaging (SWI) is a new type of contrast in MRI different from spin density, T1, or T2 imaging. This method exploits the susceptibility differences between tissues and uses a fully velocity-compensated, three-dimensional, RF-spoiled, high-resolution, 3D-gradient echo scan. This special data acquisition and image processing produces an enhanced contrast magnitude image very sensitive to venous blood, hemorrhage and iron storage. It is used to enhance the detection and diagnosis of tumors, vascular and neurovascular diseases (stroke and hemorrhage), multiple sclerosis,[63] Alzheimer's, and also detects traumatic brain injuries that may not be diagnosed using other methods.[64]
Magnetization transfer[]
Magnetization transfer (MT) is a technique to enhance image contrast in certain applications of MRI.
Bound protons are associated with proteins and as they have a very short T2 decay they do not normally contribute to image contrast. However, because these protons have a broad resonance peak they can be excited by a radiofrequency pulse that has no effect on free protons. Their excitation increases image contrast by transfer of saturated spins from the bound pool into the free pool, thereby reducing the signal of free water. This homonuclear magnetization transfer provides an indirect measurement of macromolecular content in tissue. Implementation of homonuclear magnetization transfer involves choosing suitable frequency offsets and pulse shapes to saturate the bound spins sufficiently strongly, within the safety limits of specific absorption rate for MRI.[65]
The most common use of this technique is for suppression of background signal in time of flight MR angiography.[66] There are also applications in neuroimaging particularly in the characterization of white matter lesions in multiple sclerosis.[67]
Fast spin echo[]
Fast spin echo (FAISE or FSE, ref 65bis), also called turbo spin echo (TSE) is a sequence that results in fast scan times. In this sequence, several 180 refocusing radio-frequency pulses are delivered during each echo time (TR) interval, and the phase-encoding gradient is briefly switched on between echoes.[68] The FSE/TSE pulse sequence superficially resembles a conventional spin-echo (CSE) sequence in that it uses a series of 180º-refocusing pulses after a single 90º-pulse to generate a train of echoes. The FSE/TSE technique, however, changes the phase-encoding gradient for each of these echoes (a conventional multi-echo sequence collects all echoes in a train with the same phase encoding). As a result of changing the phase-encoding gradient between echoes, multiple lines of k-space (i.e., phase-encoding steps) can be acquired within a given repetition time (TR). Because of multiple phase-encoding lines are acquired during each TR interval, FSE/TSE techniques may significantly reduce imaging time.[69]

X-ray showing a suspected compressive subcapital fracture as a radiodense line

CT scan shows the same, atypical for a fracture since the cortex is coherent

T1-weighted turbo spin echo MRI confirms a fracture, as the surrounding bone marrow has low signal from edema.


65-bis - Ph. MELKI, R.V. MULKERN, L.P. PANYCH, F.A. JOLESZ. Comparing Spin Echo Sequences with the FAISE Method. J. Magn. Reson. Imag. 1991; 1:319-326.
65-Ter Ph. MELKI, F.A. JOLESZ, R.V. MULKERN. Partial RF echo planar with the FAISE method: Experimental and theoritical assessment of image artifacts. Mag. Res. Med. 1992; 26:328-341.
65-Quatro - Ph. MELKI, F.A. JOLESZ, R.V. MULKERN. Partial RF echo planar imaging with the FAISE method: Contrast equivalence with spin echo sequences. Mag. Res. Med. 1992; 26:342-354.
Fat suppression[]
Fat suppression is useful for example to distinguish active inflammation in the intestines from fat deposition such as can be caused by long-standing (but possibly inactive) inflammatory bowel disease, but also obesity, chemotherapy and celiac disease.[70] Techniques to suppress fat on MRI mainly include:[71]
- Identifying fat by the chemical shift of its atoms, causing different time-dependent phase shifts compared to water.
- Frequency-selective saturation of the spectral peak of fat by a "fat sat" pulse before imaging.
- Short tau inversion recovery (STIR), a T1-dependent method
- Spectral presaturation with inversion recovery (SPIR)
Neuromelanin imaging[]
This method exploits the paramagnetic properties of neuromelanin and can be used to visualize the substantia nigra and the locus coeruleus. It is used to detect the atrophy of these nuclei in Parkinson's disease and other parkinsonisms, and also detects signal intensity changes in major depressive disorder and schizophrenia.[72]
Uncommon and experimental sequences[]
The following sequences are not commonly used clinically, and/or are at an experimental stage.
T1 rho (T1ρ)[]
T1 rho (T1ρ) is an experimental MRI sequence that may be used in musculoskeletal imaging. It does not yet have widespread use.[73]
Molecules have a kinetic energy that is a function of the temperature and is expressed as translational and rotational motions, and by collisions between molecules. The moving dipoles disturb the magnetic field but are often extremely rapid so that the average effect over a long time-scale may be zero. However, depending on the time-scale, the interactions between the dipoles do not always average away. At the slowest extreme the interaction time is effectively infinite and occurs where there are large, stationary field disturbances (e.g., a metallic implant). In this case the loss of coherence is described as a "static dephasing". T2* is a measure of the loss of coherence in an ensemble of spins that includes all interactions (including static dephasing). T2 is a measure of the loss of coherence that excludes static dephasing, using an RF pulse to reverse the slowest types of dipolar interaction. There is in fact a continuum of interaction time-scales in a given biological sample, and the properties of the refocusing RF pulse can be tuned to refocus more than just static dephasing. In general, the rate of decay of an ensemble of spins is a function of the interaction times and also the power of the RF pulse. This type of decay, occurring under the influence of RF, is known as T1ρ. It is similar to T2 decay but with some slower dipolar interactions refocused, as well as static interactions, hence T1ρ≥T2.[74]
Others[]
- Saturation recovery sequences are rarely used, but can measure spin-lattice relaxation time (T1) more quickly than an inversion recovery pulse sequence.[75]
- Double-oscillating-diffusion-encoding (DODE) and double diffusion encoding (DDE) imaging are specific forms of MRI diffusion imaging, which can be used to measure diameters and lengths of axon pores.[76]
References[]
- ^ Jones J, Gaillard F. "MRI sequences (overview)". Radiopaedia. Retrieved 2017-10-15.
- ^ Marino MA, Helbich T, Baltzer P, Pinker-Domenig K (February 2018). "Multiparametric MRI of the breast: A review". Journal of Magnetic Resonance Imaging. 47 (2): 301–15. doi:10.1002/jmri.25790. PMID 28639300. S2CID 206108382.
- ^ Tahmassebi, Amirhessam; Wengert, George J; Helbich, Thomas H; Bago-Horvath, Zsuzsanna; Alaei, Sousan; Bartsch, Rupert; Dubsky, Peter; Baltzer, Pascal; Clauser, Paola; Kapetas, Panagiotis; Morris, Elizabeth A.; Meyer-Baese, Anke; Pinker, Katja (2018). "Impact of machine learning with multiparametric magnetic resonance imaging of the breast for early prediction of response to neoadjuvant chemotherapy and survival outcomes in breast cancer patients" (PDF). Investigative Radiology. 00 (20–9996/18/0000–0000): 110–117. doi:10.1097/RLI.0000000000000518. PMC 6310100. PMID 30358693.
- ^ Jump up to: a b c d "Magnetic Resonance Imaging". University of Wisconsin. Archived from the original on 2017-05-10. Retrieved 2016-03-14.
- ^ Jump up to: a b c d Johnson KA. "Basic proton MR imaging. Tissue Signal Characteristics". Harvard Medical School. Archived from the original on 2016-03-05. Retrieved 2016-03-14.
- ^ "MRI Questions, Fast Spin Echo". . Retrieved 2021-05-18.
- ^ Graham D, Cloke P, Vosper M (2011-05-31). Principles and Applications of Radiological Physics E-Book (6 ed.). Elsevier Health Sciences. p. 292. ISBN 978-0-7020-4614-8.}
- ^ du Plessis V, Jones J. "MRI sequences (overview)". Radiopaedia. Retrieved 2017-01-13.
- ^ Lefevre N, Naouri JF, Herman S, Gerometta A, Klouche S, Bohu Y (2016). "A Current Review of the Meniscus Imaging: Proposition of a Useful Tool for Its Radiologic Analysis". Radiology Research and Practice. 2016: 8329296. doi:10.1155/2016/8329296. PMC 4766355. PMID 27057352.
- ^ Jump up to: a b Luijkx T, Weerakkody Y. "Steady-state free precession MRI". Radiopaedia. Retrieved 2017-10-13.
- ^ Jump up to: a b Chavhan GB, Babyn PS, Thomas B, Shroff MM, Haacke EM (2009). "Principles, techniques, and applications of T2*-based MR imaging and its special applications". Radiographics. 29 (5): 1433–49. doi:10.1148/rg.295095034. PMC 2799958. PMID 19755604.
- ^ Jump up to: a b Di Muzio B, Gaillard F. "Susceptibility weighted imaging". Retrieved 2017-10-15.
- ^ Sharma R, Taghi Niknejad M. "Short tau inversion recovery". Radiopaedia. Retrieved 2017-10-13.
- ^ Berger F, de Jonge M, Smithuis R, Maas M. "Stress fractures". Radiology Assistant. Radiology Society of the Netherlands. Retrieved 2017-10-13.
- ^ Hacking C, Taghi Niknejad M, et al. "Fluid attenuation inversion recoveryg". radiopaedia.org. Retrieved 2015-12-03.
- ^ Jump up to: a b Di Muzio B, Abd Rabou A. "Double inversion recovery sequence". Radiopaedia. Retrieved 2017-10-13.
- ^ Lee M, Bashir U. "Diffusion weighted imaging". Radiopaedia. Retrieved 2017-10-13.
- ^ Weerakkody Y, Gaillard F. "Ischaemic stroke". Radiopaedia. Retrieved 2017-10-15.
- ^ Hammer M. "MRI Physics: Diffusion-Weighted Imaging". XRayPhysics. Retrieved 2017-10-15.
- ^ An H, Ford AL, Vo K, Powers WJ, Lee JM, Lin W (May 2011). "Signal evolution and infarction risk for apparent diffusion coefficient lesions in acute ischemic stroke are both time- and perfusion-dependent". Stroke. 42 (5): 1276–81. doi:10.1161/STROKEAHA.110.610501. PMC 3384724. PMID 21454821.
- ^ Jump up to: a b Smith D, Bashir U. "Diffusion tensor imaging". Radiopaedia. Retrieved 2017-10-13.
- ^ Chua TC, Wen W, Slavin MJ, Sachdev PS (February 2008). "Diffusion tensor imaging in mild cognitive impairment and Alzheimer's disease: a review". Current Opinion in Neurology. 21 (1): 83–92. doi:10.1097/WCO.0b013e3282f4594b. PMID 18180656.
- ^ Gaillard F. "Dynamic susceptibility contrast (DSC) MR perfusion". Radiopaedia. Retrieved 2017-10-14.
- ^ Jump up to: a b Chen F, Ni YC (March 2012). "Magnetic resonance diffusion-perfusion mismatch in acute ischemic stroke: An update". World Journal of Radiology. 4 (3): 63–74. doi:10.4329/wjr.v4.i3.63. PMC 3314930. PMID 22468186.
- ^ "Arterial spin labeling". University of Michigan. Retrieved 2017-10-27.
- ^ Gaillard F. "Arterial spin labelling (ASL) MR perfusion". Radiopaedia. Retrieved 2017-10-15.
- ^ Gaillard F. "Dynamic contrast enhanced (DCE) MR perfusion". Radiopaedia. Retrieved 2017-10-15.
- ^ Turnbull LW (January 2009). "Dynamic contrast-enhanced MRI in the diagnosis and management of breast cancer". NMR in Biomedicine. 22 (1): 28–39. doi:10.1002/nbm.1273. PMID 18654999.
- ^ Chou I. "Milestone 19: (1990) Functional MRI". Nature. Retrieved 9 August 2013.
- ^ Luijkx T, Gaillard F. "Functional MRI". Radiopaedia. Retrieved 2017-10-16.
- ^ Jump up to: a b "Magnetic Resonance Angiography (MRA)". Johns Hopkins Hospital. Retrieved 2017-10-15.
- ^ Keshavamurthy J, Ballinger R et al. "Phase contrast imaging". Radiopaedia. Retrieved 2017-10-15.
- ^ Jump up to: a b c d e f g h "Magnetic Resonance Imaging". University of Wisconsin. Archived from the original on 2017-05-10. Retrieved 2016-03-14.
- ^ Jump up to: a b c d e f g h i j k l m n Johnson KA. "Basic proton MR imaging. Tissue Signal Characteristics". Harvard Medical School. Archived from the original on 2016-03-05. Retrieved 2016-03-14.
- ^ Jump up to: a b Patil T (2013-01-18). "MRI sequences". Retrieved 2016-03-14.
- ^ Jump up to: a b "Structural MRI Imaging". UC San Diego School of Medicine. Retrieved 2017-01-01.
- ^ Jones J, Gaillard F. "MRI sequences (overview)". Radiopaedia. Retrieved 2017-01-13.
- ^ Gebker R, Schwitter J, Fleck E, Nagel E (2007). "How we perform myocardial perfusion with cardiovascular magnetic resonance". Journal of Cardiovascular Magnetic Resonance. 9 (3): 539–47. CiteSeerX 10.1.1.655.7675. doi:10.1080/10976640600897286. PMID 17365233.
- ^ Wattjes MP, Lutterbey GG, Gieseke J, Träber F, Klotz L, Schmidt S, Schild HH (January 2007). "Double inversion recovery brain imaging at 3T: diagnostic value in the detection of multiple sclerosis lesions". AJNR. American Journal of Neuroradiology. 28 (1): 54–59. PMID 17213424.
- ^ Nelson F, Poonawalla AH, Hou P, Huang F, Wolinsky JS, Narayana PA (October 2007). "Improved identification of intracortical lesions in multiple sclerosis with phase-sensitive inversion recovery in combination with fast double inversion recovery MR imaging". AJNR. American Journal of Neuroradiology. 28 (9): 1645–49. doi:10.3174/ajnr.A0645. PMID 17885241.
- ^ Nelson F, Poonawalla A, Hou P, Wolinsky JS, Narayana PA (November 2008). "3D MPRAGE improves classification of cortical lesions in multiple sclerosis". Multiple Sclerosis. 14 (9): 1214–19. doi:10.1177/1352458508094644. PMC 2650249. PMID 18952832.
- ^ Brant-Zawadzki M, Gillan GD, Nitz WR (March 1992). "MP RAGE: a three-dimensional, T1-weighted, gradient-echo sequence – initial experience in the brain". Radiology. 182 (3): 769–75. doi:10.1148/radiology.182.3.1535892. PMID 1535892.[permanent dead link]
- ^ Tatco V, Di Muzio B. "In-phase and out-of-phase sequences". Radiopaedia. Retrieved 2017-10-24.
- ^ Reinhard R, van der Zon-Conijn M, Smithuis R. "Kidney - Solid masses". Radiology Assistant. Retrieved 2017-10-27.
- ^ Chavhan GB, Babyn PS, Thomas B, Shroff MM, Haacke EM (2009). "Principles, techniques, and applications of T2*-based MR imaging and its special applications". Radiographics. 29 (5): 1433–49. doi:10.1148/rg.295095034. PMC 2799958. PMID 19755604.
- ^ De Coene B, Hajnal JV, Gatehouse P, Longmore DB, White SJ, Oatridge A, Pennock JM, Young IR, Bydder GM (1992). "MR of the brain using fluid-attenuated inversion recovery (FLAIR) pulse sequences". AJNR. American Journal of Neuroradiology. 13 (6): 1555–64. PMID 1332459.
- ^ Reiser MF, Semmler W, Hricak H (2007). "Chapter 2.4: Image Contrasts and Imaging Sequences". Magnetic Resonance Tomography. Springer Science & Business Media. p. 59. ISBN 978-3-540-29355-2.
- ^ Weerakkody Y. "Turbo inversion recovery magnitude". Radiopaedia. Retrieved 2017-10-21.
- ^ Hauer MP, Uhl M, Allmann KH, Laubenberger J, Zimmerhackl LB, Langer M (November 1998). "Comparison of turbo inversion recovery magnitude (TIRM) with T2-weighted turbo spin-echo and T1-weighted spin-echo MR imaging in the early diagnosis of acute osteomyelitis in children". Pediatric Radiology. 28 (11): 846–50. doi:10.1007/s002470050479. PMID 9799315. S2CID 29075661.
- ^ Ai T. "Chronic osteomyelitis of the left femur". Clinical-MRI. Retrieved 2017-10-21.
- ^ Sadick M, Sadick H, Hörmann K, Düber C, Diehl SJ (August 2005). "Diagnostic evaluation of magnetic resonance imaging with turbo inversion recovery sequence in head and neck tumors". European Archives of Oto-Rhino-Laryngology. 262 (8): 634–39. doi:10.1007/s00405-004-0878-x. PMID 15668813. S2CID 24575696.
- ^ Le Bihan D, Breton E, Lallemand D, Grenier P, Cabanis E, Laval-Jeantet M (November 1986). "MR imaging of intravoxel incoherent motions: application to diffusion and perfusion in neurologic disorders". Radiology. 161 (2): 401–07. doi:10.1148/radiology.161.2.3763909. PMID 3763909. S2CID 14420005.
- ^ "Diffusion Inaging". Stanford University. Archived from the original on 24 December 2011. Retrieved 28 April 2012.
- ^ Filler A (2009). "The History, Development and Impact of Computed Imaging in Neurological Diagnosis and Neurosurgery: CT, MRI, and DTI". Nature Precedings. doi:10.1038/npre.2009.3267.5.
- ^ Moseley ME, Cohen Y, Mintorovitch J, Chileuitt L, Shimizu H, Kucharczyk J, Wendland MF, Weinstein PR (May 1990). "Early detection of regional cerebral ischemia in cats: comparison of diffusion- and T2-weighted MRI and spectroscopy". Magnetic Resonance in Medicine. 14 (2): 330–46. doi:10.1002/mrm.1910140218. PMID 2345513. S2CID 23754356.
- ^ Gaillard F. "Dynamic susceptibility contrast (DSC) MR perfusion". Radiopaedia. Retrieved 2017-10-14.
- ^ Frank Gaillard; et al. "Dynamic contrast enhanced (DCE) MR perfusion". Radiopaedia. Retrieved 2017-10-15.
- ^ Gaillard F. "Arterial spin labelling (ASL) MR perfusion". Radiopaedia. Retrieved 2017-10-15.
- ^ Heeger DJ, Ress D (February 2002). "What does fMRI tell us about neuronal activity?". Nature Reviews. Neuroscience. 3 (2): 142–51. doi:10.1038/nrn730. PMID 11836522. S2CID 7132655.
- ^ Giussani C, Roux FE, Ojemann J, Sganzerla EP, Pirillo D, Papagno C (January 2010). "Is preoperative functional magnetic resonance imaging reliable for language areas mapping in brain tumor surgery? Review of language functional magnetic resonance imaging and direct cortical stimulation correlation studies". Neurosurgery. 66 (1): 113–20. doi:10.1227/01.NEU.0000360392.15450.C9. PMID 19935438. S2CID 207142804.
- ^ Thulborn KR, Waterton JC, Matthews PM, Radda GK (February 1982). "Oxygenation dependence of the transverse relaxation time of water protons in whole blood at high field". Biochimica et Biophysica Acta (BBA) - General Subjects. 714 (2): 265–70. doi:10.1016/0304-4165(82)90333-6. PMID 6275909.
- ^ Stankovic Z, Allen BD, Garcia J, Jarvis KB, Markl M (April 2014). "4D flow imaging with MRI". Cardiovascular Diagnosis and Therapy. 4 (2): 173–92. doi:10.3978/j.issn.2223-3652.2014.01.02. PMC 3996243. PMID 24834414.
- ^ Wiggermann V, Hernández Torres E, Vavasour IM, Moore GR, Laule C, MacKay AL, Li DK, Traboulsee A, Rauscher A (July 2013). "Magnetic resonance frequency shifts during acute MS lesion formation". Neurology. 81 (3): 211–118. doi:10.1212/WNL.0b013e31829bfd63. PMC 3770162. PMID 23761621.
- ^ Reichenbach JR, Venkatesan R, Schillinger DJ, Kido DK, Haacke EM (July 1997). "Small vessels in the human brain: MR venography with deoxyhemoglobin as an intrinsic contrast agent". Radiology. 204 (1): 272–77. doi:10.1148/radiology.204.1.9205259. PMID 9205259.[permanent dead link]
- ^ McRobbie DW (2007). MRI from picture to proton. Cambridge, UK ; New York: Cambridge University Press. ISBN 978-0-521-68384-5.
- ^ Wheaton AJ, Miyazaki M (August 2012). "Non-contrast enhanced MR angiography: physical principles". Journal of Magnetic Resonance Imaging. 36 (2): 286–304. doi:10.1002/jmri.23641. PMID 22807222. S2CID 24048799.
- ^ Filippi M, Rocca MA, De Stefano N, Enzinger C, Fisher E, Horsfield MA, Inglese M, Pelletier D, Comi G (December 2011). "Magnetic resonance techniques in multiple sclerosis: the present and the future". Archives of Neurology. 68 (12): 1514–20. doi:10.1001/archneurol.2011.914. PMID 22159052.
- ^ Weishaupt D, Köchli VD, Marincek B (2008). "Chapter 8: Fast Pulse sequences". How does MRI work?: An Introduction to the Physics and Function of Magnetic Resonance Imaging (2nd ed.). Springer Science & Business Media. p. 64. ISBN 978-3-540-37845-7.
- ^ "What is Fast (Turbo) Spin Echo imaging?".
- ^ Gore R, Smithuis R (2014-05-21). "Bowel wall thickening – CT-pattern – Type 4 – Fat target sign". Radiology Assistant. Retrieved 2017-09-27.
- ^ Weishaupt D, Koechli VD, Marincek B (2008). "Chapter 9: Fast Suppression Techniques". How does MRI work?: An Introduction to the Physics and Function of Magnetic Resonance Imaging (2 ed.). Springer Science & Business Media. p. 70. ISBN 978-3-540-37845-7.
- ^ Sasaki M, Shibata E, Tohyama K, Takahashi J, Otsuka K, Tsuchiya K, Takahashi S, Ehara S, Terayama Y, Sakai A (July 2006). "Neuromelanin magnetic resonance imaging of locus ceruleus and substantia nigra in Parkinson's disease". NeuroReport. 17 (11): 1215–18. doi:10.1097/01.wnr.0000227984.84927.a7. PMID 16837857. S2CID 24597825.
- ^ Luijkx T, Morgan MA. "T1 rho". Radiopaedia. Retrieved 2017-10-15.
- ^ Borthakur A, Mellon E, Niyogi S, Witschey W, Kneeland JB, Reddy R (November 2006). "Sodium and T1rho MRI for molecular and diagnostic imaging of articular cartilage". NMR in Biomedicine. 19 (7): 781–821. doi:10.1002/nbm.1102. PMC 2896046. PMID 17075961.
- ^ Jones J, Ballinger JR. "Saturation recovery sequences". Radiopaedia. Retrieved 2017-10-15.
- ^ Andrada I, Ivana D, Noam S, Daniel A (2016). "Advanced diffusion MRI for microstructure imaging". Frontiers in Physics. 4. doi:10.3389/conf.FPHY.2016.01.00001.
- Magnetic resonance imaging
- Nuclear magnetic resonance