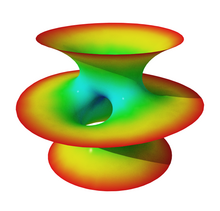
Mathematical visualization
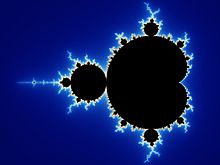
Mathematical phenomena can be understood and explored via visualization. Classically this consisted of two-dimensional drawings or building three-dimensional models (particularly plaster models in the 19th and early 20th century), while today it most frequently consists of using computers to make static two or three dimensional drawings, animations, or interactive programs. Writing programs to visualize mathematics is an aspect of computational geometry.
Applications[]
Mathematical visualization is used throughout mathematics, particularly in the fields of geometry and analysis. Notable examples include plane curves, space curves, polyhedra, ordinary differential equations, partial differential equations (particularly numerical solutions, as in fluid dynamics or minimal surfaces such as soap films), conformal maps, fractals, and chaos.
Geometry[]
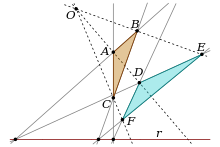
Geometry can be defined as the study of shapes their size, angles, dimensions and proportions[1]
This section needs expansion. You can help by . (August 2020) |
Linear algebra[]
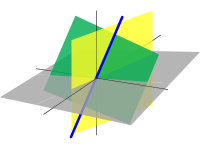
This section needs expansion. You can help by . (August 2020) |
Complex analysis[]

This section needs expansion. You can help by . (August 2020) |
In complex analysis, functions of the complex plane are inherently 4-dimensional, but there is no natural geometric projection into lower dimensional visual representations. Instead, colour vision is exploited to capture dimensional information using techniques such as domain coloring.
Chaos theory[]
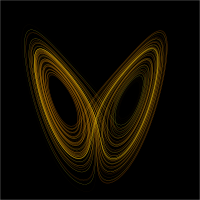
This section needs expansion. You can help by . (August 2020) |
Differential geometry[]
This section needs expansion. You can help by . (August 2020) |
Topology[]

This section needs expansion. You can help by . (August 2020) |
Many people have a vivid “mind’s eye,” but a team of British scientists has found that tens of millions of people cannot conjure images. The lack of a mental camera is known as aphantasia, and millions more experience extraordinarily strong mental imagery, called hyperphantasia. Researchers are studying how these two conditions arise through changes in the wiring of the brain.
Visualization played an important role at the beginning of topological knot theory, when polyhedral decompositions were used to compute the homology of covering spaces of knots. Extending to 3 dimensions the physically impossible Riemann surfaces used to classify all closed orientable 2-manifolds, Heegaard's 1898 thesis "looked at" similar structures for functions of two complex variables, taking an imaginary 4-dimensional surface in Euclidian 6-space (corresponding to the function f=x^2-y^3) and projecting it stereographically (with multiplicities) onto the 3-sphere. In the 1920s Alexander and Briggs used this technique to compute the homology of cyclic branched covers of knots with 8 or fewer crossings, successfully distinguishing them all from each other (and the unknot). By 1932 Reidemeister extended this to 9 crossings, relying on linking numbers between branch curves of non-cyclic knot covers. The fact that these imaginary objects have no "real" existence does not stand in the way of their usefulness for proving knots distinct. It was the key to Perko's 1973 discovery of the duplicate knot type in Little's 1899 table of 10-crossing knots.
Graph theory[]
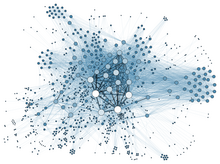
This section needs expansion. You can help by . (August 2020) |
Permutation groups have nice visualizations of their elements that assist in explaining their structure -- e.g., the rotated and flipped regular p-gons that comprise the dihedral group of order 2p. They may be used to "see" the relationships among linking numbers between branch curves of dihedral covering spaces of knots and links. Reference: Perko, On dihedral covering spaces of knots, Inventiones Math. 34 (1976), 77-82.
Combinatorics[]
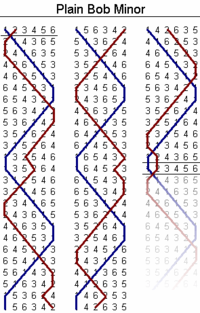
This section needs expansion. You can help by . (August 2020) |
Cellular automata[]
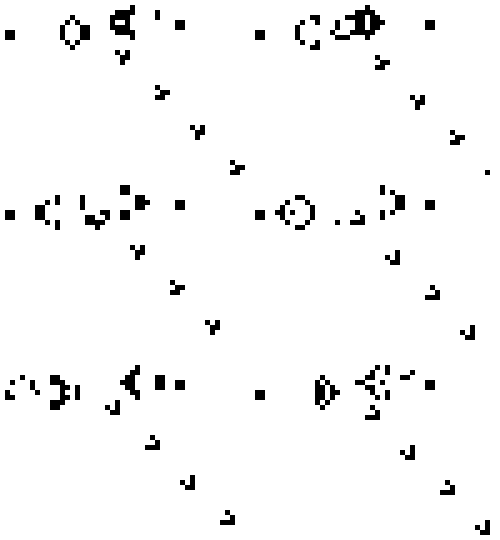
This section needs expansion. You can help by . (August 2020) |
Stephen Wolfram's book on cellular automata, A New Kind of Science (2002), is one of the most intensely visual books published in the field of mathematics. It has been criticized for being too heavily visual, with much information conveyed by pictures that do not have formal meaning.[4]
Computation[]

This section needs expansion. You can help by . (August 2020) |
Other examples[]
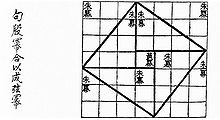
- Proofs without words have existed since antiquity, as in the Pythagorean theorem proof found in the Zhoubi Suanjing Chinese text which dates from 1046 BC to 256 BC.
- The Clebsch diagonal surface demonstrates the 27 lines on a cubic surface.
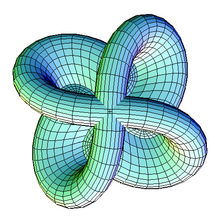
- Sphere eversion – that a sphere can be turned inside out in 3 dimension if allowed to pass through itself, but without kinks – was a startling and counter-intuitive result, originally proven via abstract means, later demonstrated graphically, first in drawings, later in computer animation.
The cover of the journal The Notices of the American Mathematical Society regularly features a mathematical visualization.

See also[]
References[]
- ^ "What is Geometry? - Definition, Facts and Examples". www.splashlearn.com. Retrieved 2021-09-07.
- ^ Published in Grandjean, Martin (2014). "La connaissance est un réseau". Les Cahiers du Numérique. 10 (3): 37–54. doi:10.3166/lcn.10.3.37-54. Retrieved 2014-10-15.
- ^ Daniel Dennett (1995), Darwin's Dangerous Idea, Penguin Books, London, ISBN 978-0-14-016734-4, ISBN 0-14-016734-X
- ^ Berry, Michael; Ellis, John; Deutch, David (15 May 2002). "A Revolution or self indulgent hype? How top scientists view Wolfram" (PDF). The Daily Telegraph. Retrieved 14 August 2012.
- Palais, Richard S. (June–July 1999), "The Visualization of Mathematics: Towards a Mathematical Exploratorium" (PDF), Notices of the American Mathematical Society, 46 (6): 647–658
External links[]
- Geometry
- Visualization (graphic)
