Namakwa District Municipality
Namakwa | |
|---|---|
District municipality | |
 Seal | |
 Location in South Africa | |
| Coordinates: 30°30′S 19°30′E / 30.500°S 19.500°ECoordinates: 30°30′S 19°30′E / 30.500°S 19.500°E | |
| Country | South Africa |
| Province | Northern Cape |
| Seat | Springbok |
| Local municipalities | List
|
| Government | |
| • Type | Municipal council |
| • Mayor | Mervin Cloete |
| Area | |
| • Total | 126,836 km2 (48,972 sq mi) |
| Population (2011)[2] | |
| • Total | 115,842 |
| • Density | 0.91/km2 (2.4/sq mi) |
| Racial makeup (2011) | |
| • Black African | 6.8% |
| • Coloured | 83.2% |
| • Indian/Asian | 0.5% |
| • White | 8.7% |
| First languages (2011) | |
| • Afrikaans | 93.9% |
| • Tswana | 1.7% |
| • Xhosa | 1.5% |
| • English | 1.2% |
| • Other | 1.7% |
| Time zone | UTC+2 (SAST) |
| Municipal code | DC6 |

Namakwa is one of the 5 districts of the Northern Cape province of South Africa. The seat of Namakwa is Springbok and the region is also known as Little Namaqualand. The majority of its 108,118 people speak Afrikaans (2001 Census). The district code is DC6.
Geography[]
Neighbours[]
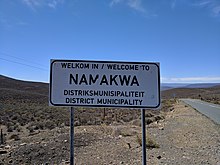
A sign along the border of Namakwa with the Western Cape, welcoming drivers coming up
Namakwa is surrounded by:
- the republic of Namibia in the north
- ZF Mgcawu (DC8) in the north-east
- Pixley ka Seme (DC7) in the east
- Central Karoo (DC5) in the south-east
- Cape Winelands (DC2) – in the south (formerly the Boland District Municipality)
- West Coast (DC1) in the south-west
- the Atlantic Ocean in the west
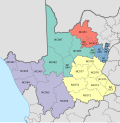
Local municipalities[]
The district contains the following local municipalities:
| Local municipality | Population | % |
|---|---|---|
| Nama Khoi | 44 752 | 41.39% |
| Hantam | 19 804 | 18.32% |
| Khâi-Ma | 11 348 | 10.50% |
| Kamiesberg | 10 743 | 9.94% |
| Karoo Hoogland | 10 508 | 9.72% |
| Richtersveld | 10 119 | 9.36% |
| 813 | 0.75% |
Demographics[]
The following statistics are from the 2001 census.
| Language | Population | % |
|---|---|---|
| Afrikaans | 103,304 | 95.55% |
| Xhosa | 1 595 | 1.48% |
| Tswana | 1 211 | 1.12% |
| English | 1 143 | 1.06% |
| Other | 415 | 0.38% |
| Sotho | 219 | 0.20% |
| Zulu | 116 | 0.11% |
| Tsonga | 26 | 0.02% |
| Northern Sotho | 18 | 0.02% |
| Venda | 16 | 0.01% |
| Swati | 15 | 0.01% |
| Ndebele | 9 | 0.01% |
Gender[]
| Gender | Population | % |
|---|---|---|
| Female | 54 651 | 50.55% |
| Male | 53 467 | 49.45% |
Ethnic group[]
| Ethnic group | Population | % |
|---|---|---|
| Coloured | 90 713 | 83.90% |
| White | 12 757 | 11.80% |
| Black African | 4 523 | 4.18% |
| Indian/Asian | 125 | 0.12% |
Age[]
| Age | Population | % |
|---|---|---|
| 000–004 | 9 990 | 9.24% |
| 005–009 | 10 690 | 9.89% |
| 010–014 | 11 028 | 10.20% |
| 015–019 | 9 809 | 9.07% |
| 020–024 | 8 212 | 7.60% |
| 025–029 | 8 367 | 7.74% |
| 030–034 | 8 647 | 8.00% |
| 035–039 | 8 086 | 7.48% |
| 040–044 | 6 996 | 6.47% |
| 045–049 | 6 387 | 5.91% |
| 050–054 | 4 971 | 4.60% |
| 055–059 | 4 232 | 3.91% |
| 060–064 | 3 437 | 3.18% |
| 065–069 | 2 671 | 2.47% |
| 070–074 | 1 929 | 1.78% |
| 075–079 | 1 216 | 1.12% |
| 080–084 | 786 | 0.73% |
| 085–089 | 453 | 0.42% |
| 090–094 | 165 | 0.15% |
| 095–099 | 43 | 0.04% |
| 100 plus | 3 | 0.00% |
Politics[]
Election results[]
Election results for Namakwa in the South African general election, 2004.
- Population 18 and over: 70 397 [65.11% of total population]
- Total votes: 44 220 [40.90% of total population]
- Voting % estimate: 62.82% votes as a % of population 18 and over
| Party | Votes | % |
|---|---|---|
| African National Congress | 26 557 | 60.06% |
| Democratic Alliance | 7 104 | 16.07% |
| New National Party | 4 379 | 9.90% |
| Independent Democrats | 4 216 | 9.53% |
| African Christian Democratic Party | 867 | 1.96% |
| Freedom Front Plus | 536 | 1.21% |
| Pan Africanist Congress | 75 | 0.17% |
| United Democratic Movement | 63 | 0.14% |
| United Christian Democratic Party | 54 | 0.12% |
| Inkhata Freedom Party | 49 | 0.11% |
| NA | 42 | 0.09% |
| EMSA | 39 | 0.09% |
| PJC | 38 | 0.09% |
| KISS | 37 | 0.08% |
| Azanian People's Organisation | 34 | 0.08% |
| CDP | 28 | 0.06% |
| SOPA | 27 | 0.06% |
| TOP | 23 | 0.05% |
| NLP | 20 | 0.05% |
| UF | 18 | 0.04% |
| Minority Front | 14 | 0.03% |
| Total | 44 220 | 100.00% |
References[]
- ^ "Contact list: Executive Mayors". Government Communication & Information System. Archived from the original on 14 July 2010. Retrieved 22 February 2012.
- ^ a b "Statistics by place". Statistics South Africa. Retrieved 27 September 2015.
- ^ "Statistics by place". Statistics South Africa. Retrieved 27 September 2015.
External links[]
Municipalities and communities of Namakwa District Municipality, Northern Cape | ||
|---|---|---|
District seat: Springbok | ||
| Hantam | 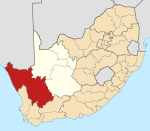 | |
| Kamiesberg |
| |
| Karoo Hoogland | ||
| Khâi-Ma | ||
| Nama Khoi | ||
| Richtersveld |
| |
Municipalities of the Northern Cape | ||
|---|---|---|
| Namakwa District |
|  |
| Pixley ka Seme District |
| |
| ZF Mgcawu District |
| |
| Frances Baard District |
| |
| John Taolo Gaetsewe District | ||
List of municipalities in the Northern Cape | ||
Categories:
- District municipalities of the Northern Cape
- Namakwa District Municipality
- Namaqualand