Ramgarh, Kaimur
Ramgarh | |
|---|---|
Census town | |
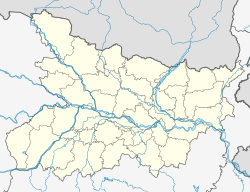 Ramgarh Location in Bihar, India | |
| Coordinates: 25°17′20″N 83°39′13″E / 25.28893°N 83.65355°ECoordinates: 25°17′20″N 83°39′13″E / 25.28893°N 83.65355°E[1] | |
| Country | India |
| State | Bihar |
| District | Kaimur |
| Area | |
| • Total | 4.06 km2 (1.57 sq mi) |
| Elevation | 75 m (246 ft) |
| Population (2011) | |
| • Total | 8,960[2] |
| Languages | |
| • Official | Bhojpuri, Hindi |
| Time zone | UTC+5:30 (IST) |


Ramgarh is a census town and corresponding community development block in Kaimur district of Bihar, India.[2] As of 2011, its population was 8,690, in 1,345 households.[2] It was first upgraded to census town status for the 2011 census.[2] The total population of the rural areas of Ramgarh block was 123,973, in 18,375 households.[2] The overall population of the subdistrict was 132,663.[2]
Geography[]
Ramgarh block covers an area of 16,448 hectares, of which forests covered 3.2 in 2011.[2] The area currently under cultivation that year was 13,249.7 hectares, while orchards covered another 284.8 hectares and pastures covered an additional 96.4.[2] Another 1,726.1 hectares were under non-agricultural use.[2]
Climate[]
Ramgarh town gets about 1600 mm of rainfall per year on average.[2] Temperatures typically vary from 6 to 45 degrees.[2]
Demographics[]
According to the 2011 census, the sex ratio of Ramgarh town was 927 females for every 1000 males, which was the highest among Kaimur district's three urban areas.[2] Of the town's 8,690 people, 1,415 were between the ages of 0 and 6, and the sex ratio of this group was 1007 (i.e. there were more slightly girls than boys: 710 and 705, respectively).[2] Members of scheduled castes made up 23.77% of Ramgarh residents, and there were no members of scheduled tribes living in the town.[2] The literacy rate of Ramgarh town was 79.74%, which was lowest among urban areas in Kaimur district.[2] Literacy was higher in men than in women: 87.96% of men and 70.73% of women in Kaimur town could read and write in 2011, with the corresponding 17.23% literacy gender gap being the highest in Kaimur.[2]
Most of Ramgarh town's workforce was not employed in agriculture in 2011, with only 12.35% of workers being cultivators who owned or leased their own land, and 16.05% being agricultural labourers who worked someone else's land for money.[2] Additionally, 8.51% were classified as household industry workers.[2] Most workers (63.09%) were classified as other workers.[2] The workforce was mostly male, with 1,827 male and 148 female workers in Ramgarh.[2]
For rural areas of Ramgarh block, the sex ratio was 929; among 0-6 year olds, it was 926.[2] Members of scheduled castes made up 22.62% of rural residents, and members of scheduled tribes made up 0.62%.[2] The rural literacy rate was 72.29% (82.24% among men and 61.58% among women).[2]
Most of Ramgarh block's rural workforce was employed in agriculture in 2011, with 30.26% being cultivators and another 49.75% being agricultural labourers.[2] 5.52% were household industry workers, and the remaining 14.48% were other workers.[2] The rural workforce was mostly male, consisting of 28,978 men and 11,926 women.[2]
Amenities[]
As of 2011, firefighting services in Ramgarh was covered by the Bhabua fire department.[2] For electricity, Ramgarh had 495 households connected to the power grid that year, 0 commercial or industrial connections, and no electric street lights.[2] Both open and closed were used Ramgarh, and there were 0 latrines.[2]
Villages[]
Besides the town of Ramgarh, there are 125 rural villages in Ramgarh block, as listed below:[2]
| Village name | Total land area (hectares) | Population (in 2011) |
|---|---|---|
| 149 | 2,172 | |
| 128 | 964 | |
| Baijnath | 231 | 2,482 |
| 108 | 918 | |
| 62 | 386 | |
| 36 | 1,423 | |
| 191 | 3,967 | |
| 24 | 0 | |
| 38 | 0 | |
| 52 | 0 | |
| 100 | 1,464 | |
| 236 | 1,770 | |
| 143 | 956 | |
| 118 | 942 | |
| 26 | 6 | |
| 149 | 3,207 | |
| 100 | 0 | |
| 100 | 612 | |
| 74 | 380 | |
| 247 | 2,849 | |
| 41 | 0 | |
| 34 | 0 | |
| 357 | 4,716 | |
| 44 | 0 | |
| 127 | 2,108 | |
| 299 | 3,805 | |
| 107 | 171 | |
| 424 | 3,701 | |
| 342 | 0 | |
| 74 | 962 | |
| 86 | 274 | |
| 53 | 365 | |
| 170 | 0 | |
| 91 | 41 | |
| 88 | 0 | |
| 248 | 1,783 | |
| 99 | 1,095 | |
| 80 | 0 | |
| 134 | 0 | |
| 176 | 1,366 | |
| 65 | 491 | |
| 55 | 0 | |
| 59 | 0 | |
| 98 | 758 | |
| 67 | 0 | |
| 44 | 0 | |
| 301 | 4,039 | |
| 76 | 0 | |
| 113 | 486 | |
| 62 | 0 | |
| 87 | 720 | |
| 58 | 68 | |
| 108 | 530 | |
| 35 | 155 | |
| 161 | 2,041 | |
| 55 | 787 | |
| 168 | 974 | |
| 111 | 930 | |
| 111 | 474 | |
| 201 | 5,014 | |
| 187 | 4,448 | |
| 299 | 2,632 | |
| 207 | 1,859 | |
| 227 | 1,665 | |
| 104 | 560 | |
| 21 | 0 | |
| 59 | 30 | |
| 78 | 130 | |
| 37 | 179 | |
| 16 | 303 | |
| 81 | 200 | |
| 276 | 4,571 | |
| 88 | 0 | |
| 93 | 0 | |
| 206 | 435 | |
| 66 | 0 | |
| 66 | 1,630 | |
| 76 | 0 | |
| 323 | 3,587 | |
| 110 | 621 | |
| 140 | 943 | |
| 309 | 2,094 | |
| 354 | 2,117 | |
| 164 | 1,313 | |
| 57 | 0 | |
| 123 | 408 | |
| 552 | 2,739 | |
| 197 | 3,172 | |
| 71 | 286 | |
| 431 | 3,093 | |
| 60 | 0 | |
| 89 | 437 | |
| 69 | 18 | |
| 86 | 0 | |
| 19 | 0 | |
| 114 | 700 | |
| 148 | 881 | |
| 92 | 688 | |
| 110 | 528 | |
| 84 | 930 | |
| 49 | 2,646 | |
| 476 | 210 | |
| 40 | 43 | |
| 86 | 1,218 | |
| 125 | 539 | |
| 324 | 1,514 | |
| 75 | 391 | |
| 34 | 259 | |
| 81 | 33 | |
| 36 | 0 | |
| 100 | 839 | |
| 35 | 0 | |
| 164 | 957 | |
| 150 | 0 | |
| 135 | 0 | |
| 27 | 164 | |
| 156 | 1,902 | |
| 45 | 0 | |
| 206 | 2,152 | |
| 97 | 291 | |
| 42 | 40 | |
| 121 | 771 | |
| 135 | 0 | |
| 305 | 4,455 | |
| 24 | 0 |
See also[]
References[]
- ^ a b "Geonames.org. Rāmgarh". Retrieved 6 March 2021.
- ^ a b c d e f g h i j k l m n o p q r s t u v w x y z aa ab ac ad ae "Census of India 2011: Bihar District Census Handbook - Kaimur, Part A (Village and Town Directory)". Census 2011 India. pp. 22–85, 184–239, 898–99, 972–88. Retrieved 6 March 2021.
- Cities and towns in Kaimur district