Ribble Valley Borough Council elections
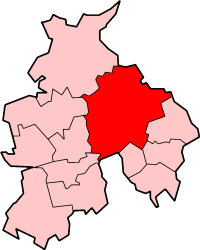
Ribble Valley shown within the non-metropolitan county of Lancashire (Unitary authorities excluded)
Ribble Valley Borough Council in Lancashire, England is elected every four years. The authority is currently controlled by the Conservative Party, with 28 councillors to 10 Liberal Democrats and two independents.[1] Ribble Valley is a non-metropolitan district forming a lower-tier of local government under Lancashire County Council.
Political control[]

Ribble Valley Council 2019
Conservative Party (UK): 28 seats
Liberal Democrats (UK): 10 seats
Independent (politician): 2 seats
Since the first election to the council in 1973 political control of the council has been held by the following parties:[2]
| Party in control | Period | |
|---|---|---|
| Conservative | 1973 – 1995 | |
| No overall control | 1995 – 2003 | |
| Conservative | 2003 – present | |
Council elections[]
- (New ward boundaries)[3]
- (Borough boundary changes took place but the number of seats remained the same)[4]
- (New ward boundaries increased the number of seats by 1)[5][6]
- 2015 Ribble Valley Borough Council election
- 2019 Ribble Valley Borough Council election
By-election results[]
1995-1999[]
| Party | Candidate | Votes | % | ±% | |
|---|---|---|---|---|---|
| Conservative | 242 | 38.6 | |||
| Liberal Democrats | 175 | 27.9 | |||
| Independent | 137 | 21.9 | |||
| Independent | 73 | 11.6 | |||
| Majority | 67 | 10.7 | |||
| Turnout | 627 | 55.5 | |||
| Conservative hold | Swing | ||||
| Party | Candidate | Votes | % | ±% | |
|---|---|---|---|---|---|
| Conservative | 479 | 60.0 | |||
| Liberal Democrats | 319 | 40.0 | |||
| Majority | 160 | 20.0 | |||
| Turnout | 798 | 39.3 | |||
| Conservative hold | Swing | ||||
| Party | Candidate | Votes | % | ±% | |
|---|---|---|---|---|---|
| Liberal Democrats | 403 | 64.3 | +2.6 | ||
| Conservative | 131 | 20.9 | +6.2 | ||
| Labour | 92 | 14.7 | -8.9 | ||
| Majority | 272 | 43.4 | |||
| Turnout | 626 | 35.3 | |||
| Liberal Democrats hold | Swing | ||||
| Party | Candidate | Votes | % | ±% | |
|---|---|---|---|---|---|
| Independent | 303 | 56.1 | +56.1 | ||
| Conservative | 237 | 43.9 | -17.9 | ||
| Majority | 66 | 12.2 | |||
| Turnout | 540 | 47.0 | |||
| Independent gain from Conservative | Swing | ||||
| Party | Candidate | Votes | % | ±% | |
|---|---|---|---|---|---|
| Conservative | 224 | 75.2 | +31.6 | ||
| Liberal Democrats | 74 | 24.8 | -3.5 | ||
| Majority | 150 | 50.4 | |||
| Turnout | 298 | 33.6 | |||
| Conservative hold | Swing | ||||
1999-2003[]
| Party | Candidate | Votes | % | ±% | |
|---|---|---|---|---|---|
| Conservative | 220 | 53.1 | -26.6 | ||
| Liberal Democrats | 194 | 46.9 | +26.6 | ||
| Majority | 26 | 6.2 | |||
| Turnout | 414 | 39.7 | |||
| Conservative hold | Swing | ||||
2007-2011[]
| Party | Candidate | Votes | % | ±% | |
|---|---|---|---|---|---|
| Conservative | Carl Ross | 350 | 61.1 | +10.3 | |
| Liberal Democrats | 181 | 31.6 | -17.6 | ||
| Labour | 42 | 7.3 | +7.3 | ||
| Majority | 169 | 29.5 | |||
| Turnout | 573 | 24.6 | |||
| Conservative gain from Liberal Democrats | Swing | ||||
| Party | Candidate | Votes | % | ±% | |
|---|---|---|---|---|---|
| Conservative | Gary Scott | 439 | 75.3 | -0.4 | |
| Liberal Democrats | Howard Douglas | 144 | 24.7 | +0.4 | |
| Majority | 295 | 50.6 | |||
| Turnout | 583 | ||||
| Conservative hold | Swing | ||||
| Party | Candidate | Votes | % | ±% | |
|---|---|---|---|---|---|
| Conservative | Mike Thomas | 530 | 66.8 | +1.4 | |
| Liberal Democrats | Susan Knox | 263 | 33.2 | -1.4 | |
| Majority | 267 | 33.6 | |||
| Turnout | 793 | ||||
| Conservative hold | Swing | ||||
References[]
- ^ "Councillors by Party". Ribble Valley Borough Council. Retrieved 17 January 2015.
- ^ "Ribble Valley". BBC News Online. Retrieved 8 November 2009.
- ^ legislation.gov.uk - The Borough of Ribble Valley (Electoral Arrangements) Order 1976. Retrieved on 19 November 2015.
- ^ The Lancashire (District Boundaries) Order 1986
- ^ "Local elections". BBC News Online. Retrieved 6 November 2009.
- ^ legislation.gov.uk - The Borough of Ribble Valley (Electoral Changes) Order 2001. Retrieved on 4 October 2015.
- ^ "Main parties fend off byelection challengers". guardian.co.uk. 18 October 2002. Retrieved 8 November 2009.
- ^ "Tories and Labour the winners in latest council by-elections". 24dash.com. 24 October 2008. Retrieved 8 November 2009.
External links[]
| County Council | |
|---|---|
| Blackburn with Darwen | |
| Blackpool | |
| Burnley | |
| Chorley | |
| Fylde | |
| Hyndburn | |
| Lancaster | |
| Pendle | |
| Preston | |
| Ribble Valley | |
| Rossendale | |
| South Ribble | |
| West Lancashire | |
| Wyre | |
| |
Categories:
- Politics of Ribble Valley
- Ribble Valley District Council elections
- Council elections in Lancashire
- District council elections in England