Wyre Borough Council elections
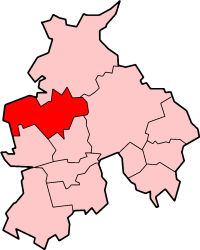
Wyre shown within the non-metropolitan county of Lancashire (Unitary authorities excluded)
Elections to Wyre Borough Council in Lancashire, England are held every four years. Since the last boundary changes in 2003, 55 councillors have been elected from 26 wards.[1][2] Wyre is a non-metropolitan district forming a lower-tier of local government under Lancashire County Council.
Political control[]
Since the foundation of the council in 1973 political control of the council has been held by the following parties:[3]
| Party | Period | |
|---|---|---|
| Conservative | 1973 – 1995 | |
| Labour | 1995 – 1999 | |
| Conservative | 1999 – present | |
Council elections[]
- (New ward boundaries)[4]
- 2003 Wyre Borough Council election (New ward boundaries reduced the number of seats by 1)[5][6]
- 2007 Wyre Borough Council election
- 2011 Wyre Borough Council election
- 2015 Wyre Borough Council election (New ward boundaries)[7]
- 2019 Wyre Borough Council election
Borough result maps[]

2007 results map

2011 results map


By-election results[]
1995-1999[]
| Party | Candidate | Votes | % | ±% | |
|---|---|---|---|---|---|
| Labour | 771 | 52.7 | |||
| Conservative | 605 | 41.3 | |||
| Liberal Democrats | 88 | 6.0 | |||
| Majority | 166 | 11.4 | |||
| Turnout | 1,464 | 40.4 | |||
| Labour hold | Swing | ||||
| Party | Candidate | Votes | % | ±% | |
|---|---|---|---|---|---|
| Labour | 525 | 59.7 | +5.1 | ||
| Conservative | 354 | 40.3 | +19.2 | ||
| Majority | 171 | 19.4 | |||
| Turnout | 879 | 34.5 | |||
| Labour hold | Swing | ||||
1999-2003[]
| Party | Candidate | Votes | % | ±% | |
|---|---|---|---|---|---|
| Labour | 838 | 20.25 | |||
| Labour | 821 | 19.84 | |||
| Labour | 726 | 17.54 | |||
| Conservative | 602 | 14.54 | |||
| Conservative | 596 | 14.40 | |||
| Conservative | 556 | 13.43 | |||
| Turnout | 42.2 | ||||
| Labour hold | Swing | ||||
| Labour hold | Swing | ||||
| Labour hold | Swing | ||||
| Party | Candidate | Votes | % | ±% | |
|---|---|---|---|---|---|
| Conservative | 510 | 55.4 | -3.4 | ||
| Labour | 410 | 44.6 | +3.4 | ||
| Majority | 100 | 10.8 | |||
| Turnout | 920 | 27.0 | |||
| Conservative hold | Swing | ||||
2003-2007[]
| Party | Candidate | Votes | % | ±% | |
|---|---|---|---|---|---|
| Labour | Malcolm Ratcliffe | 1,414 | 54.9 | -5.7 | |
| Conservative | Carole Bonham | 943 | 36.6 | -2.8 | |
| UKIP | James Orange | 219 | 8.5 | +8.5 | |
| Majority | 471 | 18.3 | |||
| Turnout | 2,576 | ||||
| Labour hold | Swing | ||||
| Party | Candidate | Votes | % | ±% | |
|---|---|---|---|---|---|
| Conservative | Margaret Birkett | 560 | 55.1 | +27.2 | |
| Labour | Julie Grunshaw | 456 | 44.9 | -27.2 | |
| Majority | 104 | 10.2 | |||
| Turnout | 1,016 | 32.0 | |||
| Conservative gain from Labour | Swing | ||||
2007-2011[]
| Party | Candidate | Votes | % | ±% | |
|---|---|---|---|---|---|
| Conservative | Patsy Ormrod | 769 | 51.9 | -10.1 | |
| Labour | Billy Glasgow | 339 | 22.9 | +1.1 | |
| BNP | James Clayton | 222 | 15.0 | +15.0 | |
| UKIP | Roy Hopwood | 151 | 10.2 | -6.0 | |
| Majority | 430 | 29.0 | |||
| Turnout | 1,481 | ||||
| Conservative hold | Swing | ||||
| Party | Candidate | Votes | % | ±% | |
|---|---|---|---|---|---|
| Conservative | Sue Catterall | 778 | 67.8 | -32.2 | |
| Independent | Jim Proctor | 309 | 26.9 | +26.9 | |
| Liberal Democrats | Chandos Elletson | 60 | 5.2 | +5.2 | |
| Majority | 469 | 40.9 | |||
| Turnout | 1,481 | 39.9 | |||
| Conservative hold | Swing | ||||
| Party | Candidate | Votes | % | ±% | |
|---|---|---|---|---|---|
| Conservative | David Walmsley | 492 | 38.3 | +4.2 | |
| UKIP | Roy Hopwood | 345 | 26.9 | -4.8 | |
| Labour | Wayne Martin | 331 | 25.8 | +0.7 | |
| BNP | James Clayton | 116 | 9.0 | +9.0 | |
| Majority | 147 | 11.4 | |||
| Turnout | 1,284 | 37.0 | |||
| Conservative hold | Swing | ||||
| Party | Candidate | Votes | % | ±% | |
|---|---|---|---|---|---|
| Conservative | Lesley Ann McKay | 847 | 73.4 | +0.6 | |
| Labour | Alan Morgan | 307 | 26.6 | -0.6 | |
| Majority | 540 | 46.79 | |||
| Turnout | 1154 | 34.91% | |||
| Conservative hold | Swing | ||||
2011-2015[]
| Party | Candidate | Votes | % | ±% | |
|---|---|---|---|---|---|
| Conservative | Margaret Bond | 330 | 38.73 | +5.05 | |
| Independent | Zac Moore | 287 | 33.69 | N/A | |
| TUSC | Ray Smith | 235 | 27.58 | N/A | |
| Majority | 43 | 5.05 | |||
| Turnout | 853 | 17.82 | |||
| Conservative hold | Swing | ||||
References[]
- ^ "Wyre Borough Councillors". Wyre Borough Council. Archived from the original on 13 June 2011. Retrieved 23 October 2009.
- ^ "Wyre Borough Council Election Results 1973-2011" (PDF).
- ^ "Wyre". BBC News Online. Retrieved 23 October 2009.
- ^ The Borough of Wyre (Electoral Arrangements) Order 1976
- ^ "Local elections". BBC News Online. Retrieved 23 October 2009.
- ^ legislation.gov.uk - The Borough of Wyre (Electoral Changes) Order 2001. Retrieved on 4 October 2015.
- ^ legislation.gov.uk - The Wyre (Electoral Changes) Order 2014. Retrieved on 3 November 2015.
- ^ "Warren Ward Borough Elections, 2005". Wyre Borough Council. Retrieved 23 October 2009.
- ^ "Park Ward Borough Elections, 2006". Wyre Borough Council. Retrieved 23 October 2009.
- ^ "Tories hold on to seats in by-election". Blackpool Gazette. 9 February 2008. Retrieved 23 October 2009.
- ^ "Conservatives win Great Eccleston by-election". The Garstang Courier. 20 June 2008. Retrieved 23 October 2009.
- ^ "Conservative sweep to by election triumph". Blackpool Gazette. 23 October 2009. Retrieved 23 October 2009.
- ^ [1][dead link]
External links[]
| County Council | |
|---|---|
| Blackburn with Darwen | |
| Blackpool | |
| Burnley | |
| Chorley | |
| Fylde | |
| Hyndburn | |
| Lancaster | |
| Pendle | |
| Preston | |
| Ribble Valley | |
| Rossendale | |
| South Ribble | |
| West Lancashire | |
| Wyre | |
| |
Categories:
- Wyre Borough Council elections
- Local government in the Borough of Wyre
- Politics of Wyre
- Council elections in Lancashire
- District council elections in England