Rochdale Metropolitan Borough Council elections
This article uses bare URLs, which may be threatened by link rot. (May 2021) |
One third of Rochdale Metropolitan Borough Council in Greater Manchester, England is elected each year, followed by one year without election. Since the last boundary changes in 2004, 60 councillors have been elected from 20 wards.[1]
Political control[]
Since the first election to the council in 1973 political control of the council has been held by the following parties:[2]
| Party in control | Years | |
|---|---|---|
| Labour | 1973–1975 | |
| No overall control | 1975–1976 | |
| Conservative | 1976–1979 | |
| No overall control | 1979–1980 | |
| Labour | 1980–1982 | |
| No overall control | 1982–1986 | |
| Labour | 1986–1992 | |
| No overall control | 1996–1996 | |
| Labour | 1996–2003 | |
| No overall control | 2003–2007 | |
| Liberal Democrats | 2007–2010 | |
| No overall control | 2010–2011 | |
| Labour | 2011–present | |
Council elections[]
- 1998 election
- 1999 election
- 2000 election
- 2002 election
- 2003 election
- 2004 election[a]
- 2006 election
- 2007 election
- 2008 election
- 2010 election
- 2011 election
- 2012 election
- 2014 election
- 2015 election
- 2016 election
- 2018 election
- 2019 election
- 2021 election
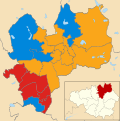
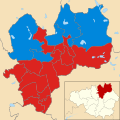
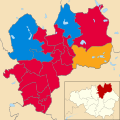
Borough result maps[]

2004 results map

2006 results map

2007 results map
2008 results map

2010 results map
2011 results map

2012 results map

2014 results map

2015 results map

2016 results map

2018 results map

2019 results map
2021 results map


By-election results[]
1993-1997[]
| Party | Candidate | Votes | % | ±% | |
|---|---|---|---|---|---|
| Liberal Democrats | 2,015 | 56.6 | |||
| Labour | 1,109 | 31.7 | |||
| Conservative | 413 | 11.6 | |||
| Independent | 22 | 0.6 | |||
| Majority | 906 | 24.9 | |||
| Turnout | 3,559 | ||||
| Liberal Democrats hold | Swing | ||||
1997-2001[]
| Party | Candidate | Votes | % | ±% | |
|---|---|---|---|---|---|
| Liberal Democrats | 1,347 | 52.2 | +18.7 | ||
| Labour | 716 | 27.8 | -3.2 | ||
| Conservative | 432 | 16.8 | -5.6 | ||
| Independent | 84 | 3.3 | +3.3 | ||
| Majority | 631 | 24.4 | |||
| Turnout | 2,579 | 29.0 | |||
| Liberal Democrats hold | Swing | ||||
2005-2010[]
| Party | Candidate | Votes | % | ±% | |
|---|---|---|---|---|---|
| Labour | Jonathan Burns | 603 | 41.6 | -9.8 | |
| Liberal Democrats | Rhoda Morley | 566 | 39.1 | +21.3 | |
| Conservative | David Harris | 280 | 19.3 | -11.5 | |
| Majority | 37 | 2.5 | |||
| Turnout | 1,449 | 18.2 | |||
| Labour hold | Swing | ||||
2010-2015[]
| Party | Candidate | Votes | % | ±% | |
|---|---|---|---|---|---|
| Labour | Anthony Joseph William Bennett | 627 | 29.7% | +3.0% | |
| Liberal Democrats | Patricia Ann Colclough | 246 | 11.7% | -4.4% | |
| National Front | Peter Greenwood[6] | 156 | 7.4% | +7.4% | |
| Conservative | Peter Nicholas Winkler | 1,081 | 51.2% | -6.0% | |
| Majority | 460 | 21.8% | -8.7% | ||
| Turnout | 2,110 | 27.1% | -12.9% | ||
References[]
- ^ "Elections". Rochdale Metropolitan Borough Council. Archived from the original on 2 May 2010. Retrieved 7 May 2010.
- ^ "Rochdale". BBC News Online. 19 April 2009. Retrieved 7 May 2010.
- ^ "Rochdale Metropolitan Borough Council". BBC News Online. Retrieved 7 May 2010.
- ^ "Labour hold on in by-election". Middleton Guardian. 30 November 2007. Retrieved 7 May 2010.
- ^ http://www.rochdale.gov.uk/the_council/elections/election_-_norden_ward.aspx
- ^ "Newdawnparty.uk".
External links[]
Metropolitan districts of England | ||
|---|---|---|
| Districts |
|  |
| Councils |
| |
| Local elections |
| |
Categories:
- Rochdale Council elections
- Local government in the Metropolitan Borough of Rochdale
- Council elections in Greater Manchester
- Elections in the Metropolitan Borough of Rochdale
- Metropolitan borough council elections in England