Ruhland
Ruhland | |
|---|---|
 Town square | |
 Coat of arms | |
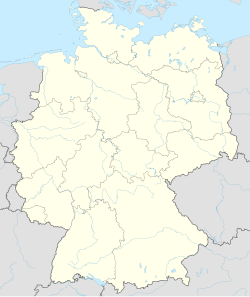
show Location of Ruhland within Oberspreewald-Lausitz district | |
 Ruhland | |
| Coordinates: 51°28′00″N 13°52′00″E / 51.46667°N 13.86667°ECoordinates: 51°28′00″N 13°52′00″E / 51.46667°N 13.86667°E | |
| Country | Germany |
| State | Brandenburg |
| District | Oberspreewald-Lausitz |
| Municipal assoc. | Ruhland |
| Government | |
| • Mayor (2019–24) | Martin Höntsch[1] (SPD) |
| Area | |
| • Total | 37.12 km2 (14.33 sq mi) |
| Elevation | 96 m (315 ft) |
| Population (2020-12-31)[2] | |
| • Total | 3,739 |
| • Density | 100/km2 (260/sq mi) |
| Time zone | UTC+01:00 (CET) |
| • Summer (DST) | UTC+02:00 (CEST) |
| Postal codes | 01945 |
| Dialling codes | 035752 |
| Vehicle registration | OSL |
| Website | www.ruhland.de |


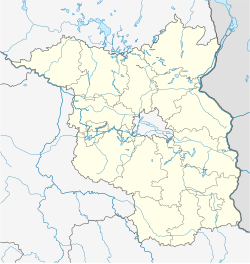

![]() Ruhland (help·info) (Sorbian: Rólany) is a town in the Oberspreewald-Lausitz district, in southern Brandenburg, Germany. It is situated on the river Schwarze Elster, 12 km southwest of Senftenberg.
Ruhland (help·info) (Sorbian: Rólany) is a town in the Oberspreewald-Lausitz district, in southern Brandenburg, Germany. It is situated on the river Schwarze Elster, 12 km southwest of Senftenberg.
Ruhland station is a major railway junction, for freight and for passenger services. The hourly 4-way connection between locomotive-hauled passenger services converging from Hoyerswerda, Cottbus, Leipzig and Dresden is a most impressive sight.
Demography[]

Development of Population since 1875 within the Current Boundaries (Blue Line: Population; Dotted Line: Comparison to Population Development of Brandenburg state; Grey Background: Time of Nazi rule; Red Background: Time of Communist rule)
|
|
References[]
- ^ Landkreis Oberspreewald-Lausitz Wahl der Bürgermeisterin / des Bürgermeisters, accessed 2 July 2021.
- ^ "Bevölkerung im Land Brandenburg nach amtsfreien Gemeinden, Ämtern und Gemeinden 31. Dezember 2020". Amt für Statistik Berlin-Brandenburg (in German). June 2021.
- ^ Detailed data sources are to be found in the Wikimedia Commons.Population Projection Brandenburg at Wikimedia Commons
| show Towns and municipalities in Oberspreewald-Lausitz |
|---|
| Authority control |
|---|
This Brandenburg location article is a stub. You can help Wikipedia by . |
Categories:
- Towns in Brandenburg
- Wikipedia articles with GND identifiers
- Wikipedia articles with VIAF identifiers
- Wikipedia articles with WORLDCATID identifiers
- Ruhland
- Localities in Oberspreewald-Lausitz
- West Lusatia
- Localities in Upper Lusatia
- German Silesia
- Province of Silesia
- Province of Lower Silesia
- Bezirk Cottbus
- Brandenburg geography stubs