Sagay, Camiguin
Sagay | |
|---|---|
| Municipality of Sagay | |
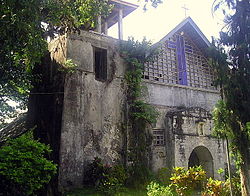 Sagay Church | |
 Map of Camiguin with Sagay highlighted | |
OpenStreetMap  | |
 Sagay Location within the Philippines | |
| Coordinates: 9°07′N 124°43′E / 9.12°N 124.72°ECoordinates: 9°07′N 124°43′E / 9.12°N 124.72°E | |
| Country | Philippines |
| Region | Northern Mindanao |
| Province | Camiguin |
| District | Lone district |
| Founded | July 31, 1909 |
| Barangays | 9 (see Barangays) |
| Government | |
| • Type | Sangguniang Bayan |
| • Mayor | Joseph G. Uayan |
| • Vice Mayor | Nestor E. Tongol |
| • Representative | Xavier Jesus D. Romualdo |
| • Municipal Council | Members |
| • Electorate | 9,386 voters (2019) |
| Area | |
| • Total | 44.13 km2 (17.04 sq mi) |
| Elevation | 116 m (381 ft) |
| Population (2020 census) [3] | |
| • Total | 12,826 |
| • Density | 290/km2 (750/sq mi) |
| • Households | 2,875 |
| Economy | |
| • Income class | 5th municipal income class |
| • Poverty incidence | 44.93% (2015)[4] |
| • Revenue | ₱72,516,410.00 (2020) |
| • Assets | ₱200,797,813.00 (2020) |
| • Expenditure | ₱64,773,564.00 (2020) |
| • Liabilities | ₱35,325,157.00 (2020) |
| Service provider | |
| • Electricity | Camiguin Electric Cooperative (CAMELCO) |
| Time zone | UTC+8 (PST) |
| ZIP code | 9103 |
| PSGC | |
| IDD : area code | +63 (0)88 |
| Native languages | Kinamigin Cebuano Tagalog |
| Website | www |

Sagay, officially the Municipality of Sagay, is a 5th class municipality in the province of Camiguin, Philippines. According to the 2020 census, it has a population of 12,826 people. [3]
History[]
The town square of Sagay includes a British cannon. This cannon has been dated at 1707, and is a nine-pounder Demi-Culverin. It can clearly be identified as British by the emblem on the top which includes the Tudor rose. It was possibly left behind in 1763 after the siege of Manila, and perhaps was brought to Camiguin by the Spanish to defend against Moro raiders.
In 1909, the municipality of Sagay was created. Prior to this date, Sagay town had been a part of the municipality of Catarman. Initially, Sagay municipality included the town of Guinsiliban, but that later became a municipality in its own right.
In 1942, the Japanese Occupation forces entered the town of Sagay, Camiguin.
In 1945, the town of Sagay was liberated by the invasion of the Filipino forces of the 6th and 10th Infantry Division of the Philippine Commonwealth Army who attacked the Japanese Imperial forces during the Battle of Camiguin at the end of World War II.
Geography[]
Climate[]
| Climate data for Sagay, Camiguin | |||||||||||||
|---|---|---|---|---|---|---|---|---|---|---|---|---|---|
| Month | Jan | Feb | Mar | Apr | May | Jun | Jul | Aug | Sep | Oct | Nov | Dec | Year |
| Average high °C (°F) | 28 (82) |
29 (84) |
30 (86) |
31 (88) |
30 (86) |
30 (86) |
30 (86) |
30 (86) |
30 (86) |
30 (86) |
29 (84) |
29 (84) |
30 (85) |
| Average low °C (°F) | 24 (75) |
24 (75) |
24 (75) |
25 (77) |
26 (79) |
26 (79) |
25 (77) |
25 (77) |
25 (77) |
25 (77) |
25 (77) |
25 (77) |
25 (77) |
| Average precipitation mm (inches) | 271 (10.7) |
217 (8.5) |
193 (7.6) |
178 (7.0) |
344 (13.5) |
423 (16.7) |
362 (14.3) |
358 (14.1) |
329 (13.0) |
320 (12.6) |
322 (12.7) |
260 (10.2) |
3,577 (140.9) |
| Average rainy days | 23.2 | 19.5 | 22.0 | 22.8 | 29.6 | 28.9 | 30.3 | 29.8 | 28.1 | 28.8 | 26.1 | 24.1 | 313.2 |
| Source: Meteoblue [5] | |||||||||||||
Barangays[]
Sagay is politically subdivided into 9 barangays.
- Alangilan
- Bacnit
- Balite
- Bonbon
- Bugang
- Cuña
- Manuyog
- Mayana
- Poblacion
Demographics[]
| Year | Pop. | ±% p.a. |
|---|---|---|
| 1903 | 6,321 | — |
| 1918 | 8,551 | +2.03% |
| 1939 | 9,907 | +0.70% |
| 1948 | 18,061 | +6.90% |
| 1960 | 7,552 | −7.01% |
| 1970 | 8,559 | +1.26% |
| 1975 | 7,728 | −2.03% |
| 1980 | 9,120 | +3.37% |
| 1990 | 9,494 | +0.40% |
| 1995 | 9,243 | −0.50% |
| 2000 | 10,356 | +2.47% |
| 2007 | 11,198 | +1.08% |
| 2010 | 11,873 | +2.15% |
| 2015 | 12,626 | +1.18% |
| 2020 | 12,826 | +0.31% |
| Source: Philippine Statistics Authority [6] [7] [8][9] | ||
In the 2020 census, the population of Sagay, Camiguin, was 12,826 people, [3] with a density of 290 inhabitants per square kilometre or 750 inhabitants per square mile.
Economy[]
| Poverty Incidence of Sagay | |
| Source: Philippine Statistics Authority[10][11][12][13][14][15][16] | |
References[]
- ^ Municipality of Sagay | (DILG)
- ^ "2015 Census of Population, Report No. 3 – Population, Land Area, and Population Density" (PDF). Philippine Statistics Authority. Quezon City, Philippines. August 2016. ISSN 0117-1453. Archived (PDF) from the original on May 25, 2021. Retrieved July 16, 2021.
- ^ a b c Census of Population (2020). "Region X (Northern Mindanao)". Total Population by Province, City, Municipality and Barangay. PSA. Retrieved 8 July 2021.
- ^ https://psa.gov.ph/sites/default/files/City%20and%20Municipal-level%20Small%20Area%20Poverty%20Estimates_%202009%2C%202012%20and%202015_0.xlsx; publication date: 10 July 2019; publisher: Philippine Statistics Authority.
- ^ "Sagay: Average Temperatures and Rainfall". Meteoblue. Retrieved 4 March 2020.
- ^ Census of Population (2015). "Region X (Northern Mindanao)". Total Population by Province, City, Municipality and Barangay. PSA. Retrieved 20 June 2016.
- ^ Census of Population and Housing (2010). "Region X (Northern Mindanao)". Total Population by Province, City, Municipality and Barangay. NSO. Retrieved 29 June 2016.
- ^
Censuses of Population (1903–2007). "Region X (Northern Mindanao)". Table 1. Population Enumerated in Various Censuses by Province/Highly Urbanized City: 1903 to 2007. NSO.
{{cite encyclopedia}}: CS1 maint: url-status (link) - ^ "Province of Camiguin". Municipality Population Data. Local Water Utilities Administration Research Division. Retrieved 17 December 2016.
- ^ "Poverty incidence (PI):". Philippine Statistics Authority. Retrieved 28 December 2020.
- ^ https://psa.gov.ph/sites/default/files/NSCB_LocalPovertyPhilippines_0.pdf; publication date: 29 November 2005; publisher: Philippine Statistics Authority.
- ^ https://psa.gov.ph/sites/default/files/2003%20SAE%20of%20poverty%20%28Full%20Report%29_1.pdf; publication date: 23 March 2009; publisher: Philippine Statistics Authority.
- ^ https://psa.gov.ph/sites/default/files/2006%20and%202009%20City%20and%20Municipal%20Level%20Poverty%20Estimates_0_1.pdf; publication date: 3 August 2012; publisher: Philippine Statistics Authority.
- ^ https://psa.gov.ph/sites/default/files/2012%20Municipal%20and%20City%20Level%20Poverty%20Estima7tes%20Publication%20%281%29.pdf; publication date: 31 May 2016; publisher: Philippine Statistics Authority.
- ^ https://psa.gov.ph/sites/default/files/City%20and%20Municipal-level%20Small%20Area%20Poverty%20Estimates_%202009%2C%202012%20and%202015_0.xlsx; publication date: 10 July 2019; publisher: Philippine Statistics Authority.
- ^ "PSA Releases the 2018 Municipal and City Level Poverty Estimates". Philippine Statistics Authority. 15 December 2021. Retrieved 22 January 2022.
External links[]
| Wikimedia Commons has media related to Sagay, Camiguin. |
Places adjacent to Sagay, Camiguin | |
|---|---|
Mambajao (capital) | |
| Municipalities | |
- Municipalities of Camiguin