San Pascual, Masbate
San Pascual | |
|---|---|
| Municipality of San Pascual | |
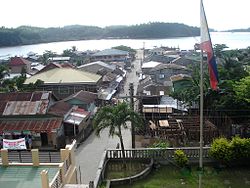 Downtown area | |
 Map of Masbate with San Pascual highlighted | |
OpenStreetMap  | |
 San Pascual Location within the Philippines | |
| Coordinates: 13°08′N 122°59′E / 13.13°N 122.98°ECoordinates: 13°08′N 122°59′E / 13.13°N 122.98°E | |
| Country | Philippines |
| Region | Bicol Region |
| Province | Masbate |
| District | 1st district |
| Barangays | 22 (see Barangays) |
| Government | |
| • Type | Sangguniang Bayan |
| • Mayor | Niño Maximino A. Lazaro |
| • Vice Mayor | Haira L. Rivera |
| • Representative | Narciso R. Bravo Jr. |
| • Municipal Council | Members |
| • Electorate | 26,973 voters (2019) |
| Area | |
| • Total | 246.65 km2 (95.23 sq mi) |
| Elevation | 47.5 m (155.8 ft) |
| Highest elevation | 414 m (1,358 ft) |
| Lowest elevation | 0 m (0 ft) |
| Population (2020 census) [4] | |
| • Total | 44,449 |
| • Density | 180/km2 (470/sq mi) |
| • Households | 9,819 |
| Economy | |
| • Income class | 3rd municipal income class |
| • Poverty incidence | 57.12% (2015)[5] |
| • Revenue | ₱187,088,954.20 (2020) |
| • Assets | ₱624,459,985.93 (2020) |
| • Expenditure | ₱164,095,610.79 (2020) |
| • Liabilities | ₱207,070,139.02 (2020) |
| Service provider | |
| • Electricity | Masbate Electric Cooperative (MASELCO) |
| Time zone | UTC+8 (PST) |
| ZIP code | 5420 |
| PSGC | |
| IDD : area code | +63 (0)56 |
| Native languages | Masbateño Central Bikol Tagalog |
| Website | www |

San Pascual, officially the Municipality of San Pascual, is a 3rd class municipality in the province of Masbate, Philippines. According to the 2020 census, it has a population of 44,449 people. [4]
In addition to the northern part of Burias Island, the islands of Busing, Templo (or Iniwaran,) and another six small unpopulated islands belong to the municipality.
Barangays[]

San Pascual is politically subdivided into 22 barangays. [6]
- Boca Chica
- Bolod (Poblacion)
- Busing
- Dangcalan
- Halabangbaybay
- Iniwaran
- Ki-Buaya (Rizal)
- Ki-Romero (Roxas)
- Malaking Ilog
- Laurente
- Mabini
- Mabuhay
- Mapanique
- Nazareno
- Pinamasingan
- Quintina
- San Jose
- Terraplin
- Santa Cruz
- San Rafael
- Makahoy
- Cueva
Climate[]
| Climate data for San Pascual, Masbate | |||||||||||||
|---|---|---|---|---|---|---|---|---|---|---|---|---|---|
| Month | Jan | Feb | Mar | Apr | May | Jun | Jul | Aug | Sep | Oct | Nov | Dec | Year |
| Average high °C (°F) | 27 (81) |
28 (82) |
29 (84) |
31 (88) |
31 (88) |
31 (88) |
30 (86) |
29 (84) |
29 (84) |
29 (84) |
29 (84) |
28 (82) |
29 (85) |
| Average low °C (°F) | 22 (72) |
22 (72) |
22 (72) |
24 (75) |
24 (75) |
25 (77) |
25 (77) |
25 (77) |
25 (77) |
24 (75) |
24 (75) |
23 (73) |
24 (75) |
| Average precipitation mm (inches) | 55 (2.2) |
36 (1.4) |
45 (1.8) |
42 (1.7) |
114 (4.5) |
184 (7.2) |
245 (9.6) |
224 (8.8) |
238 (9.4) |
171 (6.7) |
130 (5.1) |
94 (3.7) |
1,578 (62.1) |
| Average rainy days | 13.0 | 9.5 | 11.8 | 12.7 | 21.3 | 25.3 | 28.3 | 26.5 | 26.4 | 24.2 | 19.9 | 16.1 | 235 |
| Source: Meteoblue [7] | |||||||||||||
Demographics[]
|
| |||||||||||||||||||||||||||||||||||||||||||||||||||
| Source: Philippine Statistics Authority [8] [9] [10][11] | ||||||||||||||||||||||||||||||||||||||||||||||||||||
In the 2020 census, the population of San Pascual, Masbate, was 44,449 people, [4] with a density of 180 inhabitants per square kilometre or 470 inhabitants per square mile.
Economy[]
| Poverty Incidence of San Pascual | |
| Source: Philippine Statistics Authority[12][13][14][15][16][17][18] | |
Tourism[]

One of the popular tourist destinations in the municipality of San Pascual is the Sombrero Island with its pure white sand beach.
References[]
- ^ Municipality of San Pascual | (DILG)
- ^ "2015 Census of Population, Report No. 3 – Population, Land Area, and Population Density" (PDF). Philippine Statistics Authority. Quezon City, Philippines. August 2016. ISSN 0117-1453. Archived (PDF) from the original on May 25, 2021. Retrieved July 16, 2021.
- ^ https://www.philatlas.com/luzon/r05/masbate/san-pascual.html.
- ^ a b c Census of Population (2020). "Region V (Bicol Region)". Total Population by Province, City, Municipality and Barangay. PSA. Retrieved 8 July 2021.
- ^ https://psa.gov.ph/sites/default/files/City%20and%20Municipal-level%20Small%20Area%20Poverty%20Estimates_%202009%2C%202012%20and%202015_0.xlsx; publication date: 10 July 2019; publisher: Philippine Statistics Authority.
- ^ "Province: Masbate". PSGC Interactive. Quezon City, Philippines: Philippine Statistics Authority. Retrieved 12 November 2016.
- ^ "San Pascual: Average Temperatures and Rainfall". Meteoblue. Retrieved 23 June 2020.
- ^ Census of Population (2015). "Region V (Bicol Region)". Total Population by Province, City, Municipality and Barangay. PSA. Retrieved 20 June 2016.
- ^ Census of Population and Housing (2010). "Region V (Bicol Region)". Total Population by Province, City, Municipality and Barangay. NSO. Retrieved 29 June 2016.
- ^
Censuses of Population (1903–2007). "Region V (Bicol Region)". Table 1. Population Enumerated in Various Censuses by Province/Highly Urbanized City: 1903 to 2007. NSO.
{{cite encyclopedia}}: CS1 maint: url-status (link) - ^ "Province of Masbate". Municipality Population Data. Local Water Utilities Administration Research Division. Retrieved 17 December 2016.
- ^ "Poverty incidence (PI):". Philippine Statistics Authority. Retrieved 28 December 2020.
- ^ https://psa.gov.ph/sites/default/files/NSCB_LocalPovertyPhilippines_0.pdf; publication date: 29 November 2005; publisher: Philippine Statistics Authority.
- ^ https://psa.gov.ph/sites/default/files/2003%20SAE%20of%20poverty%20%28Full%20Report%29_1.pdf; publication date: 23 March 2009; publisher: Philippine Statistics Authority.
- ^ https://psa.gov.ph/sites/default/files/2006%20and%202009%20City%20and%20Municipal%20Level%20Poverty%20Estimates_0_1.pdf; publication date: 3 August 2012; publisher: Philippine Statistics Authority.
- ^ https://psa.gov.ph/sites/default/files/2012%20Municipal%20and%20City%20Level%20Poverty%20Estima7tes%20Publication%20%281%29.pdf; publication date: 31 May 2016; publisher: Philippine Statistics Authority.
- ^ https://psa.gov.ph/sites/default/files/City%20and%20Municipal-level%20Small%20Area%20Poverty%20Estimates_%202009%2C%202012%20and%202015_0.xlsx; publication date: 10 July 2019; publisher: Philippine Statistics Authority.
- ^ "PSA Releases the 2018 Municipal and City Level Poverty Estimates". Philippine Statistics Authority. 15 December 2021. Retrieved 22 January 2022.
External links[]
| Wikimedia Commons has media related to San Pascual, Masbate. |
- San Pascual Profile at PhilAtlas.com
- Philippine Standard Geographic Code
- Philippine Census Information
- Local Governance Performance Management System
Places adjacent to San Pascual, Masbate | ||||||||||||||||
|---|---|---|---|---|---|---|---|---|---|---|---|---|---|---|---|---|
| ||||||||||||||||
Masbate City (capital) | |
| Municipalities | |
| Component city | |
This article about a location in Bicol Region is a stub. You can help Wikipedia by . |
- Municipalities of Masbate
- Bicol Region geography stubs