Schmiedrued
Schmiedrued | |
|---|---|
 | |
 Coat of arms | |
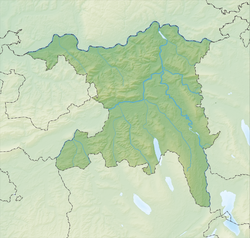
show Location of Schmiedrued | |
 Schmiedrued | |
| Coordinates: 47°16′N 8°7′E / 47.267°N 8.117°ECoordinates: 47°16′N 8°7′E / 47.267°N 8.117°E | |
| Country | Switzerland |
| Canton | Aargau |
| District | Kulm |
| Area | |
| • Total | 8.65 km2 (3.34 sq mi) |
| Elevation | 566 m (1,857 ft) |
| Population (2018-12-31)[2] | |
| • Total | 1,168 |
| • Density | 140/km2 (350/sq mi) |
| Time zone | UTC+01:00 (Central European Time) |
| • Summer (DST) | UTC+02:00 (Central European Summer Time) |
| Postal code(s) | 5046 |
| SFOS number | 4143 |
| Surrounded by | Gontenschwil, Kirchleerau, Moosleerau, Oberkulm, Rickenbach (LU), Schlierbach (LU), Schlossrued, Triengen (LU) |
| Website | www SFSO statistics |


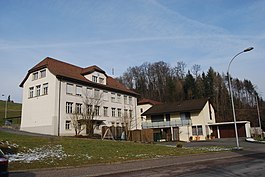
Schmiedrued is a municipality in the district of Kulm in the canton of Aargau in Switzerland.
Geography[]

Schmiedrued has an area, as of 2009, of 8.64 square kilometers (3.34 sq mi). Of this area, 5.55 square kilometers (2.14 sq mi) or 64.2% is used for agricultural purposes, while 2.37 square kilometers (0.92 sq mi) or 27.4% is forested. Of the rest of the land, 0.67 square kilometers (0.26 sq mi) or 7.8% is settled (buildings or roads).[3]
Of the built up area, housing and buildings made up 4.6% and transportation infrastructure made up 2.8%. 25.1% of the total land area is heavily forested and 2.3% is covered with orchards or small clusters of trees. Of the agricultural land, 25.1% is used for growing crops and 33.0% is pastures, while 6.1% is used for orchards or vine crops.[3]
Coat of arms[]
The blazon of the municipal coat of arms is Azure a Hammer Sable headed Argent and in chief two Oars of the last in Saltire and in chief a Mullet of the same. This may be an example of canting, where the hammer (German: schmied) representing the first part of Schmiedrued and the second part of the name is illustrated by the oars (German: Ruder).[4]
Demographics[]

Schmiedrued has a population (as of December 2019) of 1,152[5] As of June 2009, 7.8% of the population are foreign nationals.[6] Over the last 10 years (1997–2007) the population has changed at a rate of 1.9%. Most of the population (as of 2000) speaks German (94.3%), with Albanian being second most common ( 2.8%) and Spanish being third ( 0.7%).[7]
The age distribution, as of 2008, in Schmiedrued is; 116 children or 9.6% of the population are between 0 and 9 years old and 173 teenagers or 14.3% are between 10 and 19. Of the adult population, 136 people or 11.2% of the population are between 20 and 29 years old. 119 people or 9.8% are between 30 and 39, 236 people or 19.5% are between 40 and 49, and 189 people or 15.6% are between 50 and 59. The senior population distribution is 95 people or 7.9% of the population are between 60 and 69 years old, 85 people or 7.0% are between 70 and 79, there are 50 people or 4.1% who are between 80 and 89,and there are 10 people or 0.8% who are 90 and older.[8]
As of 2000, there were 25 homes with 1 or 2 persons in the household, 211 homes with 3 or 4 persons in the household, and 176 homes with 5 or more persons in the household. The average number of people per household was 2.77 individuals.[9] As of 2000, there were 431 private households (homes and apartments) in the municipality, and an average of 2.8 persons per household.[7] In 2008 there were 226 single family homes (or 44.2% of the total) out of a total of 511 homes and apartments.[10] There were a total of 5 empty apartments for a 1.0% vacancy rate.[10] As of 2007, the construction rate of new housing units was 0 new units per 1000 residents.[7]
In the 2007 federal election the most popular party was the SVP which received 52.5% of the vote. The next three most popular parties were the CSP (13%), the SP (8.5%) and the Green Party (6.9%).[7]
In Schmiedrued about 67.7% of the population (between age 25-64) have completed either non-mandatory upper secondary education or additional higher education (either university or a Fachhochschule).[7] Of the school age population (in the 2008/2009 school year), there are 104 students attending primary school, there are 54 students attending secondary school in the municipality.[9]
The historical population is given in the following table:[8]
| Year | Pop. | ±% |
|---|---|---|
| 1975 | 964 | — |
| 1980 | 911 | −5.5% |
| 1990 | 1,016 | +11.5% |
| 2000 | 1,230 | +21.1% |
Economy[]
As of 2007, Schmiedrued had an unemployment rate of 0.96%. As of 2005, there were 114 people employed in the primary economic sector and about 48 businesses involved in this sector. 122 people are employed in the secondary sector and there are 7 businesses in this sector. 106 people are employed in the tertiary sector, with 21 businesses in this sector.[7]
In 2000 there were 585 workers who lived in the municipality. Of these, 407 or about 69.6% of the residents worked outside Schmiedrued while 103 people commuted into the municipality for work. There were a total of 281 jobs (of at least 6 hours per week) in the municipality.[11] Of the working population, 6.8% used public transportation to get to work, and 56% used a private car.[7]
Religion[]
| Wikimedia Commons has media related to Schmiedrued. |
From the 2000 census, 208 or 17.1% were Roman Catholic, while 854 or 70.1% belonged to the Swiss Reformed Church.[9]
References[]
- ^ Jump up to: a b "Arealstatistik Standard - Gemeinden nach 4 Hauptbereichen". Federal Statistical Office. Retrieved 13 January 2019.
- ^ "Ständige Wohnbevölkerung nach Staatsangehörigkeitskategorie Geschlecht und Gemeinde; Provisorische Jahresergebnisse; 2018". Federal Statistical Office. 9 April 2019. Retrieved 11 April 2019.
- ^ Jump up to: a b Swiss Federal Statistical Office-Land Use Statistics 2009 data (in German) accessed 25 March 2010
- ^ Flags of the World.com accessed 30-April-2010
- ^ "Ständige und nichtständige Wohnbevölkerung nach institutionellen Gliederungen, Geburtsort und Staatsangehörigkeit". bfs.admin.ch (in German). Swiss Federal Statistical Office - STAT-TAB. 31 December 2019. Retrieved 6 October 2020.
- ^ Statistical Department of Canton Aargau -Bereich 01 -Bevölkerung (in German) accessed 20 January 2010
- ^ Jump up to: a b c d e f g Swiss Federal Statistical Office accessed 30-April-2010
- ^ Jump up to: a b Statistical Department of Canton Aargau -Bevölkerungsdaten für den Kanton Aargau und die Gemeinden (Archiv) (in German) accessed 20 January 2010
- ^ Jump up to: a b c Statistical Department of Canton Aargau - Aargauer Zahlen 2009 (in German) accessed 20 January 2010
- ^ Jump up to: a b Statistical Department of Canton Aargau (in German) accessed 20 January 2010
- ^ Statistical Department of Canton Aargau-Bereich 11 Verkehr und Nachrichtenwesen (in German) accessed 21 January 2010
| show Authority control |
|---|
- Municipalities of Aargau