South Croydon (ward)
| South Croydon | |
|---|---|
| ward for Croydon Council | |
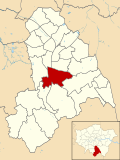 Boundary of South Croydon in Croydon from 2018. | |
| County | Greater London |
| Current ward | |
| Created | 2018 |
| Councillor | Maria Gatland (Conservative) |
| Councillor | Micheal Neal (Conservative) |
| Councillor | Jason Perry (Conservative) |
| Number of councillors | Three |
| Created from | Croham |
| UK Parliament constituency | Croydon South |
| UK Parliament constituency | Croydon Central |

South Croydon is a ward in the London Borough of Croydon, London in the United Kingdom, covering part of the Croham Hurst and South Croydon.
The ward returns three councillors every four years to Croydon Council. The ward held its first election in 2018. The ward has largely replaced the former Croham Ward. At the 2018 election, Maria Gatland, Michael Neal and Jason Perry were elected for South Croydon Ward, as Conservative Party candidates, becoming the first councillors for the ward. According to the Croydon Observatory, run by the Council, the 2016 population was 18,100[1]
The ward is in Croydon South constituency held by Chris Philp MP, one of the safest Conservative seats in London.
List of Councillors[]
| Election | Councillor | Party | Councillor | Party | Councillor | Party | ||||||
|---|---|---|---|---|---|---|---|---|---|---|---|---|
| 2018 | Ward created | |||||||||||
| 2018 | Maria Gatland | Conservative | Michael Neal | Conservative | Jason Perry | Conservative | ||||||
Election Results[]
| Party | Candidate | Votes | % | ±% | |
|---|---|---|---|---|---|
| Conservative | Maria Gatland | 2,345 | 18.02 | ||
| Conservative | Michael Neal | 2,169 | 16.67 | ||
| Conservative | Jason Perry | 2,108 | 16.20 | ||
| Labour | Stella Nabukeera | 1,633 | 12.55 | ||
| Labour | Matthew Dimas Hill | 1,606 | 12.34 | ||
| Labour | Paul Martin Waddell | 1,575 | 12.11 | ||
| Green | Stephen Harris | 442 | 3.40 | ||
| Liberal Democrats | Michael Thomas Albert Bishopp | 438 | 3.37 | ||
| Green | Saima Raza | 395 | 3.04 | ||
| Green | Marc Richards | 339 | 2.61 | ||
| Liberal Democrats | Toby William Keynes | 294 | 2.26 | ||
| Independent | Mark Robin Lionel Samuel | 104 | 0.80 | ||
| Majority | 475 | 3.65 | |||
| Turnout | 4,719 | 40.08 | |||
| Registered electors | 11,774 | ||||
| Conservative hold | Swing | ||||
| Conservative hold | Swing | ||||
| Conservative hold | Swing | ||||
References[]
- ^ "Croydon Observatory - Population". Retrieved 25 Jun 2018.
- ^ "Declaration of Results - Local Elections 2018" (PDF). Croydon Council. Retrieved 25 Jun 2018.
External links[]
Coordinates: 51°21′22″N 0°05′20″W / 51.356°N 0.089°W
This London location article is a stub. You can help Wikipedia by . |
- Wards of the London Borough of Croydon
- London geography stubs