Taraclia District
This article needs additional citations for verification. (December 2009) |
Taraclia | |
|---|---|
District (Raion) | |
 Flag  Coat of arms | |
 | |
| Country | |
| Administrative center (Oraş-reşedinţă) | Taraclia |
| Government | |
| • Raion President | Vasile Plagov |
| Area | |
| • Total | 674 km2 (260 sq mi) |
| Population | |
| • Total | 37,357 |
| • Density | 55/km2 (140/sq mi) |
| Time zone | UTC+2 (EET) |
| • Summer (DST) | UTC+3 (EEST) |
| Area code(s) | |
| Car plates | TA |
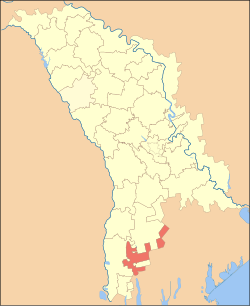
Taraclia (Romanian pronunciation: [taraˈkli.a], Bulgarian: Тараклия) is a district (Romanian: raion) in the south of Moldova, with the administrative center at Taraclia.
As of 1 January 2012, its population was 44,100, 65.6% of whom were ethnic Bulgarians. The district covers an area of 1,022 km2 (395 sq mi) and has the lowest population density of all districts of Moldova.
Demographics[]
- Births (2010): 464 (10.5 per 1000)
- Deaths (2010): 562 (12.7 per 1000)
- Growth Rate (2010): –98 (–2.2 per 1000)
Ethnic groups[]
| Ethnic group | % of those who declared an ethnicity |
|---|---|
| Bulgarians | 66.1 |
| Moldovans * | 14.0 |
| Gagauz | 9.0 |
| Ukrainians | 5.2 |
| Russians | 4.5 |
| Romani | 0.5 |
| Romanians * | 0.2 |
| Other | 0.5 |
Footnote: * There is an ongoing controversy regarding the ethnic identification of Moldovans and Romanians.
Religion[]
- Christians – 96.6%
- Orthodox Christians - 94.3%
- Protestant – 2.3%
- Baptists – 1.3%
- Evangelicals – 0.5%
- Pentecostals – 0.3%
- Seventh-day Adventists – 0.2%
- Other – 1.7%
- No Religion – 1.3%
- Atheists – 0.4%
Politics[]
Traditionally in Taraclia district, political and electoral support for the PCRM is higher than the rest of the southern part of Moldova. Communists have the largest percentage of the Moldova votes in this district. But the last three elections communists saw a continuous decline in percentage.
During the last three elections AEI had an increase of 147.1%
| Year | AEI | PCRM |
|---|---|---|
| 2010 | 19.75% 3,845 | 69.61% 13,561 |
| July 2009 | 16.15% 3,183 | 80.70% 15,897 |
| April 2009 | 8.02% 1,556 | 69.41% 13,477 |
Elections[]
| Parties and coalitions | Votes | % | +/− | |
|---|---|---|---|---|
| Party of Communists of the Republic of Moldova | 13,561 | 69.61 | −11.09 | |
| Democratic Party of Moldova | 2,180 | 11,19 | +1.14 | |
| Liberal Democratic Party of Moldova | 1,217 | 6.25 | +3.28 | |
| United Moldova | 621 | 3.19 | +3.19 | |
| 483 | 2.48 | +2.48 | ||
| Social Democratic Party | 425 | 2.18 | +0.22 | |
| Party Alliance Our Moldova | 256 | 1.31 | −0.62 | |
| Liberal Party | 192 | 1.00 | −0.20 | |
| Other Party | 548 | 2.79 | +1.60 | |
| Total (turnout 60.80%) | 19,656 | 100.00 |
| |
References[]
| Districts | |
|---|---|
| Autonomous regions |
|
| Municipalities | |
| |

- Taraclia District
- Districts of Moldova
- Bulgarian communities in Moldova
- Bulgarian-speaking countries and territories