Tarragona, Davao Oriental
Tarragona | |
|---|---|
| Municipality of Tarragona | |
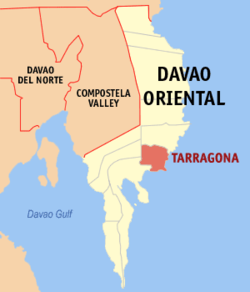 Map of Davao Oriental with Tarragona highlighted | |
show OpenStreetMap | |
 Tarragona Location within the Philippines | |
| Coordinates: 7°02′57″N 126°26′49″E / 7.0491°N 126.44708°ECoordinates: 7°02′57″N 126°26′49″E / 7.0491°N 126.44708°E | |
| Country | Philippines |
| Region | Davao Region |
| Province | Davao Oriental |
| District | 1st district |
| Named for | Tarragona, Spain |
| Barangays | 10 (see Barangays) |
| Government | |
| • Type | Sangguniang Bayan |
| • Mayor | Nestor L. Uy |
| • Vice Mayor | Edelyn S. Bualan |
| • Representative | Corazon N. Malanyaon |
| • Electorate | 18,998 voters (2019) |
| Area | |
| • Total | 300.76 km2 (116.12 sq mi) |
| Elevation | 178 m (584 ft) |
| Highest elevation | 1,733 m (5,686 ft) |
| Lowest elevation | 0 m (0 ft) |
| Population (2020 census) [3] | |
| • Total | 26,996 |
| • Density | 90/km2 (230/sq mi) |
| • Households | 5,632 |
| Economy | |
| • Income class | 3rd municipal income class |
| • Poverty incidence | 34.92% (2015)[4] |
| • Revenue | ₱97,951,887.73 (2016) |
| Service provider | |
| • Electricity | Davao Oriental Electric Cooperative (DORECO) |
| Time zone | UTC+8 (PST) |
| ZIP code | 8201 |
| PSGC | |
| IDD : area code | +63 (0)87 |
| Climate type | tropical rainforest climate |
| Native languages | Davawenyo Surigaonon Cebuano Kalagan Kamayo Tagalog |
| Website | www |


Tarragona, officially the Municipality of Tarragona (Cebuano: Lungsod sa Tarragona; Tagalog: Bayan ng Tarragona), is a 3rd class municipality in the province of Davao Oriental, Philippines. According to the 2020 census, it has a population of 26,996 people. [3]
Geography[]
Climate[]
Tarragona has a tropical rainforest climate (Af) with heavy rainfall year-round.
| hideClimate data for Tarragona | |||||||||||||
|---|---|---|---|---|---|---|---|---|---|---|---|---|---|
| Month | Jan | Feb | Mar | Apr | May | Jun | Jul | Aug | Sep | Oct | Nov | Dec | Year |
| Average high °C (°F) | 30.4 (86.7) |
30.6 (87.1) |
31.5 (88.7) |
32.2 (90.0) |
32.0 (89.6) |
31.4 (88.5) |
31.2 (88.2) |
31.4 (88.5) |
31.7 (89.1) |
31.8 (89.2) |
31.6 (88.9) |
30.9 (87.6) |
31.4 (88.5) |
| Daily mean °C (°F) | 26.0 (78.8) |
26.2 (79.2) |
26.7 (80.1) |
27.4 (81.3) |
27.5 (81.5) |
27.0 (80.6) |
26.8 (80.2) |
26.9 (80.4) |
27.0 (80.6) |
27.2 (81.0) |
27.0 (80.6) |
26.5 (79.7) |
26.9 (80.3) |
| Average low °C (°F) | 21.7 (71.1) |
21.8 (71.2) |
22.0 (71.6) |
22.6 (72.7) |
23.0 (73.4) |
22.6 (72.7) |
22.4 (72.3) |
22.5 (72.5) |
22.4 (72.3) |
22.6 (72.7) |
22.4 (72.3) |
22.2 (72.0) |
22.3 (72.2) |
| Average rainfall mm (inches) | 321 (12.6) |
254 (10.0) |
184 (7.2) |
142 (5.6) |
132 (5.2) |
148 (5.8) |
129 (5.1) |
115 (4.5) |
106 (4.2) |
146 (5.7) |
151 (5.9) |
234 (9.2) |
2,062 (81) |
| Source: Climate-Data.org[5] | |||||||||||||
Barangays[]
Tarragona is politically subdivided into 10 barangays.
- Cabagayan
- Central (Poblacion)
- Dadong
- Jovellar
- Limot
- Lucatan
- Maganda
- Ompao
- Tomoaong
- Tubaon
Demographics[]
| Year | Pop. | ±% p.a. |
|---|---|---|
| 1970 | 9,468 | — |
| 1975 | 11,149 | +3.33% |
| 1980 | 14,122 | +4.84% |
| 1990 | 18,495 | +2.73% |
| 1995 | 19,779 | +1.27% |
| 2000 | 22,846 | +3.14% |
| 2007 | 24,363 | +0.89% |
| 2010 | 25,671 | +1.92% |
| 2015 | 26,225 | +0.41% |
| 2020 | 26,996 | +0.57% |
| Source: Philippine Statistics Authority [6] [7] [8][9] | ||
Economy[]
| Poverty Incidence of Tarragona | |
| Source: Philippine Statistics Authority[10][11][12][13][14][15] | |
References[]
- ^ Municipality of Tarragona | (DILG)
- ^ "2015 Census of Population, Report No. 3 – Population, Land Area, and Population Density" (PDF). Philippine Statistics Authority. Quezon City, Philippines. August 2016. ISSN 0117-1453. Archived (PDF) from the original on May 25, 2021. Retrieved July 16, 2021.
- ^ Jump up to: a b Census of Population (2020). "Region XI (Davao Region)". Total Population by Province, City, Municipality and Barangay. PSA. Retrieved 8 July 2021.
- ^ https://psa.gov.ph/sites/default/files/City%20and%20Municipal-level%20Small%20Area%20Poverty%20Estimates_%202009%2C%202012%20and%202015_0.xlsx; publication date: 10 July 2019; publisher: Philippine Statistics Authority.
- ^ "Climate: Tarragona". Climate-Data.org. Retrieved 27 October 2020.
- ^ Census of Population (2015). "Region XI (Davao Region)". Total Population by Province, City, Municipality and Barangay. PSA. Retrieved 20 June 2016.
- ^ Census of Population and Housing (2010). "Region XI (Davao Region)". Total Population by Province, City, Municipality and Barangay. NSO. Retrieved 29 June 2016.
- ^ Censuses of Population (1903–2007). "Region XI (Davao Region)". Table 1. Population Enumerated in Various Censuses by Province/Highly Urbanized City: 1903 to 2007. NSO.
- ^ "Province of Davao Oriental". Municipality Population Data. Local Water Utilities Administration Research Division. Retrieved 17 December 2016.
- ^ "Poverty incidence (PI):". Philippine Statistics Authority. Retrieved 28 December 2020.
- ^ https://psa.gov.ph/sites/default/files/NSCB_LocalPovertyPhilippines_0.pdf; publication date: 29 November 2005; publisher: Philippine Statistics Authority.
- ^ https://psa.gov.ph/sites/default/files/2003%20SAE%20of%20poverty%20%28Full%20Report%29_1.pdf; publication date: 23 March 2009; publisher: Philippine Statistics Authority.
- ^ https://psa.gov.ph/sites/default/files/2006%20and%202009%20City%20and%20Municipal%20Level%20Poverty%20Estimates_0_1.pdf; publication date: 3 August 2012; publisher: Philippine Statistics Authority.
- ^ https://psa.gov.ph/sites/default/files/2012%20Municipal%20and%20City%20Level%20Poverty%20Estima7tes%20Publication%20%281%29.pdf; publication date: 31 May 2016; publisher: Philippine Statistics Authority.
- ^ https://psa.gov.ph/sites/default/files/City%20and%20Municipal-level%20Small%20Area%20Poverty%20Estimates_%202009%2C%202012%20and%202015_0.xlsx; publication date: 10 July 2019; publisher: Philippine Statistics Authority.
External links[]
- Tarragona Profile at PhilAtlas.com
- Philippine Standard Geographic Code
- Philippine Census Information
- Local Governance Performance Management System
| show Places adjacent to Tarragona, Davao Oriental |
|---|
| show |
|---|
| Authority control |
|
|---|
This article about a location in Davao Region is a stub. You can help Wikipedia by . |
Categories:
- Municipalities of Davao Oriental
- Philippines geography stubs