The Church of Jesus Christ of Latter-day Saints membership statistics (United States)
The Church of Jesus Christ of Latter-day Saints in the United States | |
|---|---|
 The Salt Lake Temple | |
| Membership | 6,721,032 (2019)[1] |
| Stakes | 1,642 (2019) |
| Districts | 5 |
| Wards | 12,677 |
| Branches | 1,782 |
| Total Congregations | 14,459 |
| Missions | 108 |
| Temples | 81 |
| Family History Centers | 1,870[2] |
| Year | Members | ±% |
|---|---|---|
| 2011 | 6,144,582 | — |
| 2012 | 6,321,416 | +2.9% |
| 2013 | 6,398,889 | +1.2% |
| 2014 | 6,466,267 | +1.1% |
| 2015 | 6,531,656 | +1.0% |
| 2016 | 6,592,195 | +0.9% |
| 2017 | 6,641,886 | +0.8% |
| 2018 | 6,681,829 | +0.6% |
| 2019 | 6,721,032 | +0.6% |
| Source: https://newsroom.churchofjesuschrist.org/facts-and-statistics/country/united-states | ||
This page shows the membership statistics of The Church of Jesus Christ of Latter-day Saints (LDS Church) within the United States.
- Official LDS Membership - Membership count on record provided by the LDS Church. These records include adults and children, and also include both active and less active members.
- From religious surveys - General religious surveys conducted within the United States. These surveyed U.S. adults about their religious beliefs.
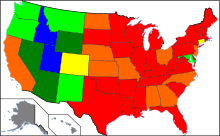
Official LDS Membership[]
Membership reported by the LDS Church on December 31, 2018 was used to determine the number of members in each state.[3] The LDS Church defines membership as:[4]
- Those who have been baptized and confirmed.
- Those under age nine who have been blessed but not baptized.
- Those who are not accountable because of intellectual disabilities, regardless of age.
- Unblessed children under age eight when:
- Two member parents request it.
- One member parent requests it and the nonmember parent gives permission.
The United States Census Bureau July 1, 2019 population estimates was used as the basis for the general population.[5] Each state link gives a brief history and additional membership information for that state.
 |
 |
| State | Membership | Population | LDS | Temples | Missions | Districts | Stakes | Wards | Branches | Congregations | Family History Centers |
|---|---|---|---|---|---|---|---|---|---|---|---|
| Alabama | 37,765 | 4,903,185 | 0.77% | 1 | 1 | 0 | 8 | 48 | 28 | 76 | 44 |
| Alaska | 33,495 | 731,545 | 4.58% | 1 | 1 | 0 | 8 | 59 | 21 | 80 | 15 |
| Arizona | 436,521 | 7,278,717 | 6.00% | 6 | 6 | 0 | 115 | 842 | 84 | 926 | 74 |
| Arkansas | 32,307 | 3,017,804 | 1.07% | 0 | 2 | 0 | 7 | 46 | 23 | 69 | 25 |
| California | 756,507 | 39,512,223 | 1.91% | 7 | 15 | 0 | 153 | 1,092 | 137 | 1,229 | 228 |
| Colorado | 150,509 | 5,758,736 | 2.61% | 2 | 4 | 0 | 35 | 279 | 32 | 311 | 64 |
| Connecticut | 15,946 | 3,565,287 | 0.45% | 1 | 0 | 0 | 3 | 29 | 7 | 36 | 10 |
| Delaware | 5,634 | 973,764 | 0.58% | 0 | 0 | 0 | 2 | 10 | 2 | 12 | 3 |
| District of Columbia | 3,144 | 705,749 | 0.45% | 0 | 0 | 0 | 0 | 3 | 1 | 4 | 1 |
| Florida | 160,266 | 21,477,737 | 0.75% | 2 | 4 | 0 | 33 | 219 | 48 | 267 | 84 |
| Georgia | 87,411 | 10,617,423 | 0.82% | 1 | 2 | 0 | 17 | 130 | 34 | 164 | 44 |
| Hawaii | 75,009 | 1,415,872 | 5.30% | 2 | 1 | 0 | 16 | 125 | 16 | 141 | 26 |
| Idaho | 462,069 | 1,787,065 | 25.86% | 5 | 3 | 0 | 132 | 1,128 | 53 | 1,181 | 70 |
| Illinois | 56,888 | 12,671,821 | 0.45% | 2 | 1 | 0 | 12 | 94 | 25 | 119 | 42 |
| Indiana | 45,952 | 6,732,219 | 0.68% | 1 | 1 | 0 | 11 | 76 | 25 | 101 | 40 |
| Iowa | 28,402 | 3,155,070 | 0.90% | 0 | 1 | 0 | 8 | 42 | 26 | 68 | 30 |
| Kansas | 38,311 | 2,913,314 | 1.32% | 0 | 1 | 0 | 7 | 60 | 15 | 75 | 29 |
| Kentucky | 35,886 | 4,467,673 | 0.80% | 1 | 1 | 0 | 8 | 49 | 30 | 79 | 28 |
| Louisiana | 29,589 | 4,648,794 | 0.64% | 1 | 1 | 0 | 7 | 35 | 20 | 55 | 15 |
| Maine | 10,958 | 1,344,212 | 0.82% | 0 | 0 | 0 | 2 | 18 | 8 | 26 | 10 |
| Maryland | 43,411 | 6,045,680 | 0.72% | 1 | 2 | 0 | 9 | 63 | 14 | 77 | 14 |
| Massachusetts | 28,040 | 6,892,503 | 0.41% | 1 | 1 | 0 | 6 | 42 | 15 | 57 | 18 |
| Michigan | 45,074 | 9,986,857 | 0.45% | 1 | 2 | 1 | 8 | 60 | 36 | 96 | 43 |
| Minnesota | 33,276 | 5,639,632 | 0.59% | 1 | 1 | 0 | 8 | 52 | 23 | 75 | 29 |
| Mississippi | 21,649 | 2,976,149 | 0.73% | 0 | 0 | 0 | 4 | 29 | 21 | 50 | 20 |
| Missouri | 72,525 | 6,137,428 | 1.18% | 2 | 2 | 0 | 18 | 132 | 22 | 154 | 51 |
| Montana | 50,552 | 1,068,778 | 4.73% | 1 | 1 | 0 | 13 | 87 | 39 | 126 | 50 |
| Nebraska | 25,098 | 1,934,408 | 1.30% | 1 | 1 | 0 | 5 | 40 | 17 | 57 | 18 |
| Nevada | 184,703 | 3,080,156 | 6.00% | 2 | 3 | 0 | 42 | 318 | 32 | 350 | 34 |
| New Hampshire | 8,872 | 1,359,711 | 0.65% | 0 | 1 | 0 | 3 | 16 | 5 | 21 | 6 |
| New Jersey | 34,173 | 8,882,190 | 0.38% | 0 | 1 | 0 | 6 | 42 | 22 | 64 | 20 |
| New Mexico | 69,488 | 2,096,829 | 3.31% | 1 | 2 | 0 | 14 | 103 | 35 | 138 | 31 |
| New York | 83,293 | 19,453,561 | 0.43% | 2 | 2 | 1 | 17 | 92 | 48 | 140 | 65 |
| North Carolina | 89,083 | 10,488,084 | 0.85% | 1 | 2 | 0 | 17 | 141 | 32 | 173 | 51 |
| North Dakota | 11,550 | 762,062 | 1.52% | 1 | 1 | 0 | 3 | 21 | 5 | 26 | 7 |
| Ohio | 62,623 | 11,689,100 | 0.54% | 1 | 2 | 0 | 13 | 102 | 23 | 125 | 46 |
| Oklahoma | 49,227 | 3,956,971 | 1.24% | 1 | 1 | 0 | 9 | 74 | 19 | 93 | 30 |
| Oregon | 153,540 | 4,217,737 | 3.64% | 2 | 3 | 0 | 35 | 259 | 47 | 306 | 76 |
| Pennsylvania | 52,290 | 12,801,989 | 0.41% | 1 | 2 | 0 | 12 | 78 | 30 | 108 | 46 |
| Rhode Island | 4,259 | 1,059,361 | 0.40% | 0 | 0 | 0 | 1 | 6 | 2 | 8 | 1 |
| South Carolina | 41,358 | 5,148,714 | 0.80% | 1 | 1 | 0 | 9 | 59 | 12 | 71 | 23 |
| South Dakota | 10,610 | 884,659 | 1.20% | 0 | 0 | 0 | 2 | 12 | 18 | 30 | 13 |
| Tennessee | 52,920 | 6,829,174 | 0.77% | 2 | 2 | 0 | 12 | 79 | 31 | 110 | 35 |
| Texas | 362,037 | 28,995,881 | 1.25% | 4 | 8 | 2 | 77 | 599 | 124 | 723 | 138 |
| Utah | 2,126,216 | 3,205,958 | 66.32% | 17 | 10 | 1 | 604 | 4,914 | 315 | 5,229 | 170 |
| Vermont | 4,623 | 623,989 | 0.74% | 0 | 0 | 0 | 1 | 7 | 5 | 12 | 8 |
| Virginia | 96,496 | 8,535,519 | 1.13% | 0 | 2 | 0 | 22 | 173 | 31 | 204 | 46 |
| Washington | 289,479 | 7,614,893 | 3.80% | 3 | 7 | 0 | 62 | 476 | 68 | 544 | 97 |
| West Virginia | 17,143 | 1,792,147 | 0.96% | 0 | 1 | 0 | 4 | 24 | 11 | 35 | 14 |
| Wisconsin | 27,125 | 5,822,434 | 0.47% | 0 | 1 | 0 | 6 | 48 | 19 | 67 | 29 |
| Wyoming | 67,729 | 578,759 | 11.70% | 1 | 1 | 0 | 17 | 145 | 26 | 171 | 46 |
| Totals | 6,721,031 | 328,239,523 | 2.05% | 81 | 108 | 5 | 1,643 | 12,677 | 1,782 | 14,459 | 2,157 |
Territories[]
| Territory | Membership | Population | LDS | Temples | Missions | Districts | Stakes | Wards | Branches | Congregations | Family History Centers |
|---|---|---|---|---|---|---|---|---|---|---|---|
| American Samoa | 16,490 | 49,437 | 33.36% | 0 | 0 | 0 | 5 | 38 | 5 | 43 | 5 |
| Guam | 2,550 | 168,485 | 1.51% | 0 | 1 | 0 | 1 | 4 | 1 | 5 | 1 |
| Northern Mariana Islands | 865 | 51,433 | 1.68% | 0 | 0 | 0 | 0 | 1 | 0 | 1 | 1 |
| Puerto Rico | 23,395 | 3,189,068 | 0.73% | 0 | 1 | 0 | 5 | 27 | 12 | 39 | 8 |
| US Virgin Islands | 589 | 106,235 | 0.55% | 0 | 0 | 0 | 0 | 0 | 2 | 2 | 0 |
| Totals | 43,889 | 3,564,658 | 1.23% | 0 | 2 | 0 | 11 | 70 | 20 | 90 | 15 |
From religious surveys[]
2001 American Religious Identification Survey[]
The 2001 American Religious Identification Survey (ARIS) was based on a random digit-dialed telephone survey of 50,281 American adults in the continental U.S.
2007 Pew Forum on Religion & Public Life[]
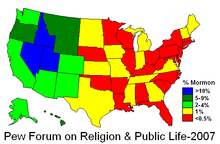
The Pew Forum on Religion & Public Life published a survey of 35,556 adults living in the United States that was conducted in 2007.[6] The 2007 survey, conducted by Princeton Survey Research Associates International (PSRAI), found 1.7% of the U.S. adult population self identified themselves as Mormon.[7] The table below lists a few significant findings, from the survey, about Mormons. Note: some less populated states were combined in this survey. These include:Montana-Wyoming,D.C.-Maryland, North & South Dakota, New Hampshire-Vermont, and Connecticut-Rhode Island.
| Demographic | Mormons (U.S.) | U.S. Avg. |
|---|---|---|
| Married | 71 % | 54 % |
| Divorced or separated | 9 % | 12 % |
| 3 or more children at home | 21 % | 9 % |
| Weekly (or more) Attendance at Religious Services | 76 % | 39 % |
| Race, Ethnicity | Mormons (U.S.) | U.S. Avg. |
|---|---|---|
| White, non-Hisp. | 86 % | 71 % |
| Black, non-Hisp. | 3 % | 11 % |
| Other non-Hisp. | 5 % | 6 % |
| Hispanic | 7 % | 12 % |
See also[]
- The Church of Jesus Christ of Latter-day Saints membership statistics
- The Church of Jesus Christ of Latter-day Saints membership statistics (Canada)
References[]
- ^ "Facts and Statistics: Statistics by Country: United States", Newsroom, LDS Church, retrieved 13 June 2021
- ^ Category:United States Family History Centers, familysearch.org, retrieved 13 June 2021
- ^ "LDS Statistics and Church Facts". Mormon Newsroom. Retrieved 13 April 2019.
- ^ "Membership record". LDSTech Wiki. Archived from the original on 31 October 2016. Retrieved 30 October 2016.
- ^ "State Population Totals: 2010-2018". www.census.gov. Archived from the original on 2019-04-13. Retrieved 2019-04-13.
- ^ "Religion in American Culture -- Pew Forum on Religion & Public Life". Archived from the original on 14 February 2015. Retrieved 14 February 2015.
- ^ Portrait of Mormons in the U.S. Archived 2009-07-30 at the Wayback Machine, Pew Forum on Religion & Public Life, July 24, 2009
| show The Church of Jesus Christ of Latter-day Saints by Country |
|---|


- The Church of Jesus Christ of Latter-day Saints
- The Church of Jesus Christ of Latter-day Saints in the United States
- Religious demographics