Timeline of the 2014 Atlantic hurricane season
| Timeline of the 2014 Atlantic hurricane season | |||||
|---|---|---|---|---|---|
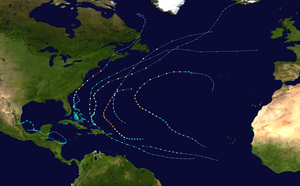 Season summary map | |||||
| Season boundaries | |||||
| First system formed | July 1, 2014 | ||||
| Last system dissipated | October 28, 2014 | ||||
| Strongest system | |||||
| Name | Gonzalo | ||||
| Maximum winds | 145 mph (230 km/h) (1-minute sustained) | ||||
| Lowest pressure | 940 mbar (hPa; 27.76 inHg) | ||||
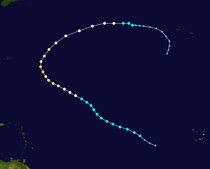
| Longest lasting system | |||||
| Name | Edouard | ||||
| Duration | 8 days | ||||
The 2014 Atlantic hurricane season was an event in the annual hurricane season in the north Atlantic Ocean. It featured below-average tropical cyclone activity,[nb 1] with the fewest named storms since the 1997 season.[2] The season officially began on June 1, 2014 and ended on November 30, 2014. These dates, adopted by convention, historically describe the period in each year when most tropical systems form.[3] Even so, there were no named storms during either the opening or closing months of the season, as the first, Hurricane Arthur, developed on July 1, and the last, Tropical Storm Hanna, dissipated on October 28.
Altogether, eight tropical storms formed during the season, including six hurricanes of which two intensified into major hurricanes.[nb 2] There was also one tropical depression that failed to reach tropical storm strength. Impact throughout the year was widespread. Arthur, which made landfall near Cape Lookout, North Carolina on July 3, with 100 mph (155 km/h) winds, was the strongest hurricane to strike the U.S. mainland since Hurricane Ike in 2008 (with 110 mph (175 km/h) winds).[2] The deadliest Atlantic storm of the season, Cristobal, barely touched land at all as it moved from Puerto Rico to Iceland in late August. Even so, it was responsible for at least seven fatalities: four on Hispaniola, one on Providenciales, and two along the U.S. East Coast.[2] In October, Bermuda was struck twice, as hurricanes Fay and Gonzalo made landfall only six days apart (October 12 and 18 respectively), leaving much damage in their wakes.[2]
This timeline documents tropical cyclone formations, strengthening, weakening, landfalls, extratropical transitions, and dissipations during the season. It includes information that was not released throughout the season, meaning that data from post-storm reviews by the National Hurricane Center, such as a storm that was not initially warned upon, has been included.
By convention, meteorologists use one time zone when issuing forecasts and making observations: Coordinated Universal Time (UTC), and also use the 24-hour clock (where 00:00 = midnight UTC).[5] The National Hurricane Center uses both UTC and the time zone where the center of the tropical cyclone is currently located. The time zones utilized (east to west) prior to 2020 were: Atlantic, Eastern, and Central.[6] In this timeline, all information is listed by UTC first with the respective regional time included in parentheses. Additionally, figures for maximum sustained winds and position estimates are rounded to the nearest 5 units (knots, miles, or kilometers), following the convention used in the National Hurricane Center's products. Direct wind observations are rounded to the nearest whole number. Atmospheric pressures are listed to the nearest millibar and nearest hundredth of an inch of mercury.
Timeline[]

June[]
June 1
- The 2014 Atlantic hurricane season officially begins.[3]
- No tropical cyclones form in the Atlantic Ocean during the month of June.
July[]
July 1
- 00:00 UTC (8:00 p.m. EDT, June 30) near 27°42′N 78°54′W / 27.7°N 78.9°W – Tropical Depression One develops from an area of low pressure about 80 mi (130 km) north of Freeport, Bahamas.[7]
- 12:00 UTC (8:00 a.m. EDT) near 27°30′N 79°12′W / 27.5°N 79.2°W – Tropical Depression One strengthens into Tropical Storm Arthur about 70 mi (110 km) east of Fort Pierce, Florida.[7]

July 3
- 00:00 UTC (8:00 p.m. EDT, July 2) near 30°06′N 79°12′W / 30.1°N 79.2°W – Tropical Storm Arthur strengthens into a Category 1 hurricane about 145 mi (230 km) east-southeast of Savannah, Georgia.[7]
July 4
- 00:00 UTC (8:00 p.m. EDT, July 3) near 34°00′N 77°18′W / 34.0°N 77.3°W – Hurricane Arthur intensifies into a Category 2 hurricane about 45 mi (70 km) east of Cape Fear, North Carolina.[7]
- 03:15 UTC (11:15 p.m. EDT, July 3) near 34°42′N 76°36′W / 34.7°N 76.6°W – Hurricane Arthur makes on Shackleford Banks, about 5 mi (10 km) northwest of Cape Lookout, North Carolina, with winds of 100 mph (155 km/h).[7]
- 06:00 UTC (2:00 a.m. EDT) near 35°18′N 76°00′W / 35.3°N 76.0°W – Hurricane Arthur attains its peak intensity with maximum sustained winds of 100 mph (155 km/h) and a minimum barometric pressure of 973 mbar (28.73 inHg), while over Pamlico Sound.[7]
- 08:00 UTC (4:00 a.m. EDT) near 35°48′N 75°30′W / 35.8°N 75.5°W – Hurricane Arthur makes landfall on the Outer Banks, about 5 mi (10 km) north of Oregon Inlet, North Carolina, with winds of 100 mph (155 km/h).[7]
- 12:00 UTC (8:00 a.m. EDT) near 36°48′N 74°24′W / 36.8°N 74.4°W – Hurricane Arthur weakens to a Category 1 hurricane about 105 mi (165 km) east of Norfolk, Virginia.[7]
July 5
- 06:00 UTC (2:00 a.m. EDT) near 42°18′N 67°36′W / 42.3°N 67.6°W – Hurricane Arthur weakens to a tropical storm about 130 mi (215 km) east of Provincetown, Massachusetts.[7]
- 12:00 UTC (8:00 a.m. EDT) near 44°06′N 66°30′W / 44.1°N 66.5°W – Tropical Storm Arthur becomes an extratropical cyclone about 25 mi (40 km) northwest of Yarmouth, Nova Scotia, and subsequently dissipates.[7]
July 21
- 12:00 UTC (8:00 a.m. AST) near 11°24′N 41°36′W / 11.4°N 41.6°W – Tropical Depression Two develops from a tropical wave about 1,340 mi (2,160 km) east of the Lesser Antilles.[8]
July 23
- 12:00 UTC (18:00 a.m. AST) near 14°00′N 55°00′W / 14.0°N 55.0°W – Tropical Depression Two degenerates into an trough of low pressure about 385 mi (620 km) east of the Lesser Antilles, and later dissipates.[8]
August[]
August 1
- 00:00 UTC (8:00 a.m. AST, July 31) near 12°12′N 54°36′W / 12.2°N 54.6°W – Tropical Storm Bertha develops from a tropical wave about 345 mi (555 km) east-southeast of Barbados.[9]
August 3
- 14:00 UTC (10:00 a.m. AST) near 21°48′N 71°54′W / 21.8°N 71.9°W – Tropical Storm Bertha makes landfall on Middle Caicos, Turks and Caicos Islands, with winds of 45 mph (75 km/h).[9]
August 4
- 12:00 UTC (8:00 a.m. EDT) near 26°48′N 73°36′W / 26.8°N 73.6°W – Tropical Storm Bertha strengthens into a Category 1 hurricane and simultaneously attains its peak intensity with maximum sustained winds of 80 mph (130 km/h) and a minimum barometric pressure of 998 mbar (29.47 inHg), about 195 mi (315 km) north-northeast of San Salvador Island, the Bahamas.[9]
August 5
- 06:00 UTC (2:00 a.m. EDT) near 32°30′N 73°12′W / 32.5°N 73.2°W – Hurricane Bertha weakens to a tropical storm about 585 mi (945 km) north-northeast of San Salvador Island.[9]
August 6
- 18:00 UTC (2:00 p.m. AST) near 40°48′N 61°18′W / 40.8°N 61.3°W – Tropical Storm Bertha transitions into a frontal extratropical cyclone about 290 mi (465 km) south-southeast of Halifax, Nova Scotia, and subsequently degenerates into a trough.[9]
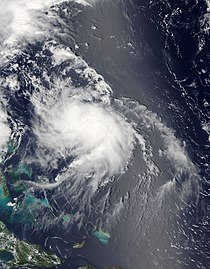
August 23
- 18:00 UTC (2:00 p.m. AST) near 21°30′N 72°12′W / 21.5°N 72.2°W – Tropical Depression Four develops from a tropical wave about 20 mi (35 km) south of Providenciales, Turks and Caicos Islands.[10]
August 24
- 06:00 UTC (2:00 a.m. AST) near 22°36′N 72°54′W / 22.6°N 72.9°W – Tropical Depression Four strengthens into Tropical Storm Cristobal about 15 mi (25 km) north of Mayaguana, Bahamas.[10]
August 26
- 00:00 UTC (8:00 p.m. EDT, August 25) near 25°06′N 72°06′W / 25.1°N 72.1°W – Tropical Storm Cristobal strengthens into a Category 1 hurricane approximately 665 mi (1,075 km) southwest of Bermuda.[10]
August 29
- 00:00 UTC (8:00 p.m. AST, August 28) near 39°06′N 58°48′W / 39.1°N 58.8°W – Hurricane Cristobal attains its peak intensity with maximum sustained winds of 85 mph (140 km/h) and a minimum barometric pressure of 965 mbar (28.50 inHg), about 570 mi (915 km) northeast of Bermuda.[10]
- 12:00 UTC (8:00 a.m. AST) near 44°12′N 49°00′W / 44.2°N 49.0°W – Hurricane Cristobal transitions into an extratropical cyclone about 260 mi (415 km) southeast of Cape Race, Newfoundland, and subsequently merges with another extratropical cyclone after moving across Iceland.[10][11]
September[]
September 1
- 18:00 UTC (1:00 p.m. CDT) near 20°00′N 93°12′W / 20.0°N 93.2°W – Tropical Depression Five develops from a tropical wave about 340 mi (545 km) east-southeast of Tampico, Tamaulipas.[12]
September 2
- 00:00 UTC (7:00 p.m. CDT, September 1) near 21°18′N 93°24′W / 21.3°N 93.4°W – Tropical Depression Five intensifies into Tropical Storm Dolly about 295 mi (470 km) east-southeast of Tampico.[12]
- 12:00 UTC (7:00 a.m. CDT) near 22°48′N 95°36′W / 22.8°N 95.6°W – Tropical Storm Dolly attains its peak sustained winds of 50 mph (85 km/h) about 150 mi (240 km) east-northeast of Tampico.[12]
September 3
- 01:00 UTC (8:00 p.m. CDT, September 2) near 22°00′N 97°24′W / 22.0°N 97.4°W – Tropical Storm Dolly attains its lowest barometric pressure of 1,000 mbar (29.53 inHg), about 35 mi (55 km) south-southeast of Tampico.[12]
- 04:00 UTC (11:00 p.m. CDT, September 2) near 22°00′N 97°42′W / 22.0°N 97.7°W – Tropical Storm Dolly makes landfall about 20 mi (32 km) south-southeast of Tampico, with sustained winds of 45 mph (75 km/h).[12]
- 12:00 UTC (7:00 a.m CDT) near 21°48′N 98°48′W / 21.8°N 98.8°W – Tropical Storm Dolly degenerates inland to a tropical low, about 70 mi (110 km) west-southwest of Tampico, and later dissipates.[12]
September 11
- 12:00 UTC (8:00 a.m. AST) near 15°48′N 36°30′W / 15.8°N 36.5°W – Tropical Depression Six develops from a tropical wave about 830 mi (1,335 km) west of the Cape Verde Islands.[13]
September 12
- 00:00 UTC (8:00 p.m. AST, September 11) near 17°12′N 39°12′E / 17.2°N 39.2°E – Tropical Depression Six intensifies into Tropical Storm Edouard about 920 mi (1,480 km) west of the Cape Verde Islands.[13]
September 14
- 12:00 UTC (8:00 a.m. AST) near 24°24′N 50°18′W / 24.4°N 50.3°W – Tropical Storm Edouard intensifies into a Category 1 hurricane about 1,035 mi (1,665 km) southeast of Bermuda.[13]
September 15
- 06:00 UTC (2:00 a.m. AST) near 26°30′N 54°00′W / 26.5°N 54.0°W – Hurricane Edouard intensifies into a Category 2 hurricane about 765 mi (1,230 km) southeast of Bermuda.[13]
September 16
- 06:00 UTC (2:00 a.m. AST) near 29°30′N 57°18′W / 29.5°N 57.3°W – Hurricane Edouard intensifies into a Category 3 hurricane about 485 mi (780 km) southeast of Bermuda.[13]
- 12:00 UTC (8:00 a.m. AST) near 30°36′N 57°48′W / 30.6°N 57.8°W – Hurricane Edouard attains its peak intensity with maximum sustained winds of 120 mph (195 km/h) and a minimum barometric pressure of 955 mbar (28.20 inHg), about 415 mi (665 km) east of Bermuda.[13]
- 18:00 UTC (2:00 p.m. AST) near 31°42′N 57°42′W / 31.7°N 57.7°W – Hurricane Edouard weakens to a Category 2 hurricane about 420 mi (675 km) east of Bermuda.[13]
September 17
- 12:00 UTC (8:00 a.m. AST) near 35°42′N 54°30′W / 35.7°N 54.5°W – Hurricane Edouard weakens to a Category 1 hurricane about 645 mi (1,035 km) northeast of Bermuda.[13]
September 19
- 00:00 UTC (8:00 p.m. AST, September 18) near 39°54′N 40°06′W / 39.9°N 40.1°W – Hurricane Edouard weakens to a tropical storm about 485 mi (780 km) west-southwest of the western Azores.[13]
- 18:00 UTC (2:00 p.m. AST) near 39°30′N 37°24′W / 39.5°N 37.4°W – Tropical Storm Edouard degenerates into a post-tropical cyclone about 460 mi (740 km) west of the western Azores, and subsequently merges with a frontal system.[13]
October[]
October 10
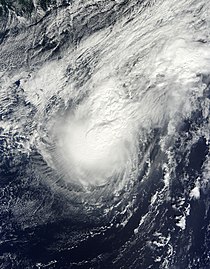
- 06:00 UTC (2:00 a.m. AST) near 22°42′N 62°24′W / 22.7°N 62.4°W – Subtropical Storm Fay develops from a mid- to upper-level trough about 615 mi (990 km) south of Bermuda.[14]
October 11
- 06:00 UTC (2:00 a.m. AST) near 26°00′N 65°00′W / 26.0°N 65.0°W – Subtropical Storm Fay transitions into a tropical storm about 435 mi (705 km) south of Bermuda.[14]
October 12
- 00:00 UTC (8:00 p.m. AST, October 11) near 16°24′N 55°54′W / 16.4°N 55.9°W – Tropical Depression Eight develops from a tropical wave about 390 mi (630 km) east of the Leeward Islands.[15]
- 06:00 UTC (2:00 a.m. AST) near 31°42′N 64°54′W / 31.7°N 64.9°W – Tropical Storm Fay intensifies into a Category 1 hurricane about 40 mi (65 km) south of Bermuda.[14]
- 08:10 UTC (4:10 a.m. AST) near 32°18′N 64°42′W / 32.3°N 64.7°W – Hurricane Fay makes landfall on Bermuda with sustained winds of 80 mph (130 km/h).[14]
- 12:00 UTC (8:00 a.m. AST) near 33°06′N 63°54′W / 33.1°N 63.9°W – Hurricane Fay attains its peak intensity with maximum sustained winds of 80 mph (130 km/h) and a minimum barometric pressure of 983 mbar (29.03 inHg), about 75 mi (120 km) northeast of Bermuda.[14]
- 12:00 UTC (8:00 a.m. AST) near 16°24′N 57°54′W / 16.4°N 57.9°W – Tropical Depression Eight strengthens into Tropical Storm Gonzalo about 255 mi (405 km) east of Antigua.[15]
- 18:00 UTC (2:00 p.m. AST) near 33°36′N 61°54′W / 33.6°N 61.9°W – Hurricane Fay weakens to a tropical storm about 190 mi (305 km) northeast of Bermuda.[14]
October 13
- 00:00 (8:00 p.m. AST, October 12) near 33°54′N 59°00′W / 33.9°N 59.0°W – Tropical Storm Fay degenerates into an open trough about 350 mi (565 km) east-northeast of Bermuda, and later dissipates.[14]
- 12:00 UTC (8:00 a.m. AST) near 17°00′N 61°30′W / 17.0°N 61.5°W – Tropical Storm Gonzalo strengthens into a Category 1 hurricane about 25 mi (35 km) east-southeast of Antigua.[15]
- 14:30 UTC (10:30 a.m. AST) near 17°06′N 61°48′W / 17.1°N 61.8°W – Hurricane Gonzalo makes landfall on Antigua with sustained winds of 75 mph (120 km/h).[15]
- 22:45 UTC (6:45 p.m. AST) near 18°06′N 63°00′W / 18.1°N 63.0°W – Hurricane Gonzalo makes landfall on Saint Martin with sustained winds of 85 mph (140 km/h).[15]
- 23:15 UTC (7:15 p.m. AST) near 18°12′N 63°06′W / 18.2°N 63.1°W – Hurricane Gonzalo makes landfall on Anguilla with sustained winds of 85 mph (140 km/h).[15]
October 14
- 06:00 UTC (2:00 a.m. AST) near 19°06′N 64°00′W / 19.1°N 64.0°W – Hurricane Gonzalo intensifies into a Category 2 hurricane about 40 mi (65 km) northeast of Anegada, British Virgin Islands.[15]
- 18:00 UTC (2:00 p.m. AST) near 20°48′N 65°30′W / 20.8°N 65.5°W – Hurricane Gonzalo intensifies into a Category 3 hurricane about 165 mi (270 km) north of San Juan, Puerto Rico.[15]
October 15
- 00:00 UTC (8:00 p.m. AST, October 14) near 21°42′N 66°12′W / 21.7°N 66.2°W – Hurricane Gonzalo intensifies into a Category 4 hurricane about 225 mi (360 km) north of San Juan, Puerto Rico, and simultaneously attains an initial peak maximum sustained windspeed of 130 mph (215 km/h).[15]
- 18:00 UTC (2:00 p.m. AST) near 23°48′N 68°18′W / 23.8°N 68.3°W – Hurricane Gonzalo weakens to a Category 3 hurricane about 625 mi (1,005 km) south-southwest of Bermuda.[15]
October 16
- 06:00 UTC (2:00 a.m. AST) near 25°00′N 68°42′W / 25.0°N 68.7°W – Hurricane Gonzalo re-intensifies into a Category 4 hurricane about 555 mi (895 km) south-southwest of Bermuda.[15]
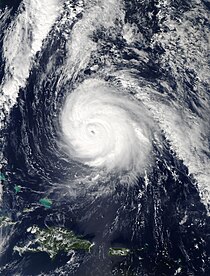
- 12:00 UTC (8:00 a.m. AST) near 25°36′N 68°42′W / 25.6°N 68.7°W – Hurricane Gonzalo attains its peak intensity with maximum sustained winds of 145 mph (230 km/h) and a minimum barometric pressure of 940 mbar (27.76 inHg), about 525 mi (845 km) south-southwest of Bermuda.[15]
October 17
- 12:00 UTC (8:00 a.m. AST) near 29°48′N 66°30′W / 29.8°N 66.5°W – Hurricane Gonzalo again weakens to a Category 3 hurricane about 200 mi (325 km) south-southwest of Bermuda.[15]
October 18
- 00:00 UTC (8:00 p.m. AST, October 17) near 32°12′N 64°54′W / 32.2°N 64.9°W – Hurricane Gonzalo weakens to a Category 2 hurricane about 10 mi (15 km) south-southwest of Bermuda.[15]
- 00:30 UTC (8:30 p.m. AST, October 17) near 32°18′N 64°48′W / 32.3°N 64.8°W – Hurricane Gonzalo makes landfall on Bermuda with sustained winds of 110 mph (175 km/h).[16]
October 19
- 06:00 UTC (2:00 a.m. AST) near 44°30′N 54°48′W / 44.5°N 54.8°W – Hurricane Gonzalo weakens to a Category 1 hurricane about 170 mi (275 km) southwest of the southeastern tip of the Avalon Peninsula of Newfoundland.[15]
- 18:00 UTC (2:00 p.m. AST) near 50°36′N 44°48′W / 50.6°N 44.8°W – Hurricane Gonzalo transitions into an extratropical cyclone about 460 mi (740 km) northeast of Cape Race, Newfoundland, and is later absorbed by a cold front.[nb 3][15][17]
October 22
- 00:00 UTC (7:00 p.m. CDT, October 21) near 19°30′N 93°18′W / 19.5°N 93.3°W – Tropical Depression Nine develops from the remnants of eastern Pacific Tropical Storm Trudy about 175 mi (280 km) west of Campeche City, Campeche, and simultaneously attains its lowest barometric pressure of 1,000 mbar (29.53 inHg).[18]
October 23
- 00:00 UTC (7:00 p.m. CDT, October 22) near 19°12′N 91°18′W / 19.2°N 91.3°W – Tropical Depression Nine degenerates into a remnant low about 65 mi (100 km) southwest of Campeche City.[18]
October 25
- 00:00 UTC (8:00 p.m. EDT, October 24) near 19°00′N 86°12′W / 19.0°N 86.2°W – Remnant Low Nine opens into a trough over the Caribbean Sea, east of the Yucatán Peninsula.[18]
October 26
- 12:00 UTC (8:00 a.m. EDT) near 16°00′N 81°48′W / 16.0°N 81.8°W – Remnant trough Nine redevelops into a small closed area of low pressure about 115 mi (185 km) east-northeast of Cabo Gracias a Dios on the Honduras–Nicaragua border.[18]
October 27
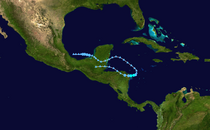
- 00:00 UTC (7:00 p.m. EDT, October 26) near 15°06′N 82°00′W / 15.1°N 82.0°W – Remnant Low Nine regenerates into a tropical depression about 80 mi (130 km) east-northeast of Cabo Gracias a Dios.[18]
- 06:00 UTC (2:00 a.m. EDT) near 15°00′N 82°24′W / 15.0°N 82.4°W – Tropical Depression Nine intensifies into Tropical Storm Hanna about 50 mi (85 km) east of Cabo Gracias a Dios, and simultaneously attains its peak sustained winds of 40 mph (65 km/h).[18]
- 16:00 UTC (12:00 p.m. EDT) near 14°54′N 83°18′W / 14.9°N 83.3°W – Tropical Storm Hanna makes landfall about 10 mi (20 km) west-southwest of Cabo Gracias a Dios with sustained winds of 40 mph (65 km/h).[18]
- 18:00 UTC (2:00 p.m. EDT) near 14°54′N 83°30′W / 14.9°N 83.5°W – Tropical Storm Hanna weakens to a tropical depression inland about 25 mi (35 km) west-southwest of Cabo Gracias a Dios.[18]
October 28
- 06:00 UTC (2:00 a.m. EDT) near 15°24′N 85°12′W / 15.4°N 85.2°W – Tropical Depression Hanna again degenerates into a remnant low about 140 mi (220 km) west-northwest of Cabo Gracias a Dios, and subsequently dissipates.[18]
November[]
- No tropical cyclones form in the Atlantic Ocean during the month of November.
November 30
- The 2000 Atlantic hurricane season officially ends.[3]
See also[]
Notes[]
- ^ An average Atlantic hurricane season, as defined by the National Oceanic and Atmospheric Administration, has 12 tropical storms, six hurricanes and two major hurricanes.[1]
- ^ Hurricanes reaching Category 3 (111 mph / 178 km/h) and higher on the 5-level Saffir–Simpson wind speed scale are considered major hurricanes.[4]
- ^ Gonzalo was absorbed by a cold front several hundred nautical miles south-southwest of Iceland on October 20. The extratropical storm complex incorporating Gonzalo's remnants generated strong wind, heavy rain and snow across Ireland, the United Kingdom, and portions of Europe on October 21–22.[15][17]
References[]
- ^ "Background Information: North Atlantic Hurricane Season". College Park, Maryland: NOAA Climate Prediction Center. Retrieved July 14, 2020.
- ^ a b c d Wiltgen, Nick (December 1, 2014). "2014 Hurricane Season in Review: Eight Things We'll Remember". weather.com. The Weather Channel. Retrieved July 21, 2020.
- ^ a b c Dorst, Neal (June 1, 2018). "Hurricane Season Information". Frequently Asked Questions About Hurricanes. Miami, Florida: NOAA Atlantic Oceanographic and Meteorological Laboratory. Retrieved June 29, 2020.
- ^ "Saffir-Simpson Hurricane Wind Scale". Miami, Florida: National Hurricane Center. Retrieved June 29, 2020.
- ^ "Understanding the Date/Time Stamps". Miami, Florida: NOAA National Hurricane Center. Retrieved July 10, 2020.
- ^ "Update on National Hurricane Center Products and Services for 2020" (PDF). Miami, Florida: National Hurricane Center. April 20, 2020. Retrieved May 17, 2020.
- ^ a b c d e f g h i j Berg, Robbie J. (April 20, 2015). Tropical Cyclone Report: Hurricane Arthur (PDF) (Report). Miami, Florida: National Hurricane Center. Retrieved May 15, 2015.
- ^ a b Avila, Lixion A. (September 24, 2014). Tropical Cyclone Report: Tropical Depression Two (PDF) (Report). Miami, Florida: National Hurricane Center. Retrieved May 15, 2015.
- ^ a b c d e Blake, Eric S. (February 23, 2015). Tropical Cyclone Report: Hurricane Bertha (PDF) (Report). Miami, Florida: National Hurricane Center. Retrieved May 15, 2015.
- ^ a b c d e Pasch, Richard J. (February 11, 2015). Tropical Cyclone Report: Hurricane Cristobal (PDF) (Report). Miami, Florida: National Hurricane Center. Retrieved May 15, 2015.
- ^ Fontaine, Andie Sophia (September 1, 2014). "Stormy Weather Is Hurricane Cristobal Petering Out". The Reykjavík Grapevine. Retrieved July 21, 2021.
- ^ a b c d e f Beven, John L. (January 28, 2015). Tropical Cyclone Report: Tropical Storm Dolly (PDF) (Report). Miami, Florida: National Hurricane Center. pp. 2, 5. Retrieved May 16, 2015.
- ^ a b c d e f g h i j Stewart, Stacy R. (December 10, 2014). Tropical Cyclone Report: Hurricane Edouard (PDF) (Report). Miami, Florida: National Hurricane Center. Retrieved May 16, 2015.
- ^ a b c d e f g Kimberlain, Todd B. (April 24, 2015). Tropical Cyclone Report: Hurricane Fay (PDF) (Report). Miami, Florida: National Hurricane Center. Retrieved May 18, 2015.
- ^ a b c d e f g h i j k l m n o p q Brown, Daniel P. (March 4, 2015). Tropical Cyclone Report: Hurricane Gonzalo (PDF) (Report). Miami, Florida: National Hurricane Center. Retrieved May 18, 2015.
- ^ Stewart, Stacy R. (October 17, 2014). Hurricane Gonzalo Tropical Cyclone Update (Report). Miami, Florida: National Hurricane Center. Retrieved July 21, 2020.
- ^ a b Samenow, Jason (October 22, 2014). "Gonzalo's final blow: Strong winds, heavy rain, and snow in Europe (PHOTOS)". The Washington Post. Retrieved July 21, 2021.
- ^ a b c d e f g h i Cangialosi, John P. (December 16, 2014). Tropical Cyclone Report: Tropical Storm Hanna (PDF) (Report). Miami, Florida: National Hurricane Center. Retrieved May 18, 2015.
External links[]
| Wikimedia Commons has media related to 2014 Atlantic hurricane season. |
- 2014 Atlantic hurricane season
- Atlantic Ocean meteorological timelines
- Tropical cyclones in 2014