Tropical cyclone
It has been suggested that Typhoon be merged into this article. (Discuss) Proposed since August 2021. |

| Part of a series on |
| Weather |
|---|
 |
|
|
A tropical cyclone is a rapidly rotating storm system characterized by a low-pressure center, a closed low-level atmospheric circulation, strong winds, and a spiral arrangement of thunderstorms that produce heavy rain and/or squalls. Depending on its location and strength, a tropical cyclone is referred to by different names, including hurricane (/ˈhʌrɪkən, -keɪn/), typhoon (/taɪˈfuːn/), tropical storm, cyclonic storm, tropical depression, or simply cyclone. A hurricane is a tropical cyclone that occurs in the Atlantic Ocean and northeastern Pacific Ocean, and a typhoon occurs in the northwestern Pacific Ocean; in the south Pacific or Indian Ocean, comparable storms are referred to simply as "tropical cyclones" or "severe cyclonic storms".
"Tropical" refers to the geographical origin of these systems, which form almost exclusively over tropical seas. "Cyclone" refers to their winds moving in a circle, whirling round their central clear eye, with their winds blowing counterclockwise in the Northern Hemisphere and clockwise in the Southern Hemisphere. The opposite direction of circulation is due to the Coriolis effect. Tropical cyclones typically form over large bodies of relatively warm water. They derive their energy through the evaporation of water from the ocean surface, which ultimately recondenses into clouds and rain when moist air rises and cools to saturation. This energy source differs from that of mid-latitude cyclonic storms, such as nor'easters and European windstorms, which are fueled primarily by horizontal temperature contrasts. Tropical cyclones are typically between 100 and 2,000 km (60 and 1,240 mi) in diameter. Every year tropical cyclones impact various regions of the globe including the Gulf Coast of North America, Australia, India and Bangladesh.
The strong rotating winds of a tropical cyclone are a result of the conservation of angular momentum imparted by the Earth's rotation as air flows inwards toward the axis of rotation. As a result, they rarely form within 5° of the equator. Tropical cyclones are almost unknown in the South Atlantic due to a consistently strong wind shear and a weak Intertropical Convergence Zone. Conversely, the African easterly jet and areas of atmospheric instability give rise to cyclones in the Atlantic Ocean and Caribbean Sea, while cyclones near Australia owe their genesis to the Asian monsoon and Western Pacific Warm Pool.
The primary energy source for these storms is warm ocean waters. These storms are therefore typically strongest when over or near water, and weaken quite rapidly over land. This causes coastal regions to be particularly vulnerable to tropical cyclones, compared to inland regions. Coastal damage may be caused by strong winds and rain, high waves (due to winds), storm surges (due to wind and severe pressure changes), and the potential of spawning tornadoes. Tropical cyclones draw in air from a large area and concentrate the water content of that air (from atmospheric moisture and moisture evaporated from water) into precipitation over a much smaller area. This replenishing of moisture-bearing air after rain may cause multi-hour or multi-day extremely heavy rain up to 40 kilometers (25 mi) from the coastline, far beyond the amount of water that the local atmosphere holds at any one time. This in turn can lead to river flooding, overland flooding, and a general overwhelming of local water control structures across a large area. Although their effects on human populations can be devastating, tropical cyclones may play a role in relieving drought conditions, though this claim is disputed. They also carry heat and energy away from the tropics and transport it towards temperate latitudes, which plays an important role in regulating global climate.
| Part of a series on |
| Tropical cyclones |
|---|
|
Outline of tropical cyclones |
Background
A tropical cyclone is the generic term for a warm-cored, non-frontal synoptic-scale low-pressure system over tropical or subtropical waters around the world.[1][2] The systems generally have a well-defined center which is surrounded by deep atmospheric convection and a closed wind circulation at the surface.[1]
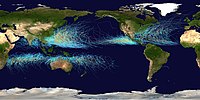
Historically, tropical cyclones have occurred around the world for thousands of years, with one of the earliest tropical cyclones on record estimated to have occurred in Western Australia in around 6000 BC.[3] However, before satellite imagery became available during the 20th century, many of these systems went undetected unless it impacted land or a ship encountered it by chance.[4]
These days, on average around 80 to 90 named tropical cyclones form each year around the world, over half of which develop hurricane-force winds of 65 kn (120 km/h; 75 mph) or more.[4] Around the world, a tropical cyclone is generally deemed to have formed once mean surface winds in excess of 35 kn (65 km/h; 40 mph) are observed.[4] It is assumed at this stage that a tropical cyclone has become self-sustaining and can continue to intensify without any help from its environment.[4]
Structure

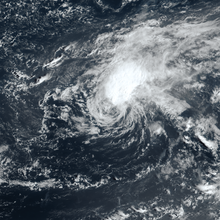
Tropical cyclones on either side of the Equator generally have their origins in the Intertropical Convergence Zone, where winds blow from either the northeast or southeast.[5] Within this broad area of low-pressure, air is heated over the warm tropical ocean and rises in discrete parcels, which causes thundery showers to form.[5] These showers dissipate quite quickly; however, they can group together into large clusters of thunderstorms.[5] This creates a flow of warm, moist, rapidly rising air, which starts to rotate cyclonically as it interacts with the rotation of the earth.[5] There are several factors required for these thunderstorms to develop further, including sea surface temperatures of around 27 °C (81 °F) and low vertical windshear surrounding the system.[5]
Eye and center
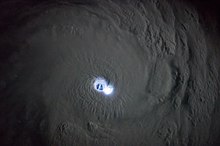
At the center of a mature tropical cyclone, air sinks rather than rises. For a sufficiently strong storm, air may sink over a layer deep enough to suppress cloud formation, thereby creating a clear "eye". Weather in the eye is normally calm and free of convective clouds, although the sea may be extremely violent.[6] The eye is normally circular and is typically 30–65 km (19–40 mi) in diameter, though eyes as small as 3 km (1.9 mi) and as large as 370 km (230 mi) have been observed.[7][8]
The cloudy outer edge of the eye is called the "eyewall". The eyewall typically expands outward with height, resembling an arena football stadium; this phenomenon is sometimes referred to as the "stadium effect".[8] The eyewall is where the greatest wind speeds are found, air rises most rapidly, clouds reach their highest altitude, and precipitation is the heaviest. The heaviest wind damage occurs where a tropical cyclone's eyewall passes over land.[6]
In a weaker storm, the eye may be obscured by the central dense overcast, which is the upper-level cirrus shield that is associated with a concentrated area of strong thunderstorm activity near the center of a tropical cyclone.[9]
The eyewall may vary over time in the form of eyewall replacement cycles, particularly in intense tropical cyclones. Outer rainbands can organize into an outer ring of thunderstorms that slowly moves inward, which is believed to rob the primary eyewall of moisture and angular momentum. When the primary eyewall weakens, the tropical cyclone weakens temporarily. The outer eyewall eventually replaces the primary one at the end of the cycle, at which time the storm may return to its original intensity.[10]
Interaction with the upper ocean
The passage of a tropical cyclone over the ocean causes the upper layers of the ocean to cool substantially, which can influence subsequent cyclone development. This cooling is primarily caused by wind-driven mixing of cold water from deeper in the ocean with the warm surface waters. This effect results in a negative feedback process that can inhibit further development or lead to weakening. Additional cooling may come in the form of cold water from falling raindrops (this is because the atmosphere is cooler at higher altitudes). Cloud cover may also play a role in cooling the ocean, by shielding the ocean surface from direct sunlight before and slightly after the storm passage. All these effects can combine to produce a dramatic drop in sea surface temperature over a large area in just a few days.[11] Conversely, the mixing of the sea can result in heat being inserted in deeper waters, with potential effects on global climate.[12]
Movement
The movement of a tropical cyclone (i.e. its "track") is typically approximated as the sum of two terms: "steering" by the background environmental wind and "beta drift".[13]
Environmental steering
Environmental steering is the primary influence on the motion of tropical cyclones.[14] It represents the movement of the storm due to prevailing winds and other wider environmental conditions, similar to "leaves carried along by a stream".[15]
Physically, the winds, or , in the vicinity of a tropical cyclone may be treated as having two parts: the flow associated with the storm itself, and the large-scale background flow of the environment.[14] Tropical cyclones can be treated as local maxima of vorticity suspended within the large-scale background flow of the environment.[16] In this way, tropical cyclone motion may be represented to first-order as advection of the storm by the local environmental flow.[17] This environmental flow is termed the "steering flow" and is the dominant influence on tropical cyclone motion.[14] The strength and direction of the steering flow can be approximated as a vertical integration of the winds blowing horizontally in the cyclone's vicinity, weighted by the altitude at which those winds are occurring. Because winds can vary with height, determining the steering flow precisely can be difficult.
The pressure altitude at which the background winds are most correlated with a tropical cyclone's motion is known as the "steering level".[16] The motion of stronger tropical cyclones is more correlated with the background flow averaged across a thicker portion of troposphere compared to weaker tropical cyclones whose motion is more correlated with the background flow averaged across a narrower extent of the lower troposphere.[18] When wind shear and latent heat release is present, tropical cyclones tend to move towards regions where potential vorticity is increasing most quickly.[19]
Climatologically, tropical cyclones are steered primarily westward by the east-to-west trade winds on the equatorial side of the subtropical ridge—a persistent high-pressure area over the world's subtropical oceans.[15] In the tropical North Atlantic and Northeast Pacific oceans, the trade winds steer tropical easterly waves westward from the African coast toward the Caribbean Sea, North America, and ultimately into the central Pacific Ocean before the waves dampen out.[20] These waves are the precursors to many tropical cyclones within this region.[21] In contrast, in the Indian Ocean and Western Pacific in both hemispheres, tropical cyclogenesis is influenced less by tropical easterly waves and more by the seasonal movement of the Inter-tropical Convergence Zone and the monsoon trough.[22] Other weather systems such as mid-latitude troughs and broad monsoon gyres can also influence tropical cyclone motion by modifying the steering flow.[18][23]
Beta drift
In addition to environmental steering, a tropical cyclone will tend to drift poleward and westward, a motion known as "beta drift".[24] This motion is due to the superposition of a vortex, such as a tropical cyclone, onto an environment in which the Coriolis force varies with latitude, such as on a sphere or beta plane.[25] The magnitude of the component of tropical cyclone motion associated with the beta drift ranges between 1–3 m/s (4–11 km/h, 2–7 mph) and tends to be larger for more intense tropical cyclones and at higher latitudes. It is induced indirectly by the storm itself as a result of a feedback between the cyclonic flow of the storm and its environment.[26][24]
Physically, the cyclonic circulation of the storm advects environmental air poleward east of center and equatorial west of center. Because air must conserve its angular momentum, this flow configuration induces a cyclonic gyre equatorward and westward of the storm center and an anticyclonic gyre poleward and eastward of the storm center. The combined flow of these gyres acts to advect the storm slowly poleward and westward. This effect occurs even if there is zero environmental flow.[27][28] Due to a direct dependence of the beta drift on angular momentum, the size of a tropical cyclone can impact the influence of beta drift on its motion; beta drift imparts a greater influence on the movement of larger tropical cyclones than that of smaller ones.[29][30]
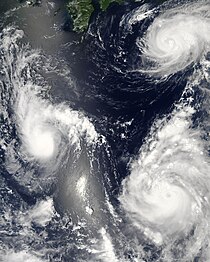
Multiple storm interaction
A third component of motion that occurs relatively infrequently involves the interaction of multiple tropical cyclones. When two cyclones approach one another, their centers will begin orbiting cyclonically about a point between the two systems. Depending on their separation distance and strength, the two vortices may simply orbit around one another or else may spiral into the center point and merge. When the two vortices are of unequal size, the larger vortex will tend to dominate the interaction, and the smaller vortex will orbit around it. This phenomenon is called the Fujiwhara effect, after Sakuhei Fujiwhara.[31]
Interaction with the mid-latitude westerlies

Though a tropical cyclone typically moves from east to west in the tropics, its track may shift poleward and eastward either as it moves west of the subtropical ridge axis or else if it interacts with the mid-latitude flow, such as the jet stream or an extratropical cyclone. This motion, termed "recurvature", commonly occurs near the western edge of the major ocean basins, where the jet stream typically has a poleward component and extratropical cyclones are common.[32] An example of tropical cyclone recurvature was Typhoon Ioke in 2006.[33]
Size
There are a variety of metrics commonly used to measure storm size. The most common metrics include the radius of maximum wind, the radius of 34-knot wind (i.e. gale force), the radius of outermost closed isobar (ROCI), and the radius of vanishing wind.[34][35] An additional metric is the radius at which the cyclone's relative vorticity field decreases to 1×10⁻⁵ s−1.[8]
| Size descriptions of tropical cyclones | |
|---|---|
| ROCI (Diameter) | Type |
| Less than 2 degrees latitude | Very small/minor |
| 2 to 3 degrees of latitude | Small |
| 3 to 6 degrees of latitude | Medium/Average/Normal |
| 6 to 8 degrees of latitude | Large |
| Over 8 degrees of latitude | Very large[36] |
On Earth, tropical cyclones span a large range of sizes, from 100–2,000 kilometres (62–1,243 mi) as measured by the radius of vanishing wind. They are largest on average in the northwest Pacific Ocean basin and smallest in the northeastern Pacific Ocean basin.[37] If the radius of outermost closed isobar is less than two degrees of latitude (222 km (138 mi)), then the cyclone is "very small" or a "midget". A radius of 3–6 latitude degrees (333–670 km (207–416 mi)) is considered "average sized". "Very large" tropical cyclones have a radius of greater than 8 degrees (888 km (552 mi)).[36] Observations indicate that size is only weakly correlated to variables such as storm intensity (i.e. maximum wind speed), radius of maximum wind, latitude, and maximum potential intensity.[35][37]
Rapid intensification
On occasion, tropical cyclones may undergo a process known as rapid intensification, a period in which the maximum sustained winds of a tropical cyclone increase by 30 knots or more within 24 hours.[38] For rapid intensification to occur, several conditions must be in place. Water temperatures must be extremely high (near or above 30 °C, 86 °F), and water of this temperature must be sufficiently deep such that waves do not upwell cooler waters to the surface. On the other hand, Tropical Cyclone Heat Potential is one of such non-conventional subsurface oceanographic parameters influencing the cyclone intensity. Wind shear must be low; when wind shear is high, the convection and circulation in the cyclone will be disrupted. Usually, an anticyclone in the upper layers of the troposphere above the storm must be present as well—for extremely low surface pressures to develop, air must be rising very rapidly in the eyewall of the storm, and an upper-level anticyclone helps channel this air away from the cyclone efficiently.[39] However, some cyclones such as Hurricane Epsilon have rapidly intensified despite relatively unfavorable conditions.[40][41]
Dissipation
There are a number of ways a tropical cyclone can weaken, dissipate, or lose its tropical characteristics. These include making landfall, moving over cooler water, encountering dry air, or interacting with other weather systems; however, once a system has dissipated or lost its tropical characteristics, its remnants could regenerate a tropical cyclone if environmental conditions become favorable.[42][43]
Landfall
Should a tropical cyclone make landfall or pass over an island, its circulation could start to break down, especially if it encounters mountainous terrain.[44] When a system makes landfall on a large landmass, it is cut off from its supply of warm moist maritime air and starts to draw in dry continental air.[44] This, combined with the increased friction over land areas, leads to the weakening and dissipation of the tropical cyclone.[44] Over a mountainous terrain, a system can quickly weaken; however, over flat areas, it may endure for two to three days before circulation breaks down and dissipates.[44]
Factors
A tropical cyclone can dissipate when it moves over waters significantly cooler than 26.5 °C (79.7 °F). This will deprive the storm of such tropical characteristics as a warm core with thunderstorms near the center, so that it becomes a remnant low-pressure area. Remnant systems may persist for several days before losing their identity. This dissipation mechanism is most common in the eastern North Pacific. Weakening or dissipation can also occur if a storm experiences vertical wind shear which causes the convection and heat engine to move away from the center; this normally ceases development of a tropical cyclone.[45] In addition, its interaction with the main belt of the Westerlies, by means of merging with a nearby frontal zone, can cause tropical cyclones to evolve into extratropical cyclones. This transition can take 1–3 days.[46]
Artificial dissipation
Over the years, there have been a number of techniques considered to try to artificially modify tropical cyclones.[47] These techniques have included using nuclear weapons, cooling the ocean with icebergs, blowing the storm away from land with giant fans, and seeding selected storms with dry ice or silver iodide.[47] These techniques, however, fail to appreciate the duration, intensity, power or size of tropical cyclones.[47]
Classification
Nomenclature and intensity classifications
Around the world, tropical cyclones are classified in different ways, based on the location (tropical cyclone basins), the structure of the system and its intensity. For example, within the Northern Atlantic and Eastern Pacific basins, a tropical cyclone with wind speeds of over 65 kn (75 mph; 120 km/h) is called a hurricane, while it is called a typhoon or a severe cyclonic storm within the Western Pacific or North Indian Oceans.[48][49][50] Within the Southern Hemisphere, it is either called a hurricane, tropical cyclone or a severe tropical cyclone, depending on if it is located within the South Atlantic, South-West Indian Ocean, Australian region or the South Pacific Ocean.[51][52]
| hideTropical Cyclone Classifications | ||||||||
|---|---|---|---|---|---|---|---|---|
| Beaufort scale |
1-minute sustained winds (NHC/CPHC/JTWC) |
10-minute sustained winds (WMO/JMA/MF/BOM/FMS) |
NE Pacific & N Atlantic NHC/CPHC[48] |
NW Pacific JTWC |
NW Pacific JMA |
N Indian Ocean IMD[50] |
SW Indian Ocean MF |
Australia & S Pacific BOM/FMS[52] |
| 0–7 | <32 knots (37 mph; 59 km/h) | <28 knots (32 mph; 52 km/h) | Tropical Depression | Tropical Depression | Tropical Depression | Depression | Zone of Disturbed Weather | Tropical Disturbance |
| 7 | 33 knots (38 mph; 61 km/h) | 28–29 knots (32–33 mph; 52–54 km/h) | Deep Depression | Tropical Disturbance | Tropical Depression | |||
| 8 | 34–37 knots (39–43 mph; 63–69 km/h) | 30–33 knots (35–38 mph; 56–61 km/h) | Tropical Storm | Tropical Storm | Tropical Depression | Tropical Low | ||
| 9–10 | 38–54 knots (44–62 mph; 70–100 km/h) | 34–47 knots (39–54 mph; 63–87 km/h) | Tropical Storm | Cyclonic Storm | Moderate Tropical Storm |
Category 1 Tropical Cyclone | ||
| 11 | 55–63 knots (63–72 mph; 102–117 km/h) | 48–55 knots (55–63 mph; 89–102 km/h) | Severe Tropical Storm |
Severe Cyclonic Storm |
Severe Tropical Storm |
Category 2 Tropical Cyclone | ||
| 12+ | 64–71 knots (74–82 mph; 119–131 km/h) | 56–63 knots (64–72 mph; 104–117 km/h) | Category 1 Hurricane |
Typhoon | ||||
| 72–82 knots (83–94 mph; 133–152 km/h) | 64–72 knots (74–83 mph; 119–133 km/h) | Typhoon | Very Severe Cyclonic Storm |
Tropical Cyclone | Category 3 Severe Tropical Cyclone | |||
| 83–95 knots (96–109 mph; 154–176 km/h) | 73–83 knots (84–96 mph; 135–154 km/h) | Category 2 Hurricane | ||||||
| 96–97 knots (110–112 mph; 178–180 km/h) | 84–85 knots (97–98 mph; 156–157 km/h) | Category 3 Major Hurricane |
Very Strong Typhoon | |||||
| 98–112 knots (113–129 mph; 181–207 km/h) | 86–98 knots (99–113 mph; 159–181 km/h) | Extremely Severe Cyclonic Storm |
Intense Tropical Cyclone |
Category 4 Severe Tropical Cyclone | ||||
| 113–122 knots (130–140 mph; 209–226 km/h) | 99–107 knots (114–123 mph; 183–198 km/h) | Category 4 Major Hurricane | ||||||
| 123–129 knots (142–148 mph; 228–239 km/h) | 108–113 knots (124–130 mph; 200–209 km/h) | Violent Typhoon | Category 5 Severe Tropical Cyclone | |||||
| 130–136 knots (150–157 mph; 241–252 km/h) | 114–119 knots (131–137 mph; 211–220 km/h) | Super Typhoon |
Super Cyclonic Storm |
Very Intense Tropical Cyclone | ||||
| >136 knots (157 mph; 252 km/h) | >120 knots (138 mph; 222 km/h) | Category 5 Major Hurricane | ||||||
Intensity
This section needs expansion. You can help by . (April 2021) |
Factors that influence intensity
Warm sea surface temperatures are required in order for tropical cyclones to form and strengthen. The commonly-accepted minimum temperature range for this to occur is 26–27 °C (79–81 °F), however, multiple studies have proposed a lower minimum of 25.5 °C (77.9 °F).[53][54] Higher sea surface temperatures result in faster intensification rates and sometimes even rapid intensification.[55] High ocean heat content, also known as Tropical Cyclone Heat Potential, allows storms to achieve a higher intensity.[56] Most tropical cyclones that experience rapid intensification are traversing regions of high ocean heat content rather than lower values.[57] High ocean heat content values can help to offset the oceanic cooling caused by the passage of a tropical cyclone, limiting the effect this cooling has on the storm.[58] Faster-moving systems are able to intensify to higher intensities with lower ocean heat content values. Slower-moving systems require higher values of ocean heat content to achieve the same intensity.[57]
Vertical wind shear negatively impacts tropical cyclone intensification by displacing moisture and heat from a system's center.[59] Low levels of vertical wind shear are most optimal for strengthening, while stronger wind shear induces weakening.[60][61]
The size of tropical cyclones plays a role in how quickly they intensify. Smaller tropical cyclones are more prone to rapid intensification than larger ones.[62]
Methods for assessing intensity
A variety of methods or techniques, including surface, satellite, and aerial, are utilized to assess the intensity of a tropical cyclone. Reconnaissance aircraft fly around and through tropical cyclones, outfitted with specialized instruments, to collect information that can be used to ascertain the winds and pressure of a system.[4] Tropical cyclones possess winds of different speeds at different heights. Winds recorded at flight level can be converted to find the wind speeds at the surface.[63] Surface observations, such as ship reports, land stations, mesonets, coastal stations, and buoys, can provide information on a tropical cyclone's intensity or the direction it is traveling.[4] Wind-pressure relationships (WPRs) are used as a way to determine the pressure of a storm based on its wind speed. Several different methods and equations have been proposed to calculate WPRs.[64][65] Tropical cyclones agencies each use their own, fixed WPR, which can result in inaccuracies between agencies that are issuing estimates on the same system.[65] The ASCAT is a scatterometer used by the MetOp satellites to map the wind field vectors of tropical cyclones.[4] The SMAP uses an L-band radiometer channel to determine the wind speeds of tropical cyclones at the ocean surface, and has been shown to be reliable at higher intensities and under heavy rainfall conditions, unlike scatterometer-based and other radiometer-based instruments.[66]
The Dvorak technique plays a large role in both the classification of a tropical cyclone and the determination of its intensity. Used in warning centers, the method was developed by Vernon Dvorak in the 1970s, and uses both visible and infrared satellite imagery in the assessment of tropical cyclone intensity. The Dvorak technique utilizes a scale of "T-numbers", scaling in increments of ½ from T1.0 to T8.0. Each T-number has an intensity assigned to it, with larger T-numbers indicating a stronger system. Tropical cyclones are assessed by forecasters according to an array of patterns, including curved banding features, shear, central dense overcast, and eye, in order to determine the T-number and thus assess the intensity of the storm.[67] The Cooperative Institute for Meteorological Satellite Studies works to develop and improve automated satellite methods, such as the Advanced Dvorak Technique (ADT) and SATCON. The ADT, used by a large number of forecasting centers, utilizes infrared geostationary satellite imagery and an algorithm based upon the Dvorak technique to assess the intensity of tropical cyclones. The ADT has a number of differences from the conventional Dvorak technique, including changes to intensity constraint rules and the usage of microwave imagery to base a system's intensity upon its internal structure, which prevents the intensity from leveling off before an eye emerges in infrared imagery.[68] The SATCON weights estimates from various satellite-based systems and microwave sounders, accounting for the strengths and flaws in each individual estimate, to produce a consensus estimate of a tropical cyclone's intensity which can be more reliable than the Dvorak technique at times.[69][70]
Identification codes
Tropical cyclones that develop around the world are assigned an identification code consisting of a two-digit number and suffix letter by the warning centers that monitor them. These codes start at 01 every year and are assigned in order to systems, which have the potential to develop further, cause significant impact to life and property or when the warning centers start to write advisories on the system.[52][71][relevant?]
| hideTropical Cyclone Numbering[71][72][73] | |||
|---|---|---|---|
| Basin(s) | Warning Center |
Format | Example |
| N Atlantic | NHC | nn (nnL)[a] |
06 (06L) |
| NE Pacific (E of 140°W) |
nnE | 09E | |
| NC Pacific (E of IDL, W of 140°W) |
CPHC | nnC | 02C |
| NW Pacific (W of IDL) |
JMA | yynn (nn, Tyynn)[b] |
1330 (30, T1330) |
| JTWC | nnW | 10W | |
| N Indian (Bay of Bengal) |
IMD | BOB nn | BOB 03 |
| JTWC | nnB | 05B | |
| N Indian (Arabian Sea) |
IMD | ARB nn | ARB 01 |
| JTWC | nnA | 02A | |
| Mediterranean | SAB | nnM | 90M |
| SW Indian (W of 90°E) |
MFR | nn (REnn)[c] |
07 (RE07) |
| SW Indian & Australian reg. (W of 135°E) |
JTWC | nnS | 01S |
| Australian reg. (E of 90°E, W of 160°E) |
BOM | nnU | 08U |
| Australian reg. & S Pacific (E of 135°E) |
JTWC | nnP | 04P |
| S Pacific (E of 160°E) |
FMS | nnF | 11F |
| S Atlantic | NRL, NHC[d] | nnQ | 01Q |
| UKMet | nnT[e] | 02T | |
| Notes: | |||
Naming
The practice of using names to identify tropical cyclones goes back many years, with systems named after places or things they hit before the formal start of naming.[80][81] The system currently used provides positive identification of severe weather systems in a brief form, that is readily understood and recognized by the public.[80][81] The credit for the first usage of personal names for weather systems is generally given to the Queensland Government Meteorologist Clement Wragge who named systems between 1887 and 1907.[80][81] This system of naming weather systems subsequently fell into disuse for several years after Wragge retired, until it was revived in the latter part of World War II for the Western Pacific.[80][81] Formal naming schemes have subsequently been introduced for the North and South Atlantic, Eastern, Central, Western and Southern Pacific basins as well as the Australian region and Indian Ocean.[81]
At present, tropical cyclones are officially named by one of twelve meteorological services and retain their names throughout their lifetimes to provide ease of communication between forecasters and the general public regarding forecasts, watches, and warnings.[80] Since the systems can last a week or longer and more than one can be occurring in the same basin at the same time, the names are thought to reduce the confusion about what storm is being described.[80] Names are assigned in order from predetermined lists with one, three, or ten-minute sustained wind speeds of more than 65 km/h (40 mph) depending on which basin it originates.[48][50][51] However, standards vary from basin to basin with some tropical depressions named in the Western Pacific, while tropical cyclones have to have a significant amount of gale-force winds occurring around the center before they are named within the Southern Hemisphere.[51][52] The names of significant tropical cyclones in the North Atlantic Ocean, Pacific Ocean, and Australian region are retired from the naming lists and replaced with another name.[48][49][52]
| Tropical cyclone basins and official warning centers | |||
|---|---|---|---|
| Basin | Warning center | Area of responsibility | Notes |
| Northern Hemisphere | |||
| North Atlantic | United States National Hurricane Center | Equator northward, African Coast – 140°W | [48] |
| Eastern Pacific | United States Central Pacific Hurricane Center | Equator northward, 140–180°W | [48] |
| Western Pacific | Japan Meteorological Agency | Equator – 60°N, 180–100°E | [49] |
| North Indian Ocean | India Meteorological Department | Equator northwards, 100–40°E | [50] |
| Southern Hemisphere | |||
| South-West Indian Ocean |
Météo-France Reunion | Equator – 40°S, African Coast – 90°E | [51] |
| Australian region | Indonesian Meteorology, Climatology, and Geophysical Agency (BMKG) |
Equator – 10°S, 90–141°E | [52] |
| Papua New Guinea National Weather Service | Equator – 10°S, 141–160°E | [52] | |
| Australian Bureau of Meteorology | 10–40°S, 90–160°E | [52] | |
| Southern Pacific | Fiji Meteorological Service | Equator – 25°S, 160°E – 120°W | [52] |
| Meteorological Service of New Zealand | 25–40°S, 160°E – 120°W | [52] | |
The majority of tropical cyclones each year form in one of seven tropical cyclone basins, which are monitored by a variety of meteorological services and warning centres.[4] Ten of these warning centres worldwide are designated as either a Regional Specialized Meteorological Centre or a Tropical Cyclone Warning Centre by the World Meteorological Organisation's tropical cyclone programme.[4] These warning centres issue advisories which provide basic information and cover a systems present, forecast position, movement and intensity, in their designated areas of responsibility.[4] Meteorological services around the world are generally responsible for issuing warnings for their own country, however, there are exceptions, as the United States National Hurricane Center and Fiji Meteorological Service issue alerts, watches and warnings for various island nations in their areas of responsibility.[4][52] The United States Joint Typhoon Warning Center (JTWC) and Fleet Weather Center (FWC) also publicly issue warnings, about tropical cyclones on behalf of the United States Government.[4] The Brazilian Navy Hydrographic Center names South Atlantic tropical cyclones, however the South Atlantic is not a major basin, and not an official basin according to the WMO.[82]
Preparations
This section needs expansion. You can help by . (April 2021) |
Ahead of the formal season starting, people are urged to prepare for the effects of a tropical cyclone by politicians and weather forecasters amongst others. They prepare by determining their risk to the different types of weather, tropical cyclones cause, checking their insurance coverage and emergency supplies, as well as determining where to evacuate to if needed.[83][84][85] When a tropical cyclone develops and is forecast to impact land each member nation of the World Meteorological Organization issues various watches and warnings to cover the expected impacts.[86] However, there are some exceptions with the United States National Hurricane Center and Fiji Meteorological Service responsible for issuing or recommending warnings for other nations in their area of responsibility.[87][88][89]:2–4
Impacts
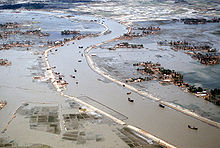
Tropical cyclones out at sea cause large waves, heavy rain, flood and high winds, disrupting international shipping and, at times, causing shipwrecks.[90] Tropical cyclones stir up water, leaving a cool wake behind them, which causes the region to be less favorable for subsequent tropical cyclones.[11] On land, strong winds can damage or destroy vehicles, buildings, bridges, and other outside objects, turning loose debris into deadly flying projectiles. The storm surge, or the increase in sea level due to the cyclone, is typically the worst effect from landfalling tropical cyclones, historically resulting in 90% of tropical cyclone deaths.[91] The broad rotation of a landfalling tropical cyclone, and vertical wind shear at its periphery, spawns tornadoes. Tornadoes can also be spawned as a result of eyewall mesovortices, which persist until landfall.[92]
Over the past two centuries, tropical cyclones have been responsible for the deaths of about 1.9 million people worldwide. Large areas of standing water caused by flooding lead to infection, as well as contributing to mosquito-borne illnesses. Crowded evacuees in shelters increase the risk of disease propagation.[91] Tropical cyclones significantly interrupt infrastructure, leading to power outages, bridge destruction, and the hampering of reconstruction efforts.[91][93] On average, the Gulf and east coasts of the United States suffer approximately US$5 billion (1995 US $) in cyclone damage every year. The majority (83%) of tropical cyclone damage is caused by severe hurricanes, category 3 or greater. However, category 3 or greater hurricanes only account for about one-fifth of cyclones that make landfall every year.[94]
Although cyclones take an enormous toll in lives and personal property, they may be important factors in the precipitation regimes of places they impact, as they may bring much-needed precipitation to otherwise dry regions.[95] Their precipitation may also alleviate drought conditions by restoring soil moisture, though one study focused on the Southeastern United States suggested tropical cyclones did not offer significant drought recovery.[96][97][98] Tropical cyclones also help maintain the global heat balance by moving warm, moist tropical air to the middle latitudes and polar regions,[99] and by regulating the thermohaline circulation through upwelling.[100] The storm surge and winds of hurricanes may be destructive to human-made structures, but they also stir up the waters of coastal estuaries, which are typically important fish breeding locales. Tropical cyclone destruction spurs redevelopment, greatly increasing local property values.[101]
When hurricanes surge upon shore from the ocean, salt is introduced to many freshwater areas and raises the salinity levels too high for some habitats to withstand. Some are able to cope with the salt and recycle it back into the ocean, but others can not release the extra surface water quickly enough or do not have a large enough freshwater source to replace it. Because of this, some species of plants and vegetation die due to the excess salt.[102] In addition, hurricanes can carry toxins and acids onshore when they make landfall. The flood water can pick up the toxins from different spills and contaminate the land that it passes over. These toxins are harmful to the people and animals in the area, as well as the environment around them. The flooding water can also spark oil spills.[103]
Response

Hurricane response is the disaster response after a hurricane. Activities performed by hurricane responders include assessment, restoration, and demolition of buildings; removal of debris and waste; repairs to land-based and maritime infrastructure; and public health services including search and rescue operations.[104] Hurricane response requires coordination between federal, tribal, state, local, and private entities.[105] According to the National Voluntary Organizations Active in Disaster, potential response volunteers should affiliate with established organizations and should not self-deploy, so that proper training and support can be provided to mitigate the danger and stress of response work.[106]
Hurricane responders face many hazards. Hurricane responders may be exposed to chemical and biological contaminants including stored chemicals, sewage, human remains, and mold growth encouraged by flooding,[107][108][109] as well as asbestos and lead that may be present in older buildings.[108][110] Common injuries arise from falls from heights, such as from a ladder or from level surfaces; from electrocution in flooded areas, including from backfeed from portable generators; or from motor vehicle accidents.[107][110][111] Long and irregular shifts may lead to sleep deprivation and fatigue, increasing the risk of injuries, and workers may experience mental stress associated with a traumatic incident. Additionally, heat stress is a concern as workers are often exposed to hot and humid temperatures, wear protective clothing and equipment, and have physically difficult tasks.[107][110]
Climatology and records
Tropical cyclones have occurred around the world for millennia. Reanalyses and research are being undertaken to extend the historical record, through the usage of proxy data such as overwash deposits, beach ridges and historical documents such as diaries.[3] Major tropical cyclones leave traces in overwash records and shell layers in some coastal areas, which have been used to gain insight in hurricane activity over the past thousands of years.[112] Sediment records in Western Australia suggest an intense tropical cyclone in the 4th millennium BC.[3] Proxy records based on paleotempestological research have revealed that major hurricane activity along the Gulf of Mexico coast varies on timescales of centuries to millennia.[113][114] In the year 957, a powerful typhoon struck southern China, killing around 10,000 people due to flooding.[115] The Spanish colonization of Mexico described "tempestades" in 1730,[116] although the official record for Pacific hurricanes only dates to 1949.[117] In the south-west Indian Ocean, the tropical cyclone record goes back to 1848.[118] In 2003, the Atlantic hurricane reanalysis project examined and analyzed the historical record of tropical cyclones in the Atlantic back to 1851, extending the existing database from 1886.[119]
Before satellite imagery became available during the 20th century, many of these systems went undetected unless it impacted land or a ship encountered it by chance.[4] Often in part because of the threat of hurricanes, many coastal regions had sparse population between major ports until the advent of automobile tourism; therefore, the most severe portions of hurricanes striking the coast may have gone unmeasured in some instances. The combined effects of ship destruction and remote landfall severely limit the number of intense hurricanes in the official record before the era of hurricane reconnaissance aircraft and satellite meteorology. Although the record shows a distinct increase in the number and strength of intense hurricanes, therefore, experts regard the early data as suspect.[120] The ability of climatologists to make a long-term analysis of tropical cyclones is limited by the amount of reliable historical data.[121] During the 1940s, routine aircraft reconnaissance started in both the Atlantic and Western Pacific basin during the mid-1940s, which provided ground truth data, however, early flights were only made once or twice a day.[4] Polar-orbiting weather satellites were first launched by the United States National Aeronautics and Space Administration during 1960, but were not declared operational until 1965.[4] However, it took several years for some of the warning centres to take advantage of this new viewing platform and develop the expertise to associate satellite signatures with storm position and intensity.[4]
Each year on average, around 80 to 90 named tropical cyclones form around the world, of which over half develop hurricane-force winds of 65 kn (120 km/h; 75 mph) or more.[4] Worldwide, tropical cyclone activity peaks in late summer, when the difference between temperatures aloft and sea surface temperatures is the greatest. However, each particular basin has its own seasonal patterns. On a worldwide scale, May is the least active month, while September is the most active month. November is the only month in which all the tropical cyclone basins are in season.[122] In the Northern Atlantic Ocean, a distinct cyclone season occurs from June 1 to November 30, sharply peaking from late August through September.[122] The statistical peak of the Atlantic hurricane season is September 10. The Northeast Pacific Ocean has a broader period of activity, but in a similar time frame to the Atlantic.[123] The Northwest Pacific sees tropical cyclones year-round, with a minimum in February and March and a peak in early September.[122] In the North Indian basin, storms are most common from April to December, with peaks in May and November.[122] In the Southern Hemisphere, the tropical cyclone year begins on July 1 and runs all year-round encompassing the tropical cyclone seasons, which run from November 1 until the end of April, with peaks in mid-February to early March.[122][52]
Of various modes of variability in the climate system, El Niño-Southern Oscillation has the largest impact on tropical cyclone activity.[124] Most tropical cyclones form on the side of the subtropical ridge closer to the equator, then move poleward past the ridge axis before recurving into the main belt of the Westerlies.[125] When the subtropical ridge position shifts due to El Niño, so will the preferred tropical cyclone tracks. Areas west of Japan and Korea tend to experience much fewer September–November tropical cyclone impacts during El Niño and neutral years.[126] During La Niña years, the formation of tropical cyclones, along with the subtropical ridge position, shifts westward across the western Pacific Ocean, which increases the landfall threat to China and much greater intensity in the Philippines.[126] The Atlantic Ocean experiences depressed activity due to increased vertical wind shear across the region during El Niño years.[127] Tropical cyclones are further influenced by the , the Quasi-biennial oscillation and the Madden–Julian oscillation.[124][128]
| Season lengths and averages | |||||
|---|---|---|---|---|---|
| Basin | Season start |
Season end |
Tropical cyclones |
Refs | |
| North Atlantic | June 1 | November 30 | 14.4 | [129] | |
| Eastern Pacific | May 15 | November 30 | 16.6 | [129] | |
| Western Pacific | January 1 | December 31 | 26.0 | [129] | |
| North Indian | January 1 | December 31 | 12 | [130] | |
| South-West Indian | July 1 | June 30 | 9.3 | [129][51] | |
| Australian region | November 1 | April 30 | 11.0 | [131] | |
| Southern Pacific | November 1 | April 30 | 7.1 | [132] | |
| Total: | 96.4 | ||||
Climate change
Climate change can affect tropical cyclones in a variety of ways: an intensification of rainfall and wind speed, a decrease in overall frequency, an increase in frequency of very intense storms and a poleward extension of where the cyclones reach maximum intensity are among the possible consequences of human-induced climate change.[133] Tropical cyclones use warm, moist air as their fuel. As climate change is warming ocean temperatures, there is potentially more of this fuel available.[134] Between 1979 and 2017, there was a global increase in the proportion of tropical cyclones of Category 3 and higher on the Saffir–Simpson scale. The trend was most clear in the North Atlantic and in the Southern Indian Ocean. In the North Pacific, tropical cyclones have been moving poleward into colder waters and there was no increase in intensity over this period.[135] With 2 °C warming, a greater percentage (+13%) of tropical cyclones are expected to reach Category 4 and 5 strength.[133] A 2019 study indicates that climate change has been driving the observed trend of rapid intensification of tropical cyclones in the Atlantic basin. Rapidly intensifying cyclones are hard to forecast and therefore pose additional risk to coastal communities.[136]
Warmer air can hold more water vapor: the theoretical maximum water vapor content is given by the Clausius–Clapeyron relation, which yields ≈7% increase in water vapor in the atmosphere per 1 °C warming.[137][138] All models that were assessed in a 2019 review paper show a future increase of rainfall rates.[133] Additional sea level rise will increase storm surge levels.[139][140] It is plausible that extreme wind waves see an increase as a consequence of changes in tropical cyclones, further exacerbating storm surge dangers to coastal communities.[141] The compounding effects from floods, storm surge, and terrestrial flooding (rivers) are projected to increase due to global warming.[140]
There is currently no consensus on how climate change will affect the overall frequency of tropical cyclones.[133] A majority of climate models show a decreased frequency in future projections.[141] For instance, a 2020 paper comparing nine high-resolution climate models found robust decreases in frequency in the Southern Indian Ocean and the Southern Hemisphere more generally, while finding mixed signals for Northern Hemisphere tropical cyclones.[142] Observations have shown little change in the overall frequency of tropical cyclones worldwide,[143] with increased frequency in the North Atlantic and central Pacific, and significant decreases in the southern Indian Ocean and western North Pacific.[144] There has been a poleward expansion of the latitude at which the maximum intensity of tropical cyclones occurs, which may be associated with climate change.[145] In the North Pacific, there may also have been an eastward expansion.[139] Between 1949 and 2016, there was a slowdown in tropical cyclone translation speeds. It is unclear still to what extent this can be attributed to climate change: climate models do not all show this feature.[141]
Observation and forecasting
Observation


Intense tropical cyclones pose a particular observation challenge, as they are a dangerous oceanic phenomenon, and weather stations, being relatively sparse, are rarely available on the site of the storm itself. In general, surface observations are available only if the storm is passing over an island or a coastal area, or if there is a nearby ship. Real-time measurements are usually taken in the periphery of the cyclone, where conditions are less catastrophic and its true strength cannot be evaluated. For this reason, there are teams of meteorologists that move into the path of tropical cyclones to help evaluate their strength at the point of landfall.[146]
Tropical cyclones are tracked by weather satellites capturing visible and infrared images from space, usually at half-hour to quarter-hour intervals. As a storm approaches land, it can be observed by land-based Doppler weather radar. Radar plays a crucial role around landfall by showing a storm's location and intensity every several minutes.[147] Other satellites provide information from the perturbations of GPS signals, providing thousands of snapshots per day and capturing atmospheric temperature, pressure, and moisture content.[148]
In situ measurements, in real-time, can be taken by sending specially equipped reconnaissance flights into the cyclone. In the Atlantic basin, these flights are regularly flown by United States government hurricane hunters.[149] These aircraft fly directly into the cyclone and take direct and remote-sensing measurements. The aircraft also launch GPS dropsondes inside the cyclone. These sondes measure temperature, humidity, pressure, and especially winds between flight level and the ocean's surface. A new era in hurricane observation began when a remotely piloted Aerosonde, a small drone aircraft, was flown through Tropical Storm Ophelia as it passed Virginia's Eastern Shore during the 2005 hurricane season. A similar mission was also completed successfully in the western Pacific Ocean.[150]

Forecasting
High-speed computers and sophisticated simulation software allow forecasters to produce computer models that predict tropical cyclone tracks based on the future position and strength of high- and low-pressure systems. Combining forecast models with increased understanding of the forces that act on tropical cyclones, as well as with a wealth of data from Earth-orbiting satellites and other sensors, scientists have increased the accuracy of track forecasts over recent decades.[151] However, scientists are not as skillful at predicting the intensity of tropical cyclones.[152] The lack of improvement in intensity forecasting is attributed to the complexity of tropical systems and an incomplete understanding of factors that affect their development. New tropical cyclone position and forecast information is available at least every six hours from the various warning centers.[153][154][155][156][157]
Related cyclone types
In addition to tropical cyclones, there are two other classes of cyclones within the spectrum of cyclone types. These kinds of cyclones, known as extratropical cyclones and subtropical cyclones, can be stages a tropical cyclone passes through during its formation or dissipation.[158] An extratropical cyclone is a storm that derives energy from horizontal temperature differences, which are typical in higher latitudes. A tropical cyclone can become extratropical as it moves toward higher latitudes if its energy source changes from heat released by condensation to differences in temperature between air masses; although not as frequently, an extratropical cyclone can transform into a subtropical storm, and from there into a tropical cyclone.[159] From space, extratropical storms have a characteristic "comma-shaped" cloud pattern.[160] Extratropical cyclones can also be dangerous when their low-pressure centers cause powerful winds and high seas.[161]
A subtropical cyclone is a weather system that has some characteristics of a tropical cyclone and some characteristics of an extratropical cyclone. They can form in a wide band of latitudes, from the equator to 50°. Although subtropical storms rarely have hurricane-force winds, they may become tropical in nature as their cores warm.[162]
Notable tropical cyclones
Tropical cyclones that cause extreme destruction are rare, although when they occur, they can cause great amounts of damage or thousands of fatalities.
The 1970 Bhola cyclone is considered to be the deadliest tropical cyclone on record, which killed around 300,000 people, after striking the densely populated Ganges Delta region of Bangladesh on November 13, 1970.[163] Its powerful storm surge was responsible for the high death toll.[164] The North Indian cyclone basin has historically been the deadliest basin.[91][165] Elsewhere, Typhoon Nina killed nearly 100,000 in China in 1975 due to a 100-year flood that caused 62 dams including the Banqiao Dam to fail.[166] The Great Hurricane of 1780 is the deadliest North Atlantic hurricane on record, killing about 22,000 people in the Lesser Antilles.[167] A tropical cyclone does not need to be particularly strong to cause memorable damage, primarily if the deaths are from rainfall or mudslides. Tropical Storm Thelma in November 1991 killed thousands in the Philippines,[168] although the strongest typhoon to ever make landfall on record was Typhoon Haiyan in November 2013, causing widespread devastation in Eastern Visayas, and killing at least 6,300 people in the Philippines alone. In 1982, the unnamed tropical depression that eventually became Hurricane Paul killed around 1,000 people in Central America.[169]
Hurricane Harvey and Hurricane Katrina are estimated to be the costliest tropical cyclones to impact the United States mainland, each causing damage estimated at $125 billion.[170] Harvey killed at least 90 people in August 2017 after making landfall in Texas as a low-end Category 4 hurricane. Hurricane Katrina is estimated as the second-costliest tropical cyclone worldwide,[171] causing $81.2 billion in property damage (2008 USD) alone,[172] with overall damage estimates exceeding $100 billion (2005 USD).[171] Katrina killed at least 1,836 people after striking Louisiana and Mississippi as a major hurricane in August 2005.[172] Hurricane Maria is the third most destructive tropical cyclone in U.S. history, with damage totaling $91.61 billion (2017 USD), and with damage costs at $68.7 billion (2012 USD), Hurricane Sandy is the fourth most destructive tropical cyclone in U.S history. The Galveston Hurricane of 1900 is the deadliest natural disaster in the United States, killing an estimated 6,000 to 12,000 people in Galveston, Texas.[173] Hurricane Mitch caused more than 10,000 fatalities in Central America, making it the second deadliest Atlantic hurricane in history. Hurricane Iniki in 1992 was the most powerful storm to strike Hawaii in recorded history, hitting Kauai as a Category 4 hurricane, killing six people, and causing U.S. $3 billion in damage.[174] Other destructive Eastern Pacific hurricanes include Pauline and Kenna, both causing severe damage after striking Mexico as major hurricanes.[175][176] In March 2004, Cyclone Gafilo struck northeastern Madagascar as a powerful cyclone, killing 74, affecting more than 200,000 and becoming the worst cyclone to affect the nation for more than 20 years.[177]
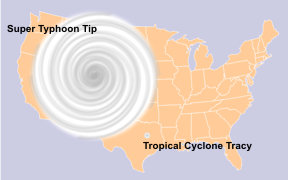
The most intense storm on record is Typhoon Tip in the northwestern Pacific Ocean in 1979, which reached a minimum pressure of 870 hectopascals (25.69 inHg) and maximum sustained wind speeds of 165 knots (85 m/s) or 190 miles per hour (310 km/h).[178] The highest maximum sustained wind speed ever recorded was 185 knots (95 m/s) or 215 miles per hour (346 km/h) in Hurricane Patricia in 2015—the most intense cyclone ever recorded in the Western Hemisphere.[179] Typhoon Nancy in 1961 also had recorded wind speeds of 185 knots (95 m/s) or 215 miles per hour (346 km/h), but recent research indicates that wind speeds from the 1940s to the 1960s were gauged too high, and thus it is no longer considered the storm with the highest wind speed on record.[180] Likewise, a surface-level gust caused by Typhoon Paka on Guam in late 1997 was recorded at 205 knots (105 m/s) or 235 miles per hour (378 km/h). Had it been confirmed, it would be the strongest non-tornadic wind ever recorded on the Earth's surface, but the reading had to be discarded since the anemometer was damaged by the storm.[181] The World Meteorological Organization established Barrow Island (Queensland) as the location of the highest non-tornado related wind gust at 408 kilometres per hour (254 mph)[182] on April 10, 1996, during Severe Tropical Cyclone Olivia.[183]
In addition to being the most intense tropical cyclone on record based on pressure, Tip is the largest cyclone on record, with tropical storm-force winds 2,170 kilometres (1,350 mi) in diameter. The smallest storm on record, Tropical Storm Marco, formed during October 2008 and made landfall in Veracruz. Marco generated tropical storm-force winds only 37 kilometres (23 mi) in diameter. Marco broke the record of 1974's Cyclone Tracy.[184]
Hurricane John is the longest-lasting tropical cyclone on record, lasting 31 days in 1994. Before the advent of satellite imagery in 1961, however, many tropical cyclones were underestimated in their durations.[185] John is also the longest-tracked tropical cyclone in the Northern Hemisphere on record, with a path of 8,250 mi (13,280 km).[186] Cyclone Rewa of the 1993–94 South Pacific and Australian region cyclone seasons had one of the longest tracks observed within the Southern Hemisphere, traveling a distance of over 5,545 mi (8,920 km) during December 1993 and January 1994.[186]
Popular culture
The examples and perspective in this section may not represent a worldwide view of the subject. (April 2021) |
In popular culture, tropical cyclones have made several appearances in different types of media, including films, books, television, music, and electronic games.[187] These media often portray tropical cyclones that are either entirely fictional or based on real events.[187] For example, George Rippey Stewart's Storm, a best-seller published in 1941, is thought to have influenced meteorologists on their decision to assign female names to Pacific tropical cyclones.[81] Another example is the hurricane in the 2000 film The Perfect Storm, which describes the sinking of the Andrea Gail by the 1991 Perfect Storm.[188] Hurricanes have been featured in parts of the plots of series such as The Simpsons, Invasion, Family Guy, Seinfeld, Dawson's Creek, Burn Notice and CSI: Miami.[187][189][190][191][192] The 2004 film The Day After Tomorrow includes several mentions of actual tropical cyclones and features fantastical "hurricane-like", albeit non-tropical, Arctic storms.[193][194]
See also
- Tropical meteorology
- Disaster preparedness
- Extraterrestrial vortex
- Space hurricane
- Hurricane Alley
- Hypercane
- List of wettest tropical cyclones by country
- Outline of tropical cyclones
- Whirlwind
Forecasting and preparation
- Catastrophe modeling
- Tropical cyclone engineering
- Hurricane-proof building
Tropical cyclone seasons
- Tropical cyclones in 2021
- Atlantic hurricane (2021 Atlantic hurricane season)
- Pacific hurricane season (2021 Pacific hurricane season)
- Pacific typhoon season (2021 Pacific typhoon season)
- North Indian Ocean tropical cyclone (2021 North Indian Ocean cyclone season
- South-West Indian Ocean tropical cyclone (2021–22 South-West Indian Ocean cyclone season)
- Australian region tropical cyclone (2021–22 Australian region cyclone season)
- South Pacific tropical cyclone (2021–22 South Pacific cyclone season)
- Mediterranean tropical-like cyclone
- South Atlantic tropical cyclone
References
- ^ Jump up to: a b "Glossary of NHC Terms". United States National Hurricane Center. Archived from the original on February 16, 2021. Retrieved February 18, 2021.
- ^ "Tropical cyclone facts: What is a tropical cyclone?". United Kingdom Met Office. Archived from the original on February 2, 2021. Retrieved February 25, 2021.
- ^ Jump up to: a b c Nott, Jonathan (March 1, 2011). "A 6000 year tropical cyclone record from Western Australia". Quaternary Science Reviews. 30 (5): 713–722. Bibcode:2011QSRv...30..713N. doi:10.1016/j.quascirev.2010.12.004. ISSN 0277-3791. Retrieved March 13, 2021.
- ^ Jump up to: a b c d e f g h i j k l m n o p q Global Guide to Tropical Cyclone Forecasting: 2017 (PDF) (Report). World Meteorological Organization. April 17, 2018. Archived (PDF) from the original on July 14, 2019. Retrieved September 6, 2020.
- ^ Jump up to: a b c d e "Tropical cyclone facts: How do tropical cyclones form?". United Kingdom Met Office. Archived from the original on February 2, 2021. Retrieved March 1, 2021.
- ^ Jump up to: a b National Weather Service (October 19, 2005). "Tropical Cyclone Structure". JetStream – An Online School for Weather. National Oceanic & Atmospheric Administration. Archived from the original on December 7, 2013. Retrieved May 7, 2009.
- ^ Pasch, Richard J.; Eric S. Blake; Hugh D. Cobb III; David P. Roberts (September 28, 2006). "Tropical Cyclone Report: Hurricane Wilma: 15–25 October 2005" (PDF). National Hurricane Center. Retrieved December 14, 2006.
- ^ Jump up to: a b c Annamalai, H.; Slingo, J.M.; Sperber, K.R.; Hodges, K. (1999). "The Mean Evolution and Variability of the Asian Summer Monsoon: Comparison of ECMWF and NCEP–NCAR Reanalyses". Monthly Weather Review. 127 (6): 1157–1186. Bibcode:1999MWRv..127.1157A. doi:10.1175/1520-0493(1999)127<1157:TMEAVO>2.0.CO;2.
- ^ American Meteorological Society. "AMS Glossary: C". Glossary of Meteorology. Allen Press. Archived from the original on January 26, 2011. Retrieved December 14, 2006.
- ^ Atlantic Oceanographic and Hurricane Research Division. "Frequently Asked Questions: What are "concentric eyewall cycles" (or "eyewall replacement cycles") and why do they cause a hurricane's maximum winds to weaken?". National Oceanic and Atmospheric Administration. Archived from the original on December 6, 2006. Retrieved December 14, 2006.
- ^ Jump up to: a b D'Asaro, Eric A. & Black, Peter G. (2006). "J8.4 Turbulence in the Ocean Boundary Layer Below Hurricane Dennis". University of Washington. Archived (PDF) from the original on March 30, 2012. Retrieved February 22, 2008.
- ^ Fedorov, Alexey V.; Brierley, Christopher M.; Emanuel, Kerry (February 2010). "Tropical cyclones and permanent El Niño in the early Pliocene epoch". Nature. 463 (7284): 1066–1070. Bibcode:2010Natur.463.1066F. doi:10.1038/nature08831. hdl:1721.1/63099. ISSN 0028-0836. PMID 20182509. S2CID 4330367.
- ^ Holland, G.J. (1983). "Tropical Cyclone Motion: Environmental Interaction Plus a Beta Effect". Journal of the Atmospheric Sciences. 40 (2): 328–342. Bibcode:1983JAtS...40..328H. doi:10.1175/1520-0469(1983)040<0328:TCMEIP>2.0.CO;2. S2CID 124178238.
- ^ Jump up to: a b c Galarneau, Thomas J.; Davis, Christopher A. (February 1, 2013). "Diagnosing Forecast Errors in Tropical Cyclone Motion". Monthly Weather Review. American Meteorological Society. 141 (2): 405–430. Bibcode:2013MWRv..141..405G. doi:10.1175/MWR-D-12-00071.1.
- ^ Jump up to: a b Atlantic Oceanographic and Meteorological Laboratory, Hurricane Research Division. "Frequently Asked Questions: What determines the movement of tropical cyclones?". National Oceanic and Atmospheric Administration. Archived from the original on June 23, 2012. Retrieved July 25, 2006.
- ^ Jump up to: a b Wu, Chun-Chieh; Emanuel, Kerry A. (January 1, 1995). "Potential vorticity Diagnostics of Hurricane Movement. Part 1: A Case Study of Hurricane Bob (1991)". Monthly Weather Review. American Meteorological Society. 123 (1): 69–92. Bibcode:1995MWRv..123...69W. doi:10.1175/1520-0493(1995)123<0069:PVDOHM>2.0.CO;2.
- ^ Carr, L. E.; Elsberry, Russell L. (February 15, 1990). "Observational Evidence for Predictions of Tropical Cyclone Propagation Relative to Environmental Steering". Journal of the Atmospheric Sciences. American Meteorological Society. 47 (4): 542–546. Bibcode:1990JAtS...47..542C. doi:10.1175/1520-0469(1990)047<0542:OEFPOT>2.0.CO;2.
- ^ Jump up to: a b Velden, Christopher S.; Leslie, Lance M. (June 1, 1991). "The Basic Relationship between Tropical Cyclone Intensity and the Depth of the Environmental Steering Layer in the Australian Region". Weather and Forecasting. American Meteorological Society. 6 (2): 244–253. Bibcode:1991WtFor...6..244V. doi:10.1175/1520-0434(1991)006<0244:TBRBTC>2.0.CO;2.
- ^ Chan, Johnny C.L. (January 2005). "The Physics of Tropical Cyclone Motion". Annual Review of Fluid Mechanics. Annual Reviews. 37 (1): 99–128. Bibcode:2005AnRFM..37...99C. doi:10.1146/annurev.fluid.37.061903.175702.
- ^ Atlantic Oceanographic and Meteorological Laboratory, Hurricane Research Division. "Frequently Asked Questions: What is an easterly wave?". National Oceanic and Atmospheric Administration. Archived from the original on July 18, 2006. Retrieved July 25, 2006.
- ^ Avila, L.A.; Pasch, R.J. (1995). "Atlantic Tropical Systems of 1993". Monthly Weather Review. 123 (3): 887–896. Bibcode:1995MWRv..123..887A. doi:10.1175/1520-0493(1995)123<0887:ATSO>2.0.CO;2.
- ^ DeCaria, Alex (2005). "Lesson 5 – Tropical Cyclones: Climatology". ESCI 344 – Tropical Meteorology. Millersville University. Archived from the original on May 7, 2008. Retrieved February 22, 2008.
- ^ Carr, Lester E.; Elsberry, Russell L. (February 1, 1995). "Monsoonal Interactions Leading to Sudden Tropical Cyclone Track Changes". Monthly Weather Review. American Meteorological Society. 123 (2): 265–290. Bibcode:1995MWRv..123..265C. doi:10.1175/1520-0493(1995)123<0265:MILTST>2.0.CO;2.
- ^ Jump up to: a b Wang, Bin; Elsberry, Russell L.; Yuqing, Wang; Liguang, Wu (1998). "Dynamics in Tropical Cyclone Motion: A Review" (PDF). Chinese Journal of Atmospheric Sciences. Allerton Press. 22 (4): 416–434. Retrieved April 6, 2021 – via University of Hawaii.
- ^ Holland, Greg J. (February 1, 1983). "Tropical Cyclone Motion: Environmental Interaction Plus a Beta Effect". Journal of the Atmospheric Sciences. American Meteorological Society. 40 (2): 328–342. Bibcode:1983JAtS...40..328H. doi:10.1175/1520-0469(1983)040<0328:TCMEIP>2.0.CO;2.
- ^ Fiorino, Michael; Elsberry, Russell L. (April 1, 1989). "Some Aspects of Vortex Structure Related to Tropical Cyclone Motion". Journal of the Atmospheric Sciences. American Meteorological Society. 46 (7): 975–990. Bibcode:1989JAtS...46..975F. doi:10.1175/1520-0469(1989)046<0975:SAOVSR>2.0.CO;2.
- ^ Li, Xiaofan; Wang, Bin (March 1, 1994). "Barotropic Dynamics of the Beta Gyres and Beta Drift". Journal of the Atmospheric Sciences. American Meteorological Society. 51 (5): 746–756. Bibcode:1994JAtS...51..746L. doi:10.1175/1520-0469(1994)051<0746:BDOTBG>2.0.CO;2.
- ^ Willoughby, H. E. (September 1, 1990). "Linear Normal Modes of a Moving, Shallow-Water Barotropic Vortex". Journal of the Atmospheric Sciences. American Meteorological Society. 47 (17): 2141–2148. Bibcode:1990JAtS...47.2141W. doi:10.1175/1520-0469(1990)047<2141:LNMOAM>2.0.CO;2.
- ^ Hill, Kevin A.; Lackmann, Gary M. (October 1, 2009). "Influence of Environmental Humidity on Tropical Cyclone Size". Monthly Weather Review. American Meteorological Society. 137 (10): 3294–3315. Bibcode:2009MWRv..137.3294H. doi:10.1175/2009MWR2679.1.
- ^ Sun, Yuan; Zhong, Zhong; Yi, Lan; Li, Tim; Chen, Ming; Wan, Hongchao; Wang, Yuxing; Zhong, Kai (November 27, 2015). "Dependence of the relationship between the tropical cyclone track and western Pacific subtropical high intensity on initial storm size: A numerical investigation: SENSITIVITY OF TC AND WPSH TO STORM SIZE". Journal of Geophysical Research: Atmospheres. John Wiley & Sons. 120 (22): 11, 451–11, 467. doi:10.1002/2015JD023716.
- ^ "Fujiwhara effect describes a stormy waltz". USA Today. November 9, 2007. Archived from the original on November 5, 2012. Retrieved February 21, 2008.
- ^ "Section 2: Tropical Cyclone Motion Terminology". United States Naval Research Laboratory. April 10, 2007. Archived from the original on June 23, 2012. Retrieved May 7, 2009.
- ^ Powell, Jeff; et al. (May 2007). "Hurricane Ioke: 20–27 August 2006". 2006 Tropical Cyclones Central North Pacific. Central Pacific Hurricane Center. Archived from the original on March 6, 2016. Retrieved June 9, 2007.
- ^ "Global Guide to Tropical Cyclone Forecasting: chapter 2: Tropical Cyclone Structure". Bureau of Meteorology. May 7, 2009. Archived from the original on June 1, 2011. Retrieved May 6, 2009.
- ^ Jump up to: a b Chavas, D.R.; Emanuel, K.A. (2010). "A QuikSCAT climatology of tropical cyclone size". Geophysical Research Letters. 37 (18): n/a. Bibcode:2010GeoRL..3718816C. doi:10.1029/2010GL044558. hdl:1721.1/64407.
- ^ Jump up to: a b "Q: What is the average size of a tropical cyclone?". Joint Typhoon Warning Center. 2009. Archived from the original on October 4, 2013. Retrieved May 7, 2009.
- ^ Jump up to: a b Merrill, Robert T (1984). "A comparison of Large and Small Tropical cyclones". Monthly Weather Review. 112 (7): 1408–1418. Bibcode:1984MWRv..112.1408M. doi:10.1175/1520-0493(1984)112<1408:ACOLAS>2.0.CO;2. hdl:10217/200. S2CID 123276607.
- ^ "Glossary of NHC Terms". United States National Oceanic and Atmospheric Administration's National Hurricane Center. Archived from the original on September 12, 2019. Retrieved June 2, 2019.
- ^ Diana Engle. "Hurricane Structure and Energetics". Data Discovery Hurricane Science Center. Archived from the original on May 27, 2008. Retrieved October 26, 2008.
- ^ Brad Reinhart; Daniel Brown (October 21, 2020). "Hurricane Epsilon Discussion Number 12". nhc.noaa.gov. Miami, Florida: National Hurricane Center. Retrieved February 4, 2021.
- ^ Cappucci, Matthew (October 21, 2020). "Epsilon shatters records as it rapidly intensifies into major hurricane near Bermuda". The Washington Post. Retrieved February 4, 2021.
- ^ Lam, Linda (September 4, 2019). "Why the Eastern Caribbean Sea Can Be a 'Hurricane Graveyard'". The Weather Channel. TWC Product and Technology. Retrieved April 6, 2021.
- ^ Sadler, James C.; Kilonsky, Bernard J. (May 1977). The Regeneration of South China Sea Tropical Cyclones in the Bay of Bengal (PDF) (Report). Monterey, California: Naval Environmental Prediction Research Facility. Retrieved April 6, 2021 – via Defense Technical Information Center.
- ^ Jump up to: a b c d "Anatomy and Life Cycle of a Storm: What Is the Life Cycle of a Hurricane and How Do They Move?". United States Hurricane Research Division. 2020. Archived from the original on February 17, 2021. Retrieved February 17, 2021.
- ^ Chang, Chih-Pei (2004). East Asian Monsoon. World Scientific. ISBN 978-981-238-769-1. OCLC 61353183.
- ^ United States Naval Research Laboratory (September 23, 1999). "Tropical Cyclone Intensity Terminology". Tropical Cyclone Forecasters' Reference Guide. Archived from the original on June 23, 2012. Retrieved November 30, 2006.
- ^ Jump up to: a b c "Attempts to Stop a Hurricane in its Track: What Else has been Considered to Stop a Hurricane?". United States Hurricane Research Division. 2020. Archived from the original on February 17, 2021. Retrieved February 17, 2021.
- ^ Jump up to: a b c d e f RA IV Hurricane Committee. Regional Association IV Hurricane Operational Plan 2019 (PDF) (Report). World Meteorological Organization. Retrieved July 2, 2019.
- ^ Jump up to: a b c WMO/ESCP Typhoon Committee (March 13, 2015). Typhoon Committee Operational Manual Meteorological Component 2015 (PDF) (Report No. TCP-23). World Meteorological Organization. pp. 40–41. Archived (PDF) from the original on September 4, 2015. Retrieved March 28, 2015.
- ^ Jump up to: a b c d WMO/ESCAP Panel on Tropical Cyclones (November 2, 2018). Tropical Cyclone Operational Plan for the Bay of Bengal and the Arabian Sea 2018 (PDF) (Report No. TCP-21). World Meteorological Organization. pp. 11–12. Retrieved July 2, 2019.
- ^ Jump up to: a b c d e RA I Tropical Cyclone Committee (November 9, 2012). Tropical Cyclone Operational Plan for the South-West Indian Ocean: 2012 (PDF) (Report No. TCP-12). World Meteorological Organization. pp. 11–14. Archived (PDF) from the original on March 29, 2015. Retrieved March 29, 2015.
- ^ Jump up to: a b c d e f g h i j k l RA V Tropical Cyclone Committee (October 8, 2020). Tropical Cyclone Operational Plan for the South-East Indian Ocean and the Southern Pacific Ocean 2020 (PDF) (Report). World Meteorological Organization. pp. I-4–II-9 (9–21). Retrieved October 10, 2020.
- ^ Tory, K. J.; Dare, R. A. (October 15, 2015). "Sea Surface Temperature Thresholds for Tropical Cyclone Formation". Journal of Climate. American Meteorological Society. 28 (20): 8171. Bibcode:2015JCli...28.8171T. doi:10.1175/JCLI-D-14-00637.1. Retrieved April 28, 2021.
- ^ Lavender, Sally; Hoeke, Ron; Abbs, Deborah (March 9, 2018). "The influence of sea surface temperature on the intensity and associated storm surge of tropical cyclone Yasi: a sensitivity study". National Hazards and Earth System Sciences. Copernicus Publications. 18 (3): 795–805. Bibcode:2018NHESS..18..795L. doi:10.5194/nhess-18-795-2018. Retrieved April 28, 2021.
- ^ Xu, Jing; Wang, Yuqing (April 1, 2018). "Dependence of Tropical Cyclone Intensification Rate on Sea SurfaceTemperature, Storm Intensity, and Size in the Western North Pacific". Weather and Forecasting. American Meteorological Society. 33 (2): 523–527. Bibcode:2018WtFor..33..523X. doi:10.1175/WAF-D-17-0095.1. Retrieved April 28, 2021.
- ^ Brown, Daniel (April 20, 2017). "Tropical Cyclone Intensity Forecasting: Still a Challenging Proposition" (PDF). National Hurricane Center. p. 7. Retrieved April 27, 2021.
- ^ Jump up to: a b Chih, Cheng-Hsiang; Wu, Chun-Chieh (February 1, 2020). "Exploratory Analysis of Upper-Ocean Heat Content and Sea Surface Temperature Underlying Tropical Cyclone Rapid Intensification in the Western North Pacific". Journal of Climate. 33 (3): 1031–1033. Bibcode:2020JCli...33.1031C. doi:10.1175/JCLI-D-19-0305.1. Retrieved April 27, 2021.
- ^ Lin, I.; Goni, Gustavo; Knaff, John; Forbes, Cristina; Ali, M. (May 31, 2012). "Ocean heat content for tropical cyclone intensity forecasting and its impact on storm surge" (PDF). Journal of the International Society for the Prevention and Mitigation of Natural Hazards. Springer Science+Business Media. 66 (3): 3–4. doi:10.1007/s11069-012-0214-5. ISSN 0921-030X. S2CID 9130662. Retrieved April 27, 2021.
- ^ Stovern, Diana; Ritchie, Elizabeth. "MODELING THE EFFECT OF VERTICAL WIND SHEAR ON TROPICAL CYCLONE SIZE AND STRUCTURE" (PDF). American Meteorological Society: 1–2. Retrieved April 28, 2021. Cite journal requires
|journal=(help) - ^ Wingo, Matthew; Cecil, Daniel (March 1, 2010). "Effects of Vertical Wind Shear on Tropical Cyclone Precipitation". Monthly Weather Review. American Meteorological Society. 138 (3): 645–662. Bibcode:2010MWRv..138..645W. doi:10.1175/2009MWR2921.1. Retrieved April 28, 2021.
- ^ Liang, Xiuji; Li, Qingqing (March 1, 2021). "Revisiting the response of western North Pacific tropical cyclone intensity change to vertical wind shear in different directions". Atmospheric and Oceanic Science Letters. Science Direct. 14 (3): 100041. doi:10.1016/j.aosl.2021.100041.
- ^ Carrasco, Cristina; Landsea, Christopher; Lin, Yuh-Lang (June 1, 2014). "The Influence of Tropical Cyclone Size on Its Intensification". Weather Forecasting. American Meteorological Society. 29 (3): 582–590. Bibcode:2014WtFor..29..582C. doi:10.1175/WAF-D-13-00092.1. Retrieved May 1, 2021.
- ^ Knaff, John; Longmore, Scott; DeMaria, Robert; Molenar, Debra (February 1, 2015). "Improved Tropical-Cyclone Flight-Level Wind Estimates Using RoutineInfrared Satellite Reconnaissance". Journal of Applied Meteorology and Climatology. American Meteorological Society. 54 (2): 464. Bibcode:2015JApMC..54..463K. doi:10.1175/JAMC-D-14-0112.1. Retrieved April 23, 2021.
- ^ Knaff, John; Reed, Kevin; Chavas, Daniel (November 8, 2017). "Physical understanding of the tropical cyclone wind-pressure relationship". Nature Communications. 8 (1360): 1360. Bibcode:2017NatCo...8.1360C. doi:10.1038/s41467-017-01546-9. PMC 5678138. PMID 29118342.
- ^ Jump up to: a b Kueh, Mien-Tze (May 16, 2012). "Multiformity of the tropical cyclone wind–pressure relationship in the western North Pacific: discrepancies among four best-track archives". Environmental Research Letters. IOP Publishing. 7 (2): 2–6. Bibcode:2012ERL.....7b4015K. doi:10.1088/1748-9326/7/2/024015.
- ^ Meissner, Thomas; Ricciardulli, L.; Wentz, F.; Sampson, C. (April 18, 2018). "Intensity and Size of Strong Tropical Cyclones in 2017 from NASA's SMAP L-Band Radiometer". American Meteorological Society. Retrieved April 21, 2021. Cite journal requires
|journal=(help) - ^ DeMaria, Mark; Knaff, John; Zehr, Raymond (2013). Satellite-based Applications on Climate Change (PDF). Springer. pp. 152–154. Retrieved April 21, 2021.
- ^ Olander, Timothy; Veldan, Christopher (August 1, 2019). "The Advanced Dvorak Technique (ADT) for Estimating Tropical Cyclone Intensity: Update and New Capabilities". American Meteorological Society. 34 (4): 905–907. Bibcode:2019WtFor..34..905O. doi:10.1175/WAF-D-19-0007.1. Retrieved April 21, 2021.
- ^ Velden, Christopher; Herndon, Derrick (July 21, 2020). "A Consensus Approach for Estimating Tropical Cyclone Intensity from Meteorological Satellites: SATCON". American Meteorological Society. 35 (4): 1645–1650. Bibcode:2020WtFor..35.1645V. doi:10.1175/WAF-D-20-0015.1. Retrieved April 21, 2021.
- ^ Chen, Buo-Fu; Chen, Boyo; Lin, Hsuan-Tien; Elsberry, Russell (April 2019). "Estimating tropical cyclone intensity by satellite imagery utilizing convolutional neural networks". American Meteorological Society. 34 (2): 448. Bibcode:2019WtFor..34..447C. doi:10.1175/WAF-D-18-0136.1. Retrieved April 21, 2021.
- ^ Jump up to: a b Office of the Federal Coordinator for Meteorological Services and Supporting Research (May 2017). National Hurricane Operations Plan (PDF) (Report). National Oceanic and Atmospheric Administration. pp. 26–28. Retrieved October 14, 2018.
- ^ United States Naval Research Laboratory, Marine Meteorology Division (June 8, 2010). "Best Track/Objective Aid/Wind Radii Format". Monterey: United States Navy. Retrieved October 15, 2018.
- ^ "Tropical Cyclone Names". Met Office (United Kingdom Meteorological Office). Retrieved October 17, 2018.
- ^ "RSMC Tokyo - Typhoon Center". Japan Meteorological Agency. Retrieved October 19, 2018.
- ^ "過去の台風資料" (in Japanese). Japan Meteorological Agency. Retrieved October 19, 2018.
- ^ "Saisons cycloniques archivées" (in French). Météo-France La Réunion.
- ^ Jump up to: a b "Monthly Global Tropical Cyclone Summary March 2004". Australia Severe Weather.
- ^ "Rare Tropical Cyclone Forms Off Brazil". EarthWeek. Retrieved October 18, 2018.
- ^ "Observed and forecast tracks: southern hemisphere 2016-17". Met Office (United Kingdom Meteorological Office). Retrieved October 17, 2018.
- ^ Jump up to: a b c d e f Smith, Ray (1990). "What's in a Name?" (PDF). Weather and Climate. The Meteorological Society of New Zealand. 10 (1): 24–26. doi:10.2307/44279572. JSTOR 44279572. S2CID 201717866. Archived from the original (PDF) on November 29, 2014. Retrieved August 25, 2014.
- ^ Jump up to: a b c d e f Dorst, Neal M (October 23, 2012). "They Called the Wind Mahina: The History of Naming Cyclones". Hurricane Research Division, Atlantic Oceanographic and Meteorological Laboratory. National Oceanic and Atmospheric Administration. p. Slides 8–72.
- ^ "Normas Da Autoridade Marítima Para As Atividades De Meteorologia Marítima" (PDF) (in Portuguese). Brazilian Navy. 2011. Archived from the original (PDF) on February 6, 2015. Retrieved October 5, 2018.
- ^ "Hurricane Seasonal Preparedness Digital Toolkit". Ready.gov. February 18, 2021. Retrieved April 6, 2021.
- ^ Gray, Briony; Weal, Mark; Martin, David (2019). The Role of Social Networking in Small Island Communities: Lessons from the 2017 Atlantic Hurricane Season. 52nd Hawaii International Conference on System Sciences. University of Hawaii. doi:10.24251/HICSS.2019.338.
- ^ Morrissey, Shirley A.; Reser, Joseph P. (May 1, 2003). "Evaluating the Effectiveness of Psychological Preparedness Advice in Community Cyclone Preparedness Materials". The Australian Journal of Emergency Management. 18 (2): 46–61. Retrieved April 6, 2021.
- ^ "Tropical Cyclones". World Meteorological Organization. April 8, 2020. Retrieved April 6, 2021.
- ^ "Fiji Meteorological Services". Ministry of Infrastructure & Meteorological Services. Ministry of Infrastructure & Transport. Retrieved April 6, 2021.
- ^ "About the National Hurricane Center". Miami, Florida: National Hurricane Center. Retrieved April 6, 2021.
- ^ Regional Association IV – Hurricane Operational Plan for NOrth America, Central America and the Caribbean (PDF). World Meteorological Organization. 2017. ISBN 9789263111630. Retrieved April 6, 2021.
- ^ Roth, David & Cobb, Hugh (2001). "Eighteenth Century Virginia Hurricanes". NOAA. Archived from the original on May 1, 2013. Retrieved February 24, 2007.
- ^ Jump up to: a b c d Shultz, J.M.; Russell, J.; Espinel, Z. (2005). "Epidemiology of Tropical Cyclones: The Dynamics of Disaster, Disease, and Development". Epidemiologic Reviews. 27: 21–35. doi:10.1093/epirev/mxi011. PMID 15958424.
- ^ Atlantic Oceanographic and Meteorological Laboratory, Hurricane Research Division. "Frequently Asked Questions: Are TC tornadoes weaker than midlatitude tornadoes?". National Oceanic and Atmospheric Administration. Archived from the original on September 14, 2009. Retrieved July 25, 2006.
- ^ Staff Writer (August 30, 2005). "Hurricane Katrina Situation Report #11" (PDF). Office of Electricity Delivery and Energy Reliability (OE) United States Department of Energy. Archived from the original (PDF) on November 8, 2006. Retrieved February 24, 2007.
- ^ Burroughs, William James (2007). Climate change : a multidisciplinary approach (2nd ed.). Cambridge: Cambridge University Press. ISBN 978-0-521-87015-3.
- ^ National Oceanic and Atmospheric Administration. 2005 Tropical Eastern North Pacific Hurricane Outlook. Archived May 28, 2015, at WebCite. Retrieved May 2, 2006.
- ^ "Summer tropical storms don't fix drought conditions". ScienceDaily. May 27, 2015. Retrieved April 10, 2021.
- ^ Yoo, Jiyoung; Kwon, Hyun-Han; So, Byung-Jin; Rajagopalan, Balaji; Kim, Tae-Woong (April 28, 2015). "Identifying the role of typhoons as drought busters in South Korea based on hidden Markov chain models: ROLE OF TYPHOONS AS DROUGHT BUSTERS". Geophysical Research Letters. 42 (8): 2797–2804. doi:10.1002/2015GL063753.
- ^ Kam, Jonghun; Sheffield, Justin; Yuan, Xing; Wood, Eric F. (May 15, 2013). "The Influence of Atlantic Tropical Cyclones on Drought over the Eastern United States (1980–2007)". Journal of Climate. American Meteorological Society. 26 (10): 3067–3086. Bibcode:2013JCli...26.3067K. doi:10.1175/JCLI-D-12-00244.1.
- ^ National Weather Service (October 19, 2005). "Tropical Cyclone Introduction". JetStream – An Online School for Weather. National Oceanic & Atmospheric Administration. Archived from the original on June 22, 2012. Retrieved September 7, 2010.
- ^ Emanuel, Kerry (July 2001). "Contribution of tropical cyclones to meridional heat transport by the oceans". Journal of Geophysical Research. 106 (D14): 14771–14781. Bibcode:2001JGR...10614771E. doi:10.1029/2000JD900641.
- ^ Christopherson, Robert W. (1992). Geosystems: An Introduction to Physical Geography. New York: Macmillan Publishing Company. pp. 222–224. ISBN 978-0-02-322443-0.
- ^ Doyle, Thomas (2005). "Wind damage and Salinity Effects of Hurricanes Katrina and Rita on Coastal Baldcypress Forests of Louisiana" (PDF). Archived (PDF) from the original on March 4, 2016. Retrieved February 13, 2014.
- ^ Cappielo, Dina (2005). "Spills from hurricanes stain coast With gallery". Houston Chronicle. Archived from the original on April 25, 2014. Retrieved February 12, 2014.
- ^ "OSHA's Hazard Exposure and Risk Assessment Matrix for Hurricane Response and Recovery Work: List of Activity Sheets". U.S. Occupational Safety and Health Administration. 2005. Archived from the original on September 29, 2018. Retrieved September 25, 2018.
- ^ "Before You Begin – The Incident Command System (ICS)". American Industrial Hygiene Association. Archived from the original on September 29, 2018. Retrieved September 26, 2018.
- ^ "Volunteer". National Voluntary Organizations Active in Disaster. Archived from the original on September 29, 2018. Retrieved September 25, 2018.
- ^ Jump up to: a b c "Hurricane Key Messages for Employers, Workers and Volunteers". U.S. National Institute for Occupational Safety and Health. 2017. Archived from the original on November 24, 2018. Retrieved September 24, 2018.
- ^ Jump up to: a b "Hazardous Materials and Conditions". American Industrial Hygiene Association. Archived from the original on September 29, 2018. Retrieved September 26, 2018.
- ^ "Mold and Other Microbial Growth". American Industrial Hygiene Association. Archived from the original on September 29, 2018. Retrieved September 26, 2018.
- ^ Jump up to: a b c "OSHA's Hazard Exposure and Risk Assessment Matrix for Hurricane Response and Recovery Work: Recommendations for General Hazards Commonly Encountered during Hurricane Response and Recovery Operations". U.S. Occupational Safety and Health Administration. 2005. Archived from the original on September 29, 2018. Retrieved September 25, 2018.
- ^ "Electrical Hazards". American Industrial Hygiene Association. Archived from the original on September 29, 2018. Retrieved September 26, 2018.
- ^ Muller, Joanne; Collins, Jennifer M.; Gibson, Samantha; Paxton, Leilani (2017), Collins, Jennifer M.; Walsh, Kevin (eds.), "Recent Advances in the Emerging Field of Paleotempestology", Hurricanes and Climate Change: Volume 3, Cham: Springer International Publishing, pp. 1–33, doi:10.1007/978-3-319-47594-3_1, ISBN 978-3-319-47594-3
- ^ Liu, Kam-biu (1999). Millennial-scale variability in catastrophic hurricane landfalls along the Gulf of Mexico coast. 23rd Conference on Hurricanes and Tropical Meteorology. Dallas, TX: American Meteorological Society. pp. 374–377.
- ^ Liu, Kam-biu; Fearn, Miriam L. (2000). "Reconstruction of Prehistoric Landfall Frequencies of Catastrophic Hurricanes in Northwestern Florida from Lake Sediment Records". Quaternary Research. 54 (2): 238–245. Bibcode:2000QuRes..54..238L. doi:10.1006/qres.2000.2166. S2CID 140723229.
- ^ G. Huang; W.W. S. Yim (January 2001). "Reconstruction of an 8,000-year record of typhoons in the Pearl River estuary, China" (PDF). University of Hong Kong. Retrieved April 2, 2021. Cite journal requires
|journal=(help) - ^ Arnold Court (1980). Tropical Cyclone Effects on California. Northridge, California: California State University. pp. 2, 4, 6, 8, 34. Retrieved February 2, 2012.
- ^ "Atlantic hurricane best track (HURDAT version 2)" (Database). United States National Hurricane Center. May 25, 2020.
- ^ Philippe Caroff; et al. (June 2011). Operational procedures of TC satellite analysis at RSMC La Reunion (PDF) (Report). World Meteorological Organization. Retrieved April 22, 2013.
- ^ Christopher W. Landsea; et al. "Documentation for 1851-1910 Alterations and Additions to the HURDAT Database". The Atlantic Hurricane Database Re-analysis Project. Hurricane Research Division.
- ^ Neumann, Charles J. "1.3: A Global Climatology". Global Guide to Tropical Cyclone Forecasting. Bureau of Meteorology. Archived from the original on June 1, 2011. Retrieved November 30, 2006.
- ^ Knutson, Thomas; Camargo, Suzana; Chan, Johnny; Emanuel, Kerry; Ho, Chang-Hoi; Kossin, James; Mohapatra, Mrutyunjay; Satoh, Masaki; Sugi, Masato; Walsh, Kevin; Wu, Liguang (October 1, 2019). "TROPICAL CYCLONES AND CLIMATE CHANGE ASSESSMENT Part I: Detection and Attribution". American Meteorological Society. 100 (10): 1988. Bibcode:2019BAMS..100.1987K. doi:10.1175/BAMS-D-18-0189.1. hdl:1721.1/125577. Retrieved April 17, 2021.
- ^ Jump up to: a b c d e Atlantic Oceanographic and Meteorological Laboratory, Hurricane Research Division. "Frequently Asked Questions: When is hurricane season?". National Oceanic and Atmospheric Administration. Archived from the original on May 5, 2009. Retrieved July 25, 2006.
- ^ McAdie, Colin (May 10, 2007). "Tropical Cyclone Climatology". National Hurricane Center. Archived from the original on March 21, 2015. Retrieved June 9, 2007.
- ^ Jump up to: a b Ramsay, Hamish (2017). "The Global Climatology of Tropical Cyclones". Oxford Research Encyclopedia of Natural Hazard Science. Oxford University Press. doi:10.1093/acrefore/9780199389407.013.79. ISBN 9780199389407.
- ^ Joint Typhoon Warning Center (2006). "3.3 JTWC Forecasting Philosophies" (PDF). United States Navy. Archived (PDF) from the original on November 29, 2007. Retrieved February 11, 2007.
- ^ Jump up to: a b Wu, M.C.; Chang, W.L.; Leung, W.M. (2004). "Impacts of El Niño–Southern Oscillation Events on Tropical Cyclone Landfalling Activity in the Western North Pacific". Journal of Climate. 17 (6): 1419–1428. Bibcode:2004JCli...17.1419W. CiteSeerX 10.1.1.461.2391. doi:10.1175/1520-0442(2004)017<1419:IOENOE>2.0.CO;2.
- ^ Klotzbach, Philip J. (2011). "El Niño–Southern Oscillation's Impact on Atlantic Basin Hurricanes and U.S. Landfalls". Journal of Climate. 24 (4): 1252–1263. Bibcode:2011JCli...24.1252K. doi:10.1175/2010JCLI3799.1. ISSN 0894-8755.
- ^ Camargo, Suzana J.; Sobel, Adam H.; Barnston, Anthony G.; Klotzbach, Philip J. (2010), "The Influence of Natural Climate Variability on Tropical Cyclones, and Seasonal Forecasts of Tropical Cyclone Activity", Global Perspectives on Tropical Cyclones, World Scientific Series on Asia-Pacific Weather and Climate, WORLD SCIENTIFIC, 4, pp. 325–360, doi:10.1142/9789814293488_0011, ISBN 978-981-4293-47-1
- ^ Jump up to: a b c d Hurricane Research Division. "Frequently Asked Questions: What are the average, most, and least tropical cyclones occurring in each basin?". National Oceanic and Atmospheric Administration's Atlantic Oceanographic and Meteorological Laboratory. Retrieved December 5, 2012.
- ^ http://www.rsmcnewdelhi.imd.gov.in/images/pdf/publications/annual-rsmc-report/rsmc-2018.pdf
- ^ "Australian Tropical Cyclone Outlook for 2019 to 2020". Australian Bureau of Meteorology. October 11, 2019. Archived from the original on October 14, 2019. Retrieved October 14, 2019.
- ^ 2019–20 Tropical Cyclone Season Outlook [in the] Regional Specialised Meteorological Centre Nadi – Tropical Cyclone Centre (RSMC Nadi – TCC) Area of Responsibility (AOR) (PDF) (Report). Fiji Meteorological Service. October 11, 2019. Archived (PDF) from the original on October 11, 2019. Retrieved October 11, 2019.
- ^ Jump up to: a b c d Knutson, Thomas; Camargo, Suzana J.; Chan, Johnny C. L.; Emanuel, Kerry; Ho, Chang-Hoi; Kossin, James; Mohapatra, Mrutyunjay; Satoh, Masaki; Sugi, Masato; Walsh, Kevin; Wu, Liguang (August 6, 2019). "Tropical Cyclones and Climate Change Assessment: Part II. Projected Response to Anthropogenic Warming". Bulletin of the American Meteorological Society. 101 (3): BAMS–D–18–0194.1. doi:10.1175/BAMS-D-18-0194.1. ISSN 0003-0007.
- ^ "Major tropical cyclones have become '15% more likely' over past 40 years". Carbon Brief. May 18, 2020. Retrieved August 31, 2020.
- ^ Kossin, James P.; Knapp, Kenneth R.; Olander, Timothy L.; Velden, Christopher S. (May 18, 2020). "Global increase in major tropical cyclone exceedance probability over the past four decades" (PDF). Proceedings of the National Academy of Sciences. 117 (22): 11975–11980. doi:10.1073/pnas.1920849117. ISSN 0027-8424. PMC 7275711. PMID 32424081.
- ^ Collins, M.; Sutherland, M.; Bouwer, L.; Cheong, S.-M.; et al. (2019). "Chapter 6: Extremes, Abrupt Changes and Managing Risks" (PDF). IPCC Special Report on the Ocean and Cryosphere in a Changing Climate. p. 602.
- ^ Thomas R. Knutson; Joseph J. Sirutis; Ming Zhao (2015). "Global Projections of Intense Tropical Cyclone Activity for the Late Twenty-First Century from Dynamical Downscaling of CMIP5/RCP4.5 Scenarios". Journal of Climate. 28 (18): 7203–7224. Bibcode:2015JCli...28.7203K. doi:10.1175/JCLI-D-15-0129.1.
- ^ Knutson; et al. (2013). "Dynamical Downscaling Projections of Late 21st Century Atlantic Hurricane Activity: CMIP3 and CMIP5 Model-based Scenarios". Journal of Climate. 26 (17): 6591–6617. Bibcode:2013JCli...26.6591K. doi:10.1175/JCLI-D-12-00539.1.
- ^ Jump up to: a b Collins, M.; Sutherland, M.; Bouwer, L.; Cheong, S.-M.; et al. (2019). "Chapter 6: Extremes, Abrupt Changes and Managing Risks" (PDF). IPCC Special Report on the Ocean and Cryosphere in a Changing Climate. p. 603.
- ^ Jump up to: a b "Hurricane Harvey shows how we underestimate flooding risks in coastal cities, scientists say". The Washington Post. August 29, 2017.
- ^ Jump up to: a b c Walsh, K. J. E.; Camargo, S. J.; Knutson, T. R.; Kossin, J.; Lee, T. -C.; Murakami, H.; Patricola, C. (December 1, 2019). "Tropical cyclones and climate change". Tropical Cyclone Research and Review. 8 (4): 240–250. doi:10.1016/j.tcrr.2020.01.004. ISSN 2225-6032.
- ^ Roberts, Malcolm John; Camp, Joanne; Seddon, Jon; Vidale, Pier Luigi; Hodges, Kevin; Vannière, Benoît; Mecking, Jenny; Haarsma, Rein; Bellucci, Alessio; Scoccimarro, Enrico; Caron, Louis-Philippe (2020). "Projected Future Changes in Tropical Cyclones Using the CMIP6 HighResMIP Multimodel Ensemble". Geophysical Research Letters. 47 (14): e2020GL088662. Bibcode:2020GeoRL..4788662R. doi:10.1029/2020GL088662. ISSN 1944-8007. PMC 7507130. PMID 32999514. S2CID 221972087.
- ^ "Hurricanes and Climate Change". Union of Concerned Scientists. Retrieved September 29, 2019.
- ^ Murakami, Hiroyuki; Delworth, Thomas L.; Cooke, William F.; Zhao, Ming; Xiang, Baoqiang; Hsu, Pang-Chi (2020). "Detected climatic change in global distribution of tropical cyclones". Proceedings of the National Academy of Sciences. 117 (20): 10706–10714. doi:10.1073/pnas.1922500117. ISSN 0027-8424. PMC 7245084. PMID 32366651.
- ^ James P. Kossin; Kerry A. Emanuel; Gabriel A. Vecchi (2014). "The poleward migration of the location of tropical cyclone maximum intensity". Nature. 509 (7500): 349–352. Bibcode:2014Natur.509..349K. doi:10.1038/nature13278. hdl:1721.1/91576. PMID 24828193. S2CID 4463311.
- ^ Florida Coastal Monitoring Program. "Project Overview". University of Florida. Archived from the original on May 3, 2006. Retrieved March 30, 2006.
- ^ "Observations". Central Pacific Hurricane Center. December 9, 2006. Archived from the original on June 24, 2012. Retrieved May 7, 2009.
- ^ "NOAA harnessing the power of new satellite data this hurricane season". National Oceanic and Atmospheric Administration. June 1, 2020. Retrieved March 25, 2021.
- ^ 403rd Wing. "The Hurricane Hunters". 53rd Weather Reconnaissance Squadron. Archived from the original on June 24, 2012. Retrieved March 30, 2006.
- ^ Lee, Christopher. "Drone, Sensors May Open Path Into Eye of Storm". The Washington Post. Archived from the original on November 11, 2012. Retrieved February 22, 2008.
- ^ National Hurricane Center (May 22, 2006). "Annual average model track errors for Atlantic basin tropical cyclones for the period 1994–2005, for a homogeneous selection of "early" models". National Hurricane Center Forecast Verification. National Oceanic and Atmospheric Administration. Archived from the original on June 24, 2012. Retrieved November 30, 2006.
- ^ National Hurricane Center (May 22, 2006). "Annual average official track errors for Atlantic basin tropical cyclones for the period 1989–2005, with least-squares trend lines superimposed". National Hurricane Center Forecast Verification. National Oceanic and Atmospheric Administration. Archived from the original on June 24, 2012. Retrieved November 30, 2006.
- ^ "Regional Specialized Meteorological Center". Tropical Cyclone Program (TCP). World Meteorological Organization. April 25, 2006. Archived from the original on August 14, 2010. Retrieved November 5, 2006.
- ^ Fiji Meteorological Service (2017). "Services". Archived from the original on June 18, 2017. Retrieved June 4, 2017.
- ^ Joint Typhoon Warning Center (2017). "Products and Service Notice". United States Navy. Archived from the original on June 9, 2017. Retrieved June 4, 2017.
- ^ National Hurricane Center (March 2016). "National Hurricane Center Product Description Document: A User's Guide to Hurricane Products" (PDF). National Oceanic and Atmospheric Administration. Archived (PDF) from the original on June 17, 2017. Retrieved June 3, 2017.
- ^ Japan Meteorological Agency (2017). "Notes on RSMC Tropical Cyclone Information". Archived from the original on March 19, 2017. Retrieved June 4, 2017.
- ^ Lander, Mark A.; et al. (August 3, 2003). "Fifth International Workshop on Tropical Cyclones". World Meteorological Organization. Archived from the original on May 9, 2009. Retrieved May 6, 2009.
- ^ Atlantic Oceanographic and Meteorological Laboratory, Hurricane Research Division. "Frequently Asked Questions: What is an extra-tropical cyclone?". National Oceanic and Atmospheric Administration. Archived from the original on February 9, 2007. Retrieved July 25, 2006.
- ^ "Lesson 14: Background: Synoptic Scale". University of Wisconsin–Madison. February 25, 2008. Archived from the original on February 20, 2009. Retrieved May 6, 2009.
- ^ "An Overview of Coastal Land Loss: With Emphasis on the Southeastern United States". United States Geological Survey. 2008. Archived from the original on February 12, 2009. Retrieved May 6, 2009.
- ^ Atlantic Oceanographic and Meteorological Laboratory, Hurricane Research Division. "Frequently Asked Questions: What is a sub-tropical cyclone?". National Oceanic and Atmospheric Administration. Archived from the original on October 11, 2011. Retrieved July 25, 2006.
- ^ "New Mortality Records Announced" (Press release). World Meteorological Organization. 2017. Archived from the original on June 26, 2018. Retrieved June 25, 2018.
- ^ Landsea, Chris (1993). "Which tropical cyclones have caused the most deaths and most damage?". Hurricane Research Division. Archived from the original on June 24, 2012. Retrieved February 23, 2007.
- ^ Frank, N.L.; Husain, S.A. (1971). "The Deadliest Tropical Cyclone in History". Bulletin of the American Meteorological Society. 52 (6): 438–445. Bibcode:1971BAMS...52..438F. doi:10.1175/1520-0477(1971)052<0438:TDTCIH>2.0.CO;2.
- ^ Anderson-Berry, Linda J. Fifth International Workshop on Tropycal Cyclones: Topic 5.1: Societal Impacts of Tropical Cyclones. Archived September 22, 2012, at WebCite. Retrieved February 26, 2008.
- ^ National Hurricane Center (April 22, 1997). "The Deadliest Atlantic Tropical Cyclones, 1492–1996". National Oceanic and Atmospheric Administration. Archived from the original on January 28, 2008. Retrieved March 31, 2006.
- ^ Joint Typhoon Warning Center. "Typhoon Thelma (27W)" (PDF). 1991 Annual Tropical Cyclone Report. Archived (PDF) from the original on December 6, 2013. Retrieved March 31, 2006.
- ^ Gunther, E.B.; Cross, R.L.; Wagoner, R.A. (1983). "Eastern North Pacific Tropical Cyclones of 1982". Monthly Weather Review. 111 (5): 1080–1102. Bibcode:1983MWRv..111.1080G. doi:10.1175/1520-0493(1983)111<1080:ENPTCO>2.0.CO;2.
- ^ Costliest U.S. tropical cyclones tables update (PDF) (Report). United States National Hurricane Center. January 12, 2018. Archived (PDF) from the original on January 26, 2018. Retrieved January 12, 2018.
- ^ Jump up to: a b "Hurricane Damages Sour to New Levels". Earth Policy Institute. 2006. Archived from the original on December 13, 2006. Retrieved February 23, 2007.
- ^ Jump up to: a b Knabb, Richard D.; Rhome, Jamie R.; Brown, Daniel P. (December 20, 2005). "Tropical Cyclone Report: Hurricane Katrina: 23–30 August 2005" (PDF). National Hurricane Center. Retrieved May 30, 2006.
- ^ National Hurricane Center. Galveston Hurricane 1900. Archived July 9, 2006, at the Wayback Machine. Retrieved February 24, 2008.
- ^ Central Pacific Hurricane Center. "Hurricane Iniki Natural Disaster Survey Report". National Oceanic and Atmospheric Administration. Archived from the original on July 16, 2015. Retrieved March 31, 2006.
- ^ Lawrence, Miles B. (November 7, 1997). "Preliminary Report: Hurricane Pauline: 5–10 October 1997". National Hurricane Center. Archived from the original on September 25, 2005. Retrieved March 31, 2006.
- ^ Franklin, James L. (December 26, 2002). "Tropical Cyclone Report: Hurricane Kenna: 22–26 October 2002" (PDF). National Hurricane Center. Archived from the original on July 16, 2014. Retrieved March 31, 2006.
- ^ World Food Programme (2004). "WFP Assists Cyclone And Flood Victims in Madagascar". Archived from the original on February 14, 2009. Retrieved February 24, 2007.
- ^ Dunnavan, G.M.; Diercks, J.W. (1980). "An Analysis of Super Typhoon Tip (October 1979)". Monthly Weather Review. 108 (11): 1915–1923. Bibcode:1980MWRv..108.1915D. doi:10.1175/1520-0493(1980)108<1915:AAOSTT>2.0.CO;2.
- ^ Pasch, Richard (October 23, 2015). "Hurricane Patricia Discussion Number 14". National Hurricane Center. Archived from the original on October 25, 2015. Retrieved October 23, 2015.
Data from three center fixes by the Hurricane Hunters indicate that the intensity, based on a blend of 700 mb-flight level and SFMR-observed surface winds, is near 175 kt. This makes Patricia the strongest hurricane on record in the National Hurricane Center's area of responsibility (AOR) which includes the Atlantic and the eastern North Pacific basins.
- ^ Atlantic Oceanographic and Meteorological Laboratory, Hurricane Research Division. "Frequently Asked Questions: Which is the most intense tropical cyclone on record?". NOAA. Archived from the original on December 6, 2010. Retrieved July 25, 2006.
- ^ Houston, Sam; Greg Forbes; Arthur Chiu (August 17, 1998). "Super Typhoon Paka's (1997) Surface Winds Over Guam". National Weather Service. Archived from the original on November 5, 2015. Retrieved March 30, 2006.
- ^ World Record Wind Gust: 408 km/h Archived January 20, 2013, at the Wayback Machine. World Meteorological Organization.
- ^ Courtney et. al. 2012, Documentation and verification of the world extreme wind gust record: 113.3 m/s on Barrow Island, Australia, during passage of tropical cyclone Olivia, AMOJ 62, p1-9.
- ^ Dorst, Neal; Hurricane Research Division (May 29, 2009). "Frequently Asked Questions: Subject: E5) Which are the largest and smallest tropical cyclones on record?". National Oceanic and Atmospheric Administration's Atlantic Oceanographic and Meteorological Laboratory. Archived from the original on December 22, 2008. Retrieved June 12, 2013.
- ^ Dorst, Neal; Hurricane Research Division (January 26, 2010). "Subject: E6) Frequently Asked Questions: Which tropical cyclone lasted the longest?". National Oceanic and Atmospheric Administration's Atlantic Oceanographic and Meteorological Laboratory. Archived from the original on May 19, 2009. Retrieved June 12, 2013.
- ^ Jump up to: a b Dorst, Neal; Delgado, Sandy; Hurricane Research Division (May 20, 2011). "Frequently Asked Questions: Subject: E7) What is the farthest a tropical cyclone has travelled?". National Oceanic and Atmospheric Administration's Atlantic Oceanographic and Meteorological Laboratory. Archived from the original on May 19, 2009. Retrieved June 12, 2013.
- ^ Jump up to: a b c Dorst, Neal; Hurricane Research Division (June 1, 2013). "Subject: J4) What fictional books, plays, poems, and movies have been written involving tropical cyclones?". Tropical Cyclone Frequently Asked Questions. National Oceanic and Atmospheric Administration. Retrieved March 30, 2013.
- ^ McCown, Sean (December 13, 2004). "Unnamed Hurricane 1991". Satellite Events Art Gallery: Hurricanes. National Climatic Data Center. Archived from the original on December 7, 2013. Retrieved February 4, 2007.
- ^ "Hurricane Neddy – Episode Overview". Yahoo! TV. Archived from the original on May 6, 2009. Retrieved February 26, 2008.
- ^ "Family Guy: One if by Clam, Two if by Sea – Summary". starpulse.com. Archived from the original on May 6, 2009. Retrieved February 26, 2008.
- ^ "Dawson's Creek – Hurricane". Yahoo! TV. Archived from the original on May 6, 2009. Retrieved February 25, 2008.
- ^ "CSI: Miami Episodes – Episode Detail: Hurricane Anthony". TV Guide. Archived from the original on May 6, 2009. Retrieved February 25, 2008.
- ^ "The Day After Tomorrow Movie Synopsis". Tribute.ca. Archived from the original on May 6, 2009. Retrieved February 26, 2008.
- ^ "The Day After Tomorrow (2004)". Movies & TV Dept. The New York Times. 2011. Archived from the original on March 10, 2011. Retrieved February 26, 2008.
External links
| Look up tropical cyclone in Wiktionary, the free dictionary. |
| Wikimedia Commons has media related to Tropical cyclones. |
| Wikisource has original text related to this article: |
| Wikivoyage has a travel guide for Cyclones. |
- United States National Hurricane Center – North Atlantic, Eastern Pacific
- United States Central Pacific Hurricane Center – Central Pacific
- Japan Meteorological Agency – Western Pacific
- India Meteorological Department – Indian Ocean
- Météo-France – La Reunion – South Indian Ocean from 30°E to 90°E
- Indonesian Meteorological Department – South Indian Ocean from 90°E to 125°E, north of 10°S
- Australian Bureau of Meteorology – South Indian Ocean and South Pacific Ocean from 90°E to 160°E
- Papua New Guinea National Weather Service – South Pacific east of 160°E, north of 10°S
- Fiji Meteorological Service – South Pacific west of 160°E, north of 25° S
- MetService New Zealand – South Pacific west of 160°E, south of 25°S
| show Cyclones and anticyclones of the world (Centers of action) |
|---|

| show Seasons |
|---|
| show Elements of nature |
|---|
| show Authority control |
|---|
- Tropical cyclones
- Tropical cyclone meteorology
- Climate change and hurricanes
- Meteorological phenomena
- Types of cyclone
- Vortices
- Weather hazards
- Storm