2006 Pacific hurricane season
| 2006 Pacific hurricane season | |
|---|---|
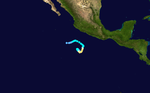
 Season summary map | |
| Seasonal boundaries | |
| First system formed | May 27, 2006 |
| Last system dissipated | November 20, 2006 |
| Strongest storm | |
| Name | Ioke (Most intense hurricane in the Central Pacific) |
| • Maximum winds | 160 mph (260 km/h) (1-minute sustained) |
| • Lowest pressure | 915 mbar (hPa; 27.02 inHg) |
| Seasonal statistics | |
| Total depressions | 25, 1 unofficial |
| Total storms | 19, 1 unofficial |
| Hurricanes | 11 |
| Major hurricanes (Cat. 3+) | 6 |
| Total fatalities | 14 total |
| Total damage | $355.1 million (2006 USD) |
| Related articles | |
The 2006 Pacific hurricane season was the most active since 2000, producing 19 tropical storms or hurricanes.[1] Eighteen developed within the National Hurricane Center (NHC) area of warning responsibility, which is east of 140°W, and one storm formed between 140°W and the International Date Line, which is under the jurisdiction of the Central Pacific Hurricane Center (CPHC). Of the 19 total storms, eleven became hurricanes, of which six attained major hurricane status. Within the NHC portion of the basin, the season officially began on May 15, and in the CPHC portion, it started on June 1; the season officially ended on November 30. These dates conventionally delimit the period of each year when most tropical cyclones form in the eastern Pacific basin.
The strongest storm of the season was Hurricane Ioke, which reached Category 5 status on the Saffir–Simpson scale in the central Pacific Ocean; Ioke passed near Johnston Atoll and later Wake Island, where it caused heavy damage but no deaths. The deadliest storm of the season was Hurricane John, which killed six people after striking the Baja California Peninsula, and the costliest storm was Hurricane Lane, which caused $203 million in damage in southwestern Mexico (2006 USD, $261 million 2022 USD).
Seasonal activity began on May 27, when Tropical Storm Aletta formed off the southwest coast of Mexico. No storms formed in June, though the season became active in July when five named storms developed, including Hurricane Daniel which was the second strongest storm of the season, as well as Tropical Storm Emilia. During August, Hurricanes Ioke and John formed, as well as four other storms. September was a relatively quiet month with two storms, of which one was Hurricane Lane. Three storms developed in October including Hurricane Paul and two formed in November; this marked the second time on record, after 1961, when more than one tropical storm developed in the basin during the month of November. Damage across the basin reached $355.1 million (2006 USD), while 14 people were killed by the various storms.
Seasonal forecast[]
| Source | Date | Named storms |
Hurricanes | Major hurricanes |
| CPC | Average[2] | 15.3 | 8.8 | 4.2 |
| NOAA | May 22, 2006 | 12–16 | 6–8 | 1–3 |
| Actual activity | 18 | 10 | 5 |
On May 22, 2006, the National Oceanic and Atmospheric Administration's (NOAA) CPC (CPC) released their forecasts for the 2006 Atlantic and Pacific hurricane seasons. The Pacific season was expected to be hindered by the decades-long cycle that began in 1995, which generally increased wind shear across the basin. NOAA predicted a below-normal level of activity in the Eastern Pacific, with 12–16 named storms, of which 6–8 were expected to become hurricanes, and 1–3 expected to become major hurricanes.[3] The Central Pacific Hurricane Center's area of responsibility was also expected to be below average, with only two to three tropical cyclones expected to form or cross into the area.[4] They expected that neither El Niño nor La Niña would affect conditions significantly.[3]
On May 15, the hurricane season began in the Eastern Pacific basin, which is the area of the northern Pacific Ocean east of 140°W.[5] On June 1, the season began in the Central Pacific warning zone (between 140°W and the International Date Line); however, no storms occurred in the region until July.[6]
Seasonal summary[]

The accumulated cyclone energy (ACE) index for the 2006 Pacific hurricane season in total is 156.99 units (120.48 units in the Eastern Pacific and 36.513 units in the Central Pacific).[nb 1] Broadly speaking, ACE is a measure of the power of a tropical or subtropical storm multiplied by the length of time it existed. Therefore, a storm with a longer duration, such as Hurricane Ioke, which arrived with a total of 32.2250 units and then crossed to the Western Pacific, will have high values of ACE. It is only calculated for full advisories on specific tropical and subtropical systems reaching or exceeding wind speeds of 39 mph (63 km/h).
| Most intense Pacific hurricanes[7] | |||||
|---|---|---|---|---|---|
| Rank | Hurricane | Season | Pressure | ||
| hPa | inHg | ||||
| 1 | Patricia | 2015 | 872 | 25.75 | |
| 2 | Linda | 1997 | 902 | 26.64 | |
| 3 | Rick | 2009 | 906 | 26.76 | |
| 4 | Kenna | 2002 | 913 | 26.96 | |
| 5 | Ava | 1973 | 915 | 27.02 | |
| Ioke | 2006 | ||||
| 7 | Marie | 2014 | 918 | 27.11 | |
| Odile | |||||
| 9 | Guillermo | 1997 | 919 | 27.14 | |
| 10 | Gilma | 1994 | 920 | 27.17 | |
| Listing is only for tropical cyclones in the Pacific Ocean north of the equator and east of the International Dateline | |||||
Overall, there were 19 tropical storms. In addition, 11 hurricanes developed. Furthermore, there were total of six major hurricanes, Category 3 or greater on the Saffir–Simpson hurricane wind scale. The season officially started on May 15 in the East Pacific Ocean, and on June 1 in the Central Pacific; they both ended on November 30. No tropical storms developed in June in the basin, which was unusual compared to the average of two storms forming during the month.
From 1966 to 2008, there have been only three other seasons in which a tropical storm did not form in June, these being 1969, 2004, 2007 seasons.[8] After such an inactive month, the tropics became active in July when five named storms developed, including Hurricane Daniel which was the second strongest storm of the season. During August, Hurricanes Ioke and John formed, as well as four other storms. September was a relatively quiet month with two storms, of which one was Hurricane Lane.[7] By that time, however, El Niño conditions became established across the Pacific,[9] which is known to enhance Pacific hurricane activity.[3]
Three storms developed in October, including Hurricane Paul.[7] Tropical activity within the basin in November 2006 was the most active on record, based on the ACE Index. Three tropical cyclones formed, of which two became tropical storms; only one other season on record at the time, 1961, produced two tropical storms in the month of November.[10] In addition, Mexico was struck by four tropical cyclones in 2006, none on the Atlantic coast and all along the Pacific coast.[11] One hit Baja California Peninsula while the others made landfall on the mainland.[12]
An extratropical storm persisted in the extreme northern central Pacific Ocean in late October. It drifted over unusually warm waters up to 3.6 °F (2 °C) above normal, and gradually developed convection near the center. By November 2, QuikSCAT satellite suggested the system attained winds of up to 60 mph (95 km/h) about 900 mi (1,450 km) west of Oregon. The system also developed an eye and an eyewall. The cyclone tracked northeastward as it gradually weakened, and dissipated on November 4. NASA considered the cyclone to be a subtropical storm. However, as it formed outside of the territory of any monitoring organization, it was not named. Operationally, the United States Navy treated the system as a tropical disturbance, numbered 91C.[13]
Systems[]
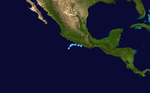
Tropical Storm Aletta[]
| Tropical storm (SSHWS) | |
  | |
| Duration | May 27 – May 30 |
|---|---|
| Peak intensity | 45 mph (75 km/h) (1-min) 1002 mbar (hPa) |
The first storm of the year had its genesis from a tropical wave that crossed Central America and entered the East Pacific on May 21. The system interacted with a trough near the Gulf of Tehuantepec, causing thunderstorms to increase. A large low-pressure area formed on May 25 south of Mexico, which organized slowly due to wind shear in the region. Early on May 27, the NHC designated the system as Tropical Depression One-E about 190 mi (305 km) south of Acapulco.[14] The nascent storm moved little, and the wind shear displaced the center west of the convection.[15] Late on May 27, the NHC upgraded the depression to Tropical Storm Aletta.[14] While named tropical cyclones in May are infrequent events, Aletta marked the seventh consecutive year to have a named cyclone form in May.[16] The storm drifted for several days off the southern coast of Mexico. The NHC estimated peak winds of 45 mph (70 km/h) on May 28,[14] as the storm presented an elongated cloud structure.[17] Increased wind shear and dry air caused weakening on May 29, and Aletta weakened into a tropical depression. Drifting westward, the system became a remnant low on May 31, and dissipated soon afterward.[14]
The storm moved toward the Guerrero coast in southwestern Mexico, prompting the Mexican government to issue tropical storm watches between Punta Maldonado and Zihuatanejo.[18] Aletta produced moderate rainfall across Mexico, including a 24-hour rainfall total of 100 mm (3.94 inches)[nb 2] in Jacatepec, Oaxaca on May 30, and 96 mm (3.78 inches) in La Calera, Guerrero, on the next day.[18] High winds knocked down trees and caused minor structural damage. In Zihuatanejo, a ship with nine people was rescued after being reported as lost, which may have been a result of high seas generated by Aletta.[19]
Tropical Depression Two-E[]
| Tropical depression (SSHWS) | |
  | |
| Duration | June 3 – June 5 |
|---|---|
| Peak intensity | 35 mph (55 km/h) (1-min) 1005 mbar (hPa) |
On the day after Aletta dissipated, a new area of disturbed weather developed off the southwest Mexican coast. High shear slowed the development of the system, although it gained enough convection and organization to be classified as a tropical depression on June 3. The depression strengthened to near tropical storm status as it approached the coast of southwestern Mexico; however, shear persisted over the system and it weakened before dissipating on June 4.[20]
Despite never becoming a named storm, heavy rain occurred, including a total of 19.13 inches (486 mm) measured in a 48‑hour period in Acapulco.[21] Mudslides and flash flooding were reported,[20] forcing 72 people from their homes.[22] No deaths or serious damage was reported.[20]
Hurricane Bud[]
| Category 3 hurricane (SSHWS) | |
  | |
| Duration | July 11 – July 16 |
|---|---|
| Peak intensity | 125 mph (205 km/h) (1-min) 953 mbar (hPa) |
A tropical wave exited the west coast of Africa on June 27, which reached the eastern Pacific on July 7. The system spawned a low-pressure area south of Mexico. Associated convection gradually became better organized, and the system organized into Tropical Depression Three-E early on July 11. Steered by a subtropical ridge over Mexico, the storm tracked west-northwestward for its entirety. Located over warm waters, the depression intensified into Tropical Storm Bud within six hours of its formation.[23] The thunderstorms organized, with good outflow except to the east due to the presence of Tropical Storm Carlotta. On July 12, the NHC upgraded Bud to a hurricane, after an eye developed in the storm's center.[24][23][25] Later on July 12, Bud was upgraded to a Category 2 hurricane on the Saffir–Simpson hurricane scale.[23]
Early on July 13, Bud became a Category 3 hurricane, or a major hurricane. At that time, the well-defined eye was enclosed by a ring of deep thunderstorms.[26] That day, the hurricane reached its peak intensity of 125 mph (200 km/h) and a minimum barometric pressure of 953 mbar (28.1 inHg). Bud encountered cooler waters and stable air, and a period of rapid weakening began.[23] The eye became obscured, and core convective cloud tops began to warm,[27] until much of the convection was lost on July 14, impeded by southeasterly wind shear.[23] On July 15, Bud was downgraded to a tropical depression, and the next day it degenerated into a remnant low. The low fully dissipated on July 17 about 750 mi (1,210 km) east-northeast of Hawaii.[23] The remnants of Bud produced light rainfall across Hawaii.[28]
Hurricane Carlotta[]
| Category 1 hurricane (SSHWS) | |
  | |
| Duration | July 12 – July 16 |
|---|---|
| Peak intensity | 85 mph (140 km/h) (1-min) 981 mbar (hPa) |
A tropical wave exited Africa on June 30 and moved across the Atlantic Ocean without development. On July 9, while crossing Central America into the eastern North Pacific Ocean, thunderstorm activity increased, and the system organized into Tropical Depression Four-E early on July 12 about 290 mi (465 km) south of Zihuatanejo, Guerrero.[29] The large depression moved quickly to the west-northwest to the south of a ridge over northwestern Mexico, and its outer rainbands moved across the coast. Rainfall totals were less than 1 inch (25 mm).[29] The depression intensified into Tropical Storm Carlotta just six hours after forming.[29] By late on July 12, the storm developed banding features,[30] and early on July 13 Carlotta attained hurricane status about 430 mi (690 km) south of the southern tip of the Baja California peninsula.[29]
As Carlotta intensified, the system became more compact, and it reached peak winds of 85 mph (135 km/h) on July 13.[29] An eye formed in the center, and the hurricane was briefly forecast to attain major hurricane status, or a Category 3 on the Saffir–Simpson scale.[31] However, Carlotta weakened due to increased wind shear from Hurricane Bud to its west,[29] and the eye and convection deteriorated.[32] Carlotta briefly weakened to tropical storm status late on July 14, although a decrease in shear allowed it to reintensify into a hurricane. This was short-lived as the center moved into the area of cooler waters, and Carlotta again weakened to tropical storm status.[29] Late on July 15, the circulation became separated from the convection,[33] and Carlotta weakened to tropical depression status on July 16, and the next day generated into a remnant low. The circulation continued generally westward, dissipating on July 20 about 1,500 mi (2,415 km) east of the Hawaiian islands.[29]
Hurricane Daniel[]
| Category 4 hurricane (SSHWS) | |
  | |
| Duration | July 16 – July 26 |
|---|---|
| Peak intensity | 150 mph (240 km/h) (1-min) 933 mbar (hPa) |
On July 16, a tropical disturbance formed far to the south of the Baja California Peninsula and quickly increased in convective activity and organization, becoming a tropical depression. The system continued to organize and was designated as a tropical storm the next day. On July 18, Daniel attained hurricane status, and two days later underwent rapid intensification; it reached major hurricane status and was later upgraded further to Category 4 status on the Saffir–Simpson hurricane scale. Its peak intensity was 150 mph (240 km/h).[34] The hurricane underwent eyewall replacement cycles, which are internal mechanisms that occur in most intense hurricanes. Daniel later became an annular hurricane, which allowed it to maintain Category 4 status for longer than it otherwise would have.[35]
It crossed over into the Central Pacific early on July 24 and was predicted to affect Hawaii as a tropical storm; however, Daniel encountered weak steering currents in the open ocean, causing it to slow down considerably.[34] It rapidly degenerated to a tropical depression on July 25, and the CPHC issued its last advisory on July 26 while the storm was still well to the east of Hawaii. Its remnants later moved across the Hawaiian islands,[34] dropping heavy rainfall and causing flooding.[9] West Wailuaiki on Maui recorded 3.87 inches (98 mm) in one day, which was the highest daily rainfall total from the hurricane.[28]
Tropical Storm Emilia[]
| Tropical storm (SSHWS) | |
  | |
| Duration | July 21 – July 28 |
|---|---|
| Peak intensity | 65 mph (100 km/h) (1-min) 990 mbar (hPa) |
The origins of Emilia were from a tropical wave that developed into a tropical depression on July 21, a short distance off the coast of Acapulco. It moved generally north-northwestward, reaching tropical storm status on July 22 and passing about 175 mi (280 km) southwest of Manzanillo, Colima.[36] An eyewall began to form that day,[37] and Emilia reached peak winds of 65 mph (105 km/h).[36] It briefly weakened due to wind shear, although restrengthening occurred as the storm turned toward the Baja California peninsula. On July 26, Emilia again reached peak winds of 65 mph (105 km/h), and shortly thereafter it passed about 60 mi (95 km) southwest of the southern tip of Baja California. It weakened as it turned into cooler waters, first to tropical depression status on July 27 and then to a convective-less remnant low on July 28. The remnants dissipated on July 31 about 495 mi (795 km) west-southwest of San Diego, California.[36]
In southwestern Mexico, Emilia produced tropical storm force winds along the coastline. Rainfall in the southern portion of the Baja California peninsula caused minor flooding, and gusty winds caused damage to buildings and power lines.[36] Moisture from Emilia reached the southwestern United States. Thunderstorms and rainfall occurred across Arizona, causing flooding.[38] In southern California, the storm dropped light rainfall, which assisted firefighters in containing a wildfire.[39]
Tropical Storm Fabio[]
| Tropical storm (SSHWS) | |
  | |
| Duration | July 31 – August 3 |
|---|---|
| Peak intensity | 50 mph (85 km/h) (1-min) 1000 mbar (hPa) |
A tropical wave crossed the west coast of Africa on July 15 and entered the Pacific on July 25. Convection increased on July 28, and at 1800 UTC on July 31 the system became Tropical Depression Seven-E about 980 miles (1,580 km) southwest of the southern tip of the Baja California peninsula. Six hours later, the depression was upgraded to Tropical Storm Fabio. It moved westward due to a ridge to its north, and on August 1 Fabio reached peak winds of 50 mph (80 km/h). Later, the storm began weakening due to increased wind shear and dry air. On August 3, Fabio deteriorated to tropical depression status, and later that day it degenerated into a remnant low-pressure area. The remnants continued westward, moving across Hawaii on August 7.[40]
Although Fabio did not impact land, its remnants produced heavy rainfall in Hawaii. In a 24-hour period, 2.89 inches (73 mm) of rainfall was recorded at on the island of Hawaii; this was the highest daily rainfall total for the month on the island. However, the heaviest precipitation fell on Mount Waiʻaleʻale on Kauai, where 15.08 inches (383 mm) fell in 24 hours; this total alone was greater than all other monthly rainfall totals in the state.[41] The heavy rainfall flooded the Hanalei River, which forced the closure of the Kuhio Highway when a bridge was inundated.[40] On Oahu, the rainfall caused ponding on roadways and flooding along streams. One flooded stream stranded 24 hikers along a trail, all of whom required rescue by helicopter.[42]
Tropical Storm Gilma[]
| Tropical storm (SSHWS) | |
  | |
| Duration | August 1 – August 3 |
|---|---|
| Peak intensity | 40 mph (65 km/h) (1-min) 1004 mbar (hPa) |
On July 17, a tropical wave exited Africa and crossed the Atlantic without developing. On July 25 it entered the Eastern Pacific, gradually developing an area of organized convection. Despite marginally favorable upper-level winds, the system organized enough to be declared a tropical depression on August 1, several hundred miles southwest of Acapulco, Mexico.[43] Initially, the depression tracked west-northwestward.[7] Despite wind shear in the area,[44] the depression was upgraded to Tropical Storm Gilma later on August 1. The wind shear prevented further strengthening or organization, and Gilma weakened to a tropical depression early on August 2.[43] The depression turned westward,[7] and Gilma degenerated into a remnant low by August 4.[43]
Hurricane Hector[]
| Category 2 hurricane (SSHWS) | |
  | |
| Duration | August 15 – August 23 |
|---|---|
| Peak intensity | 110 mph (175 km/h) (1-min) 966 mbar (hPa) |
A tropical wave exited Africa on July 31, and after no development in the Atlantic, it crossed Central America into the northeastern Pacific Ocean on August 10. Convection gradually increased, and a broad low-pressure area developed about 375 miles (605 km) south of Acapulco, Mexico on August 13. The system continued to become organized, and it developed into a tropical depression around 1800 UTC on August 15 about 650 mi (1,045 km) south-southwest of the southern tip of Baja California. It moved west-northwestward, located south of a ridge that extended westward from northern Mexico westward into the Pacific. The depression quickly intensified into Tropical Storm Hector early on August 16.[45] Hector was able to steadily strengthen, reaching hurricane status at 0600 UTC on August 17. It is estimated that Hector reached its peak intensity of 110 mph (175 km/h) at 0600 UTC on August 18, while centered about 1,035 mi (1,665 km) southwest of the southern tip of Baja California.[7]
Hector remained a Category 2 hurricane for about 24 hours.[7] Shortly thereafter, it encountered cooler waters and westerly shear,[46] and Hector steadily weakened until becoming a tropical storm by August 20. Shortly thereafter, the storm reached a weakness in the subtropical ridge, which caused it to move slowly to the northwest. By August 21, deep convection was confined to the northeast portion of the circulation.[47] The shear was not strong enough to completely weaken the tropical cyclone and Hector remained a tropical storm with 50 mph (80 km/h) winds for about 24 hours.[45] After the remaining shower and thunderstorm activity dissipated on August 22, the cyclone turned westward in response to the low-level easterly wind flow.[48] Hector weakened to a tropical depression at 0000 UTC on August 23, and to a remnant low six hours later. The remnant circulation of Hector dissipated on August 24 about 750 mi (1,210 km) east of the Hawaiian Islands.[49]
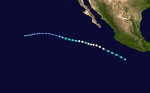
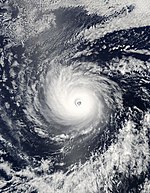
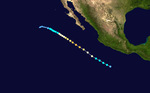
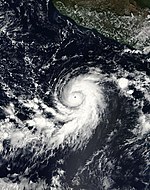
Hurricane Ioke[]
| Category 5 hurricane (SSHWS) | |
  | |
| Duration | August 20 – August 27 (Exited basin) |
|---|---|
| Peak intensity | 160 mph (260 km/h) (1-min) 915 mbar (hPa) |
The cyclone developed from the Intertropical Convergence Zone on August 20 far to the south of Hawaii. Encountering warm waters, little wind shear, and well-defined outflow, Ioke intensified from a tropical depression to Category 4 status within 48 hours. Late on August 22 it rapidly weakened to Category 2 status before crossing over Johnston Atoll. Two days later favorable conditions again allowed for rapid strengthening, and Ioke attained Category 5 status on August 25 before crossing the International Date Line. At the time, its barometric pressure was estimated at 915 mbar, thus becoming the strongest hurricane on record in the Central Pacific.[9] As it continued westward its intensity fluctuated, and on August 31 it passed near Wake Island with winds of 155 mph (249 km/h). Ioke gradually weakened as it turned northwestward and northward, and by September 6 it had transitioned into an extratropical cyclone.[50] By then, the cyclone had lasted 19 days, reaching the equivalent of Category 5 status on the Saffir–Simpson hurricane scale three times.[9] The remnants of Ioke accelerated northeastward and ultimately crossed into Alaska.[51]
Ioke did not affect any permanently populated areas in the Central Pacific or Western Pacific basins as a hurricane or a typhoon. A crew of 12 people stayed in a hurricane-proof bunker on Johnston Atoll during the hurricane's passage; the crew estimated winds reached over 100 mph (160 km/h), which damaged trees on the island but did not impact the island's bird population.[9][52] The hurricane left moderate damage on Wake Island totaling $88 million (2006 USD), which resulted from blown off roofs and damaged buildings, although the infrastructure of the island was left intact. All military personnel were evacuated from the island, the first full-scale evacuation of the island since Typhoon Sarah in 1967.[53][54][55] Later, the extratropical remnants of Ioke produced a severe storm surge along the Alaskan coastline, causing beach erosion.[56]
Hurricane Ileana[]
| Category 3 hurricane (SSHWS) | |
  | |
| Duration | August 21 – August 27 |
|---|---|
| Peak intensity | 120 mph (195 km/h) (1-min) 955 mbar (hPa) |
A tropical wave exited the west coast of Africa on August 8, and entered the eastern Pacific on August 16. Three days later, a weak low-pressure area formed, and thunderstorms consolidated near that feature. On August 21, the NHC designated the system Tropical Depression Ten-E about 350 mi (565 km) south-southwest of Acapulco, Mexico. A ridge over Mexico steered the system to the northwest through an area of warm waters and low wind shear. With favorable conditions, the depression quickly intensified into Tropical Storm Ileana.[57] An eye formed in the center of the convection, and Ileana attained hurricane status late on August 22.[58] On August 23, about 48 hours after forming, Ileana reached major hurricane status and a peak intensity of 120 mph (195 km/h), with a minimum pressure of 955 mbar (28.2 inHg). At that time, the storm was about 60 mi (95 km) southeast of the unpopulated Socorro Island.[57] During the storm's passage nearby, a station on the island recorded sustained winds of 59 mph (95 km/h), with gusts to 77 mph (124 km/h).[57]
As Ileana was heading north along the Mexican coastline, slight rainfall was recorded along the coast,[59] which caused some flooding in Nayarit, Jalisco, Colima, Michoacán, and Baja California Sur.[60] High surf killed a man near Cabo San Lucas, despite warnings not to swim in the ocean.[61] Despite forecasts of further intensification to Category 4 status,[62] Ileana began weakening due to cooler waters. The thunderstorms waned, and the storm slowed its forward motion.[57][63] On August 26, Ileana weakened to tropical storm status as convection decreased markedly. The next day, the storm deteriorated to tropical depression status, and later a remnant low after being devoid of thunderstorms. The low continued slowly westward, dissipating on August 29 about 830 mi (1,335 km) west-northwest of Cabo San Lucas.[57]
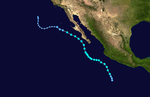
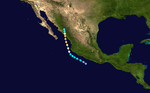
Hurricane John[]
| Category 4 hurricane (SSHWS) | |
  | |
| Duration | August 28 – September 4 |
|---|---|
| Peak intensity | 130 mph (215 km/h) (1-min) 948 mbar (hPa) |
On August 28, a persistent area of low pressure southwest of Acapulco, Mexico developed into a tropical depression. Later that day it strengthened into a tropical storm, and it reached hurricane strength 24 hours later on August 29. John underwent rapid intensification and reached Category 3 intensity later that day and Category 4 on August 30.[64] Hours later, the hurricane underwent another eyewall replacement cycle,[65] and subsequently weakened to Category 3 status as it paralleled the Mexican coastline a short distance offshore.[66] Potentially due to its eyewall replacement cycle or its interaction with land, John weakened to a 105 mph hurricane by late on August 31,[67] but restrengthened to a major hurricane shortly after. It made landfall near the southern tip of the Baja California peninsula as a Category 2 hurricane on September 1.[68] John continued northwestward along the eastern Baja California peninsula, weakening to tropical depression status by September 3 and dissipating on September 4 in the Gulf of California.[64]
Along the southwestern coast of Mexico, John produced heavy surf, strong winds, and heavy rainfall, which flooded roads, caused mudslides, and downed trees.[64][69] Along the Baja California Peninsula, the hurricane dropped heavy rainfall, with a 24-hour peak of 10.8 inches (276 mm) in Los Planes.[70] The heavy rainfall caused flooding, closed roads,[71] and caused a dam to overflow.[72] The winds and rainfall destroyed thousands of flimsy houses across the region.[73] Across Mexico, five people were killed,[64] and damage amounted to $663 million (2006 MXN, $60.8 million 2006 USD).[74] Moisture from the remnants of John produced flooding across Texas, which closed a ½ mile (800 m) portion of Interstate 10 in El Paso.[75] In southern New Mexico, the rainfall caused widespread street flooding and some minor damage.[76] Tropical moisture from the storm also produced rainfall in Arizona and southern California, where eight separate mudslides occurred, trapping 19 vehicles but causing no injuries.[77]
Hurricane Kristy[]
| Category 1 hurricane (SSHWS) | |
  | |
| Duration | August 30 – September 8 |
|---|---|
| Peak intensity | 80 mph (130 km/h) (1-min) 985 mbar (hPa) |
A tropical wave exited western Africa on August 13, which moved across the Atlantic over the next nine days before entering the eastern Pacific. After associated convection became better organized, the system developed into Tropical Depression Twelve-E on August 30 about 600 mi (965 km) southwest of the Baja California peninsula. With light wind shear and warm waters, the depression quickly strengthened into Tropical Storm Kristy as thunderstorms increased. The small hurricane tracked slowly northwestward at first due to a ridge to its north.[78] An eye soon developed,[79] signaling that Kristy intensified into a hurricane early on August 31, about 30 hours after forming. Later that day, the hurricane attained peak winds of 80 mph (130 km/h). Soon after, wind shear increased due to the outflow of powerful Hurricane John to its east,[78] and Kristy moved into an area of cooler waters and drier air. Hurricane forecast models anticipated a Fujiwhara effect, or an orbiting of two tropical cyclones, which would eventually result in Kristy being absorbed by Hurricane John.[80][81]
On September 1, Kristy weakened to tropical storm status, by which time the ridge to its north forced the storm southeastward.[78] On September 2, the circulation became exposed from the convection,[82] and Kristy fell to tropical depression status.[78] Thunderstorms reformed and persisted over the center on the next day. Kristy re-attained tropical storm status on September 4, although it soon fell back to tropical depression status.[78][83] Another burst of thunderstorms warranted Kristy being upgraded to tropical storm status again on September 5; by that time, the wind shear decreased and the track moved over warmer waters.[84] Kristy turned back to the west, falling again to tropical depression status on September 6, after thunderstorms decreased due to dry air.[78][85] Two days later, it degenerated into a remnant low, which dissipated a day later.[78] The remnant disturbance continued westward, and initially Kristy was believed to have developed into Tropical Depression Two-C in the central Pacific Ocean; however, post-season analysis concluded the systems were separate.[9]
Hurricane Lane[]
| Category 3 hurricane (SSHWS) | |
  | |
| Duration | September 13 – September 17 |
|---|---|
| Peak intensity | 125 mph (205 km/h) (1-min) 952 mbar (hPa) |
On September 13, a tropical disturbance located about 125 miles (200 km) west-southwest of Acapulco, Mexico, gradually became better organized and was designated the thirteenth tropical depression of the 2006 season. The depression intensified in a favorable environment, and was upgraded to Tropical Storm Lane later that night. As it moved parallel to the Mexican coast it continued to strengthen and became a hurricane on September 15, and a major hurricane early the next day. Hurricane Lane reached peak winds of 125 mph (200 km/h) before it made landfall on the coast of Sinaloa on September 16. It quickly weakened over land and dissipated on September 17.[86]
Tropical Storm Lane produced heavy rainfall and high seas along the west coast of Mexico, including Acapulco where flood waters reached 16 inches (40 cm) in depth. The Acapulco airport also experienced flooding, though service was not interrupted.[87] Throughout Mexico, the hurricane caused four deaths and $2.2 billion (2006 MXN, $203 million 2006 USD) in damage,[88] half of which in Sinaloa where heavy crop damage was reported.[89] An estimated 4,320 homes were affected by the hurricane, and 19,200 miles (30,000 km) of roads and highways were damaged to some degree, including some destroyed bridges.[88]
Tropical Storm Miriam[]
| Tropical storm (SSHWS) | |
  | |
| Duration | September 16 – September 18 |
|---|---|
| Peak intensity | 45 mph (75 km/h) (1-min) 999 mbar (hPa) |
A disturbance associated with a northerly extension of the Intertropical Convergence Zone and a tropical wave developed a closed circulation on September 15. It moved northeastward due to the influence from nearby Hurricane Lane, and organized enough to be declared Tropical Depression Fourteen-E on September 16 while located about 500 miles southwest of Cabo San Lucas, Mexico. It quickly strengthened, and organized into Tropical Storm Miriam later that day. After reaching a peak intensity of 45 mph (70 km/h), vertical wind shear and cooler waters rapidly weakened the storm, and the circulation decoupled from the convection on September 17. After turning more towards the north, Miriam weakened to tropical depression status, and on September 18 it degenerated to a remnant low. The remnant circulation turned to the northwest, then to the east, and dissipated on September 21 a short distance west of Baja California. No deaths are damage are associated with Miriam, and only one ship recorded winds of over tropical storm force near the center.[90]
Tropical Depression Two-C[]
| Tropical depression (SSHWS) | |
  | |
| Duration | September 19 – September 20 |
|---|---|
| Peak intensity | 35 mph (55 km/h) (1-min) 1007 mbar (hPa) |
On September 19, an area of disturbed weather associated with the Intertropical Convergence Zone became sufficiently organized to be designated Tropical Depression Two-C. Initially, it was thought that the depression formed from the remnants of Kristy, although subsequent analysis confirmed they were two separate systems. Initially, the depression was in an area of favorable conditions, with little wind shear and warm waters.[9] As a result, the CPHC predicted significant strengthening to at least hurricane status.[91] Instead, a high-pressure system to its north increased wind shear over the depression, causing the convection to become removed from the center. The depression weakened into a remnant low on September 20, never reaching tropical storm status.[9]
Tropical Depression Three-C[]
| Tropical depression (SSHWS) | |
  | |
| Duration | September 26 – September 27 |
|---|---|
| Peak intensity | 35 mph (55 km/h) (1-min) 1005 mbar (hPa) |
During September, El Niño conditions became established across the Pacific, which produced an area of warmer waters along the International Date Line. A few days after Tropical Depression Two-C dissipated, another area of disturbed weather formed, and although it was disorganized, it was also persistent. The CPHC initiated advisories on Tropical Depression Three-C on September 26 after a circulation was evident in the system. Strong wind shear prevented any development, and the system dissipated on September 27.[9]
Tropical Storm Norman[]
| Tropical storm (SSHWS) | |
  | |
| Duration | October 9 – October 15 |
|---|---|
| Peak intensity | 50 mph (85 km/h) (1-min) 1000 mbar (hPa) |
Early in October, a low-pressure system began to organize to the west of the Mexican coast, and on October 9 it developed into Tropical Depression Fifteen-E. It strengthened into a tropical storm the next day, but strong wind shear and low sea-surface temperatures hindered development. Norman slowly began to weaken, and on October 11 it degenerated into a remnant low-pressure area. Turning eastward, the system combined with a new tropical disturbance off the southwest Mexican coast, and slowly began to reorganize. The system was re-designated a tropical depression on October 15 just south-southeast of Manzanillo, Colima, although within a few hours it again dissipated.[92]
The storm brought heavy rainfall to southwestern Mexico, peaking at 6.35 inches (161 mm) in La Villita, Michoacán.[93] The rainfall caused flooding and mudslides around Acapulco, affecting 170 homes, of which 20 were destroyed.[94][95] About 300 hectares (740 acres) of crop fields sustained damage.[95] Initially there were two people missing;[95] however, a subsequent report indicated there were no casualties associated with the storm.[92]
Tropical Storm Olivia[]
| Tropical storm (SSHWS) | |
  | |
| Duration | October 9 – October 12 |
|---|---|
| Peak intensity | 45 mph (75 km/h) (1-min) 1000 mbar (hPa) |
On September 18, a tropical wave exited Africa and later crossed into the eastern Pacific on September 29 without development. Convection increased in the Pacific along the wave axis, spawning a broad low-pressure area on October 5. Despite the presence of wind shear, it organized enough for the NHC to initiate advisories on Tropical Depression Sixteen-E on October 9 about 1,360 miles (2,190 km) to the west-southwest of the southern tip of Baja California.[96] Influenced by a high-pressure system, the depression drifted northward.[97] Six hours after being upgraded to a tropical storm, Olivia attained peak winds of 45 mph (70 km/h),[96] although the convection was limited to its northern side due to wind shear.[98] On October 11, the convective activity diminished and Olivia weakened to tropical depression status.[99] Olivia deteriorated into a remnant low on October 13. It moved towards the east-southeast, and on October 15 was absorbed into the remnants of Tropical Storm Norman. Olivia never affected land.[96]
Tropical Depression Four-C[]
| Tropical depression (SSHWS) | |
  | |
| Duration | October 13 – October 14 |
|---|---|
| Peak intensity | 35 mph (55 km/h) (1-min) 1007 mbar (hPa) |
In the middle of October, the Intertropical Convergence Zone extended across the central Pacific Ocean, resembling an extension of the monsoon trough. An area of disturbed weather formed well to the southwest of Hawaii, organizing slowly for several days. Late on October 13, after the development of a low-level circulation and persistent convection, the CPHC classified the system as Tropical Depression Four-C about 750 mi (1,200 km) southwest of Honolulu, Hawaii. Upon being classified, the depression was located in an unusual steering flow that caused it to track eastward. Due to the approach of an upper-level trough, it was expected to dissipate quickly from wind shear, although forecasters noted the possibility for the trough to provide an outflow channel, which might allow strengthening.[100] On October 14, strong wind shear removed the convection completely from the center, and the system degenerated into a remnant low.[9]
The remnant circulation continued slowly eastward, dissipating on October 16. Concurrently, the convection tracked northeastward ahead of the upper-level trough, which contributed to heavy rainfall and flooding on the island of Hawaii on October 17.[9] The rainfall event coincided with the 2006 Kiholo Bay earthquake striking the area.[101]
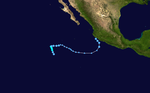
Hurricane Paul[]
| Category 2 hurricane (SSHWS) | |
  | |
| Duration | October 21 – October 26 |
|---|---|
| Peak intensity | 105 mph (165 km/h) (1-min) 970 mbar (hPa) |
Hurricane Paul developed from an area of disturbed weather on October 21, and slowly intensified as it moved into an area of warm waters and progressively decreasing wind shear. Paul attained hurricane status on October 23, and later that day it reached its peak intensity of 105 mph (170 km/h), a strong Category 2 hurricane on the Saffir–Simpson scale. A strong trough turned the hurricane to the north and northeast into an area of strong vertical shear, and Paul weakened to a tropical storm on October 24, later passing just south of the Baja California Peninsula. Paul weakened to a tropical depression on October 25 a short distance off the coast of Mexico, and after briefly turning away from the coast it made landfall on northwestern Sinaloa on October 26.[102]
Paul was the third hurricane to threaten western Mexico in the season, the others being Hurricanes John and Lane. Rough surf killed two people along Baja California Sur,[103] while two deaths from flooding were reported in Sinaloa.[104] Paul dropped moderate rainfall across mainland Mexico, including a 24-hour total of 2.28 inches (58 mm) in Mazatlán, Sinaloa.[105] Damage totaled more than $35 million (2006 MXN, $3.2 million 2006 USD).[106]
Tropical Depression Eighteen-E[]
| Tropical depression (SSHWS) | |
  | |
| Duration | October 26 – October 27 |
|---|---|
| Peak intensity | 35 mph (55 km/h) (1-min) 1007 mbar (hPa) |
The origins of Tropical Depression Eighteen-E were from a tropical wave that exited the coast of Africa on October 7. It briefly spawned a low-pressure area as the wave continued westward without development. On October 20, the wave entered the Pacific Ocean, developing an area of thunderstorms about four days later. By 1200 UTC on October 26, a tropical depression formed about 155 mi (250 km) south of Manzanillo.[107] Initially, Tropical Depression Eighteen-E was located in an area of light wind shear, and the NHC anticipated further organization and strengthening to near hurricane status.[108] The tropical depression initially maintained a steady westward motion away from the Mexican coastline, due to a ridge north of the cyclone.[108] By October 17, convection had decreased, and the depression was not forecast to intensify as much.[109] Possibly due to intrusion of dry air, the circulation became exposed from the thunderstorms, and having weakened, it turned to a southward drift.[110] By 0000 UTC on October 28, the system had weakened to a non-convective remnant low, which dissipated the following day.[107]
Tropical Storm Rosa[]
| Tropical storm (SSHWS) | |
  | |
| Duration | November 8 – November 10 |
|---|---|
| Peak intensity | 40 mph (65 km/h) (1-min) 1002 mbar (hPa) |
A tropical wave exited western Africa on October 22 and continued westward into the Pacific on November 2, spawning a tropical depression on November 8 about 440 mi (710 km) south of Manzanillo, Colima.[111] Environmental conditions appeared favorable,[112] although wind shear removed the convection from the circulation.[113] Throughout its duration, the storm maintained a northwest track through a weakness in a subtropical ridge.[114] By November 9, a new area of convection persisted near the center,[115] and a banding feature formed.[114] Despite the shear, the depression was upgraded to Tropical Storm Rosa, although the shear prevented intensification beyond its peak of 40 mph (65 km/h).[111] Rosa remained a tropical storm for only 18 hours, becoming a tropical depression early on November 10 and dissipating later that day.[111] Rosa was the first tropical storm in the basin to develop during November since 2000, and was also the first tropical depression to form in the month since 2002's Tropical Depression Sixteen-E. No impact was reported from the storm.[111]
Tropical Depression Twenty-E[]
| Tropical depression (SSHWS) | |
  | |
| Duration | November 11 – November 11 |
|---|---|
| Peak intensity | 35 mph (55 km/h) (1-min) 1007 mbar (hPa) |
A tropical wave moved off the western coast of Africa on October 21, briefly developing two weak low-pressure areas before the wave crossed into the Pacific Ocean on November 1. Thunderstorm activity slowly increased as the wave interacted within the Intertropical Convergence Zone. After a curved band of convection developed, it is estimated the system formed into Tropical Depression Twenty-E around 0000 UTC on November 11, about 550 mi (1,050 km) southwest of Manzanillo. Throughout its duration, the depression never completely separated from the Intertropical Convergence Zone.[116] When the NHC issued its first advisory on the depression, the agency predicted slight intensification to tropical storm status and for the depression to last at least two days. This was due to a forecast of gradually increasing wind shear after the first 24 hours.[117] Instead, the circulation became very elongated; it is estimated the cyclone degenerated into a trough by late on November 11.[116]
Hurricane Sergio[]
| Category 2 hurricane (SSHWS) | |
  | |
| Duration | November 13 – November 20 |
|---|---|
| Peak intensity | 110 mph (175 km/h) (1-min) 965 mbar (hPa) |
Just days after Tropical Depression Twenty-E degenerated into an open trough, Tropical Depression Twenty One-E developed from a tropical wave on November 13 about 460 miles (740 km) south of Manzanillo, Colima. It steadily intensified as it tracked southeastward, reaching peak winds of 110 mph (175 km/h) on November 15. Subsequently, it began to weaken due to increased wind shear as it turned to the north. Sergio later turned to the west, remaining well off the coast of Mexico, and it dissipated on November 20 about 320 miles (515 km) west-northwest of where it originally formed.[118]
Sergio produced light rainfall along the coast of Mexico, though its effects were minimal.[119] The formation of Sergio marked the 2006 season as the most active in 12 years and the second season in which more than one tropical storm formed in November, after 1961. Sergio set records for the month of November in the basin. At the time, it was considered the strongest hurricane to form in the month; although it has since dropped to third after Sandra from 2015, and Kenneth from 2011. It is however, still considered the longest-lived November Pacific tropical cyclone with a duration of seven days.[1][118]
Other system[]

On October 28, 2006, a cut-off extratropical cyclone stalled over the northeast Pacific Ocean and began to strengthen. By October 31, the storm had acquired tropical characteristics, including an eye, convection, and a warmer-than-average core.[120] The system reached peak intensity on November 1, before slowly weakening and looping towards the Pacific Northwest. The system made landfall in Washington state on November 3, before rapidly weakening and dissipating on the next day. During the duration of the storm, the system was known as Storm 91C (or INVEST 91C). The storm's true nature still remains controversial among meteorologists today, due to disputes over the storm's exact structure and whether or not it had obtained tropical or subtropical characteristics.[121] Because the storm was not within the area of responsibility of the National Hurricane Center or the Central Pacific Hurricane Center, the storm was never assigned a name.
Storm names[]
The following names were used for named storms that formed in the northeast Pacific in 2006.[122] The same list was used in the 2000 season. There were no names retired from the northeast Pacific list. Therefore, the same list was reused in the 2012 season.
|
For storms that form in the Central Pacific Hurricane Center's area of responsibility, encompassing the area between 140 degrees west and the International Date Line, names are used in a series of four rotating lists. The next four names that were slated for use in 2006 are shown below, however only the name Ioke was used.
|
|
|
Retirement[]
The name Ioke was retired from the north-central Pacific list by the World Meteorological Organization in the spring of 2007 and replaced with Iopa.[123] During the 61st Interdepartmental Hurricane Conference, the Hawaii State Civil Defense requested the retirement of the name Daniel, citing that the storm had become memorable due to threat of damage.[124] However, the request was denied, as the name remains on the tropical cyclone naming list.[122]
Season effects[]
This is a table of all the storms that formed in the 2006 Pacific hurricane season. It includes their duration, names, landfall(s), denoted in parentheses, damages, and death totals. Deaths in parentheses are additional and indirect (an example of an indirect death would be a traffic accident), but were still related to that storm. Damage and deaths include totals while the storm was extratropical, a wave, or a low, and all the damage figures are in 2006 USD.
| Saffir–Simpson scale | ||||||
| TD | TS | C1 | C2 | C3 | C4 | C5 |
| Storm name |
Dates active | Storm category
at peak intensity |
Max 1-min wind mph (km/h) |
Min. press. (mbar) |
Areas affected | Damage (USD) |
Deaths | Ref(s)
| ||
|---|---|---|---|---|---|---|---|---|---|---|
| Aletta | May 27 – 30 | Tropical storm | 45 (75) | 1002 | None | Minimal | None | |||
| Two-E | June 3–5 | Tropical depression | 35 (55) | 1005 | Southwestern Mexico, Western Mexico | Minimal | None | |||
| Bud | July 11–16 | Category 3 hurricane | 125 (205) | 953 | Hawaii | None | None | |||
| Carlotta | July 12–16 | Category 1 hurricane | 85 (140) | 981 | None | None | None | |||
| Daniel | July 16–26 | Category 4 hurricane | 150 (240) | 933 | Hawaii | None | None | |||
| Emilia | July 21–28 | Tropical storm | 65 (100) | 990 | Southwestern Mexico, Western Mexico, Baja California Peninsula, Southwestern United States | Minimal | None | |||
| Fabio | July 31 – August 3 | Tropical storm | 50 (85) | 1000 | None | None | None | |||
| Gilma | August 1–3 | Tropical storm | 40 (65) | 1004 | None | None | None | |||
| Hector | August 15–23 | Category 2 hurricane | 110 (175) | 966 | None | None | None | |||
| Ioke | August 20–27,[nb 3] | Category 5 hurricane | 160 (260) | 915 | Johnston Atoll, Wake Island, Minamitorishima, Southern Alaska | $88 million | None | |||
| Ileana | August 21–27 | Category 3 hurricane | 125 (205) | 951 | Socorro Island | Minimal | 1 | |||
| John | August 28 – September 4 | Category 4 hurricane | 130 (215) | 948 | Guerrero, Michoacán, Baja California Sur, Arizona, California, New Mexico, Texas | $60.9 million | 5 | |||
| Kristy | August 30 – September 8 | Category 1 hurricane | 80 (130) | 985 | None | None | None | |||
| Lane | September 13–17 | Category 3 hurricane | 125 (205) | 952 | Southwestern Mexico, Western Mexico, Northwestern Mexico, Southwestern United States | $203 million | 4 | |||
| Miriam | September 16–18 | Tropical storm | 45 (75) | 999 | None | None | None | |||
| Two-C | September 19–20 | Tropical depression | 35 (55) | 1007 | None | None | None | |||
| Three-C | September 26–27 | Tropical depression | 35 (55) | 1008 | None | None | None | |||
| Norman | October 9–15 | Tropical storm | 50 (85) | 1000 | Southwestern Mexico,[nb 4] Western Mexico | Minimal | None | |||
| Olivia | October 9–12 | Tropical storm | 45 (75) | 1000 | None | None | None | |||
| Four-C | October 13–14 | Tropical depression | 35 (55) | 1007 | None | None | None | |||
| Paul | October 21–26 | Category 2 hurricane | 105 (165) | 970 | Oaxaca, Guerrero, Baja California Sur, Sinaloa | $3.2 million | 4 | |||
| Eighteen-E | October 26–27 | Tropical depression | 35 (55) | 1007 | None | None | None | |||
| Rosa | November 8–10 | Tropical storm | 40 (65) | 1002 | None | None | None | |||
| Twenty-E | November 11 | Tropical depression | 35 (55) | 1007 | None | None | None | |||
| Sergio | November 13–20 | Category 2 hurricane | 110 (175) | 965 | Guerrero | None | None | |||
| Season aggregates | ||||||||||
| 25 systems | May 27 – November 20 | 160 (260) | 915 | $355 million | 14 | |||||
See also[]
- Tropical cyclones in 2006
- List of Pacific hurricanes
- Pacific hurricane season
- 2006 Atlantic hurricane season
- 2006 Pacific typhoon season
- 2006 North Indian Ocean cyclone season
- South-West Indian Ocean cyclone seasons: 2005–06, 2006–07
- Australian region cyclone seasons: 2005–06, 2006–07
- South Pacific cyclone seasons: 2005–06, 2006–07
Notes[]
- ^ The totals represent the sum of the squares for every (sub)tropical storm's intensity of over 33 knots (38 mph, 61 km/h), divided by 10,000. Calculations are provided at Talk:2006 Pacific hurricane season/ACE calcs.
- ^ Rainfall totals are rounded to the nearest 1/100th of an inch and to the nearest millimetre.
- ^ Though Hurricane Ioke did not make landfall, its strike on Wake Island is included in the table, due to the severe damage on the island.
- ^ In its report on Tropical Storm Norman, the National Hurricane Center did not specify whether the storm moved ashore or not. However, in its report to the World Meteorological Organization, officials from Mexico included Norman in the storms that moved ashore along the country.
References[]
- ^ a b Hurricane Research Division (2007). "Hurricane Data for Pacific Hurricanes 1949–2006". National Oceanic and Atmospheric Administration. Archived from the original on March 9, 2010. Retrieved February 13, 2007.
- ^ Climate Prediction Center, NOAA (May 22, 2006). "Background Information: East Pacific Hurricane Season". National Oceanic and Atmospheric Administration. Archived from the original on May 19, 2009. Retrieved May 24, 2006.
- ^ a b c Climate Prediction Center, NOAA (May 22, 2006). "NOAA Expects Below Average 2006 East Pacific Hurricane Season". National Oceanic and Atmospheric Administration. Archived from the original on February 21, 2011. Retrieved May 22, 2006.
- ^ Central Pacific Hurricane Center, NOAA (May 22, 2006). "NOAA Announces Central Pacific Hurricane Season Outlook". National Oceanic and Atmospheric Administration. Archived from the original on February 21, 2011. Retrieved June 10, 2006.
- ^ Jack Beven (May 15, 2006). "Tropical Weather Outlook". National Hurricane Center. Retrieved September 4, 2008.[permanent dead link]
- ^ Central Pacific Hurricane Center (July 2, 2008). "Mission Statement". Archived from the original on February 21, 2011. Retrieved September 4, 2008.
- ^ a b c d e f g National Hurricane Center; Hurricane Research Division; Central Pacific Hurricane Center. "The Northeast and North Central Pacific hurricane database 1949–2019". United States National Oceanic and Atmospheric Administration's National Weather Service. Retrieved October 1, 2020. A guide on how to read the database is available here.
- ^ Beven; et al. (July 1, 2007). "June Monthly Weather Tropical Summary". National Hurricane Center. Archived from the original on September 22, 2008. Retrieved September 5, 2008.
- ^ a b c d e f g h i j k Andy Nash; Tim Craig; Sam Houston; Roy Matsuda; Jeff Powell; Ray Tanabe; Jim Weyman (July 2007). Overview of the 2006 Central North Pacific Tropical Cyclone Season (PDF) (Report). Central Pacific Hurricane Center. Archived (PDF) from the original on June 9, 2019. Retrieved June 9, 2019.
- ^ Pasch; et al. (December 1, 2006). "Summary of the 2006 Pacific Hurricane Season". National Hurricane Center. Archived from the original on September 23, 2008. Retrieved October 3, 2008.
- ^ RAIV Hurricane Committee (2007). "Final Report of the Twenty-Ninth Session" (PDF). World Meteorological Organization. Archived (PDF) from the original on December 17, 2008. Retrieved November 17, 2008.
- ^ Blake, Eric S; Gibney, Ethan J; Brown, Daniel P; Mainelli, Michelle; Franklin, James L; Kimberlain, Todd B; Hammer, Gregory R (2009). Tropical Cyclones of the Eastern North Pacific Basin, 1949–2006 (PDF). United States National Oceanic and Atmospheric Administration. Archived (PDF) from the original on January 9, 2014. Retrieved May 27, 2012.
- ^ David Herring (November 2, 2006). "Subtropical Storm off the Coast of Oregon". NASA. Archived from the original on February 21, 2011. Retrieved December 11, 2007.
- ^ a b c d Richard J. Pasch (2006). "Tropical Storm Aletta Tropical Cyclone Report" (PDF). National Hurricane Center. Retrieved September 2, 2008.
- ^ Avila (2006). "Tropical Depression One Discussion Number 1". National Hurricane Center. Archived from the original on October 2, 2015. Retrieved September 2, 2008.
- ^ Richard Pasch (June 1, 2006). "May Tropical Weather Summary". National Hurricane Center. Archived from the original on December 15, 2013. Retrieved June 1, 2006.
- ^ James Franklin (June 28, 2006). "Tropical Storm Aletta Discussion Number 7". National Hurricane Center. Archived from the original on October 2, 2015. Retrieved June 22, 2018.
- ^ a b Alberto Hernández Unzón; M. G. Cirilo Bravo Lujano (2007). "Resúmen de la Tormenta Tropical Aletta del Océano Pacífico" (PDF) (in Spanish). Servicio Meteorologico Nacional, Comisión Nacional del Agua. Archived from the original (PDF) on February 27, 2012. Retrieved September 9, 2006.
- ^ Staff Writer (2006). "Afecta tormenta Aletta a Guerrero". El Siglo De Torreón (in Spanish). Retrieved September 2, 2008.
- ^ a b c Lixion Avila (July 5, 2006). "Tropical Depression Two-E Tropical Cyclone Report" (PDF). National Hurricane Center. Retrieved November 29, 2008.
- ^ Alberto Hernández Unzón; Cirilo Bravo Lujano (2006). "Resumen de la Depresión Tropical 2E del Océano Pacifico" (PDF) (in Spanish). Servicio Meteorológico Nacional. Archived from the original (PDF) on February 27, 2012. Retrieved November 29, 2008.
- ^ Juan Cervantes y Laura Reyes (June 5, 2006). "Amenaza depresión tropical pasar a ciclón". El Universal (in Spanish). Archived from the original on January 2, 2014. Retrieved November 29, 2008.
- ^ a b c d e f Richard D. Knabb (2006). "Tropical Cyclone Report: Hurricane Bud" (PDF). National Hurricane Center. Retrieved October 10, 2008.
- ^ Kinberlain & Roth (2006). "Tropical Storm Bud Discussion Number 4". National Hurricane Center. Archived from the original on October 2, 2015. Retrieved October 10, 2008.
- ^ Knabb (2006). "Hurricane Bud Discussion Number 7". National Hurricane Center. Archived from the original on October 2, 2015. Retrieved October 10, 2008.
- ^ Knabb (2006). "Hurricane Bud Discussion Number 11". National Hurricane Center. Archived from the original on October 2, 2015. Retrieved October 10, 2008.
- ^ Roberts & Beven (2006). "Hurricane Bud Discussion Number 14". National Hurricane Center. Archived from the original on October 2, 2015. Retrieved October 10, 2008.
- ^ a b Kevin R. Kodama (2006). "July 2006 Hawaii Precipitation Summary". Honolulu National Weather Service. Archived from the original on September 29, 2006. Retrieved November 17, 2008.
- ^ a b c d e f g h James Franklin (September 4, 2006). "Hurricane Carlotta Tropical Cyclone Report" (PDF). National Hurricane Center. Retrieved November 30, 2008.
- ^ Richard Pasch (July 12, 2006). "Tropical Storm Carlotta Discussion Four". National Hurricane Center. Archived from the original on October 16, 2012. Retrieved November 30, 2008.
- ^ Blake/Knabb (July 13, 2006). "Hurricane Carlotta Discussion Six". National Hurricane Center. Archived from the original on October 16, 2012. Retrieved November 30, 2008.
- ^ Jack Beven (July 14, 2006). "Hurricane Carlotta Discussion Nine". National Hurricane Center. Archived from the original on October 16, 2012. Retrieved November 30, 2008.
- ^ Rhome/Avila (July 15, 2006). "Tropical Storm Carlotta Discussion Sixteen". National Hurricane Center. Archived from the original on October 16, 2012. Retrieved November 30, 2008.
- ^ a b c Jack Beven (2006). "Hurricane Daniel Tropical Cyclone Report" (PDF). National Hurricane Center. Retrieved July 18, 2007.
- ^ Daniel Brown (2006). "Hurricane Daniel Discussion Sixteen". National Hurricane Center. Archived from the original on July 4, 2018. Retrieved December 28, 2007.
- ^ a b c d Stacy R. Stewart (December 11, 2006). "Tropical Storm Emilia Tropical Cyclone Report" (PDF). National Hurricane Center. Retrieved September 13, 2008.
- ^ Stacy Stewart (July 22, 2006). "Tropical Storm Emilia Discussion Nine". National Hurricane Center. Archived from the original on March 6, 2016. Retrieved September 14, 2008.
- ^ Tucson, Arizona National Weather Service (2006). "Review of July 25, 2006 Severe thunderstorm and Flash flood event". Archived from the original on March 6, 2012. Retrieved September 19, 2008.
- ^ Staff Writer (July 30, 2006). "Horse fire declared fully contained". San Diego Union Tribune. Archived from the original on July 23, 2016. Retrieved September 19, 2008.
- ^ a b Jamie R. Rhome (September 13, 2006). "Tropical Storm Fabio Tropical Cyclone Report" (PDF). National Hurricane Center. Retrieved September 24, 2009.
- ^ Kevin R. Kodama (September 6, 2006). "August 2006 Precipitation Summary in the State of Hawaii". Honolulu National Weather Service. Archived from the original on August 1, 2008. Retrieved September 24, 2008.
- ^ Stuart Hinson (2006). "Event Report for Hawaii". National Climatic Data Center. Archived from the original on May 20, 2011. Retrieved September 25, 2008.
- ^ a b c Michelle Mainelli (2006). "Tropical Storm Gilma Tropical Cyclone Report" (PDF). National Hurricane Center. Retrieved September 21, 2008.
- ^ Brennan/Stewart (2006). "Tropical Depression Eight-E Discussion Number 2". National Hurricane Center. Archived from the original on October 17, 2012. Retrieved September 21, 2008.
- ^ a b Daniel P. Brown (September 28, 2006). "Tropical Cyclone Report: Hurricane Hector" (PDF). National Hurricane Center. Retrieved December 1, 2007.
- ^ Brown/Stewart (2006). "Tropical Depression 09-E Discussion Number 22". National Hurricane Center. Archived from the original on December 15, 2013. Retrieved January 7, 2009.
- ^ Pasch/Fiorino (2006). "Tropical Depression 09-E Discussion Number 23". National Hurricane Center. Archived from the original on December 15, 2013. Retrieved January 7, 2009.
- ^ Pasch/Fiorino (2006). "Tropical Depression 09-E Discussion Number 27". National Hurricane Center. Archived from the original on December 15, 2013. Retrieved January 7, 2009.
- ^ Roberts/Stewart (2006). "Tropical Depression 09-E Discussion Number 30". National Hurricane Center. Archived from the original on December 15, 2013. Retrieved January 7, 2009.
- ^ Joint Typhoon Warning Center (2007). "Super Typhoon 01C". Archived from the original on June 7, 2011. Retrieved October 10, 2007.
- ^ Cattle Network (2006). "National Weather early for September 2006". Archived from the original on September 27, 2007. Retrieved September 14, 2006.
- ^ Leone, Diana (August 23, 2006). "Hawaiian-named storm hits Johnston Isle". Star Bulletin. Archived from the original on May 16, 2008. Retrieved August 25, 2006.
- ^ Andrew Leonhard (August 29, 2006). "Wake evacuated – Airmen airlift 188 from Pacific Island". Air Force Print News. Archived from the original on February 21, 2011. Retrieved October 14, 2007.
- ^ "Wake Island evacuated as Super Typhoon Ioke closes in". Anchorage Daily News. Associated Press. 2006. Archived from the original on May 26, 2008. Retrieved October 31, 2008.
- ^ Advisory Council for Historic Preservation (2007). "Spring 2007 Case Digest — Protecting Historic Properties" (PDF). p. 17. Archived from the original (PDF) on April 15, 2010. Retrieved April 15, 2010.
- ^ National Climatic Data Center (2006). "Event Report for Alaska". Archived from the original on April 15, 2010. Retrieved April 15, 2010.
- ^ a b c d e Eric Blake (October 4, 2006). "Hurricane Ileana Tropical Cyclone Report" (PDF). National Hurricane Center. Retrieved December 15, 2008.
- ^ Jamie Rhome (August 22, 2006). "Hurricane Ileana Discussion Six". National Hurricane Center. Archived from the original on March 18, 2016. Retrieved January 1, 2009.
- ^ Tropical Rainfall Measuring Mission data (2007). "Rainfall from Ileana". National Aeronautics and Space Administration. Archived from the original on May 30, 2008. Retrieved December 1, 2007.
- ^ Staff Writer (August 23, 2006). "Hurricane Ileana brings heavy rainfall to Mexico". Deutsche Presse-Agentur. Archived from the original on September 4, 2012. Retrieved January 1, 2009.
- ^ "Man drowns after swim during storm" (PDF). Associated Press. August 26, 2006. Archived from the original (PDF) on March 4, 2016. Retrieved January 1, 2009.
- ^ Pasch/Fiorino (August 23, 2006). "Hurricane Ileana Discussion Eight". National Hurricane Center. Archived from the original on March 25, 2016. Retrieved January 1, 2009.
- ^ Pasch/Fiorino (August 24, 2006). "Hurricane Ileana Discussion Twelve". National Hurricane Center. Archived from the original on March 25, 2016. Retrieved January 1, 2009.
- ^ a b c d Richard J. Pasch (2006). "Hurricane John Tropical Cyclone Report" (PDF). National Hurricane Center. Retrieved November 15, 2006.
- ^ Mainelli/Pasch (2006). "Hurricane John Discussion Ten". National Hurricane Center. Archived from the original on October 17, 2012. Retrieved August 30, 2006.
- ^ Rhome/Beven (2006). "Hurricane John Discussion Eleven". National Hurricane Center. Archived from the original on October 17, 2012. Retrieved August 30, 2006.
- ^ Mainelli/Pasch (2006). "Hurricane John Discussion Fourteen". National Hurricane Center. Archived from the original on October 17, 2012. Retrieved August 31, 2006.
- ^ Jack Beven (2006). "Hurricane John Discussion Nineteen". National Hurricane Center. Archived from the original on October 17, 2012. Retrieved September 2, 2006.
- ^ International Federation of Red Cross And Red Crescent Societies (August 30, 2006). "Mexico: Hurricane John Information Bulletin No. 1". ReliefWeb. Archived from the original on September 5, 2006. Retrieved January 20, 2007.
- ^ Servicio Meteorológico Nacional (2006). "Resumen del Huracan "John" del Océano Pacífic" (PDF) (in Spanish). Archived from the original (PDF) on February 27, 2012. Retrieved April 29, 2010.
- ^ Antonio Alcantar (2006). "Hurricane John whips Mexico's Baja, power cut". Reuters. Retrieved September 2, 2006.
- ^ Staff Writer (2006). "Hurricane John leaves four dead, two missing in Mexico". Agence France-Presse. Archived from the original on September 5, 2006. Retrieved September 5, 2006.
- ^ Staff Writer (2006). "Remnants of John could soak U.S. southwest". United Press International. Archived from the original on July 19, 2011. Retrieved September 5, 2006.
- ^ Fabiola Martinez (September 21, 2006). "Seis muertos y 2 desaparecidos por las lluvias en Durango y Tamaulipas" (in Spanish). LaJornada. Archived from the original on December 15, 2013. Retrieved September 23, 2006.
- ^ Staff Writer (September 4, 2006). "After-Effects of Hurricane John Soak Texas, New Mexico". Associated Press. Archived from the original on October 14, 2012. Retrieved September 6, 2006.
- ^ National Climatic Data Center (2006), Event Report for New Mexico, National Oceanic and Atmospheric Administration
- ^ Staff Writer (September 1, 2006). "Remnants of Hurricane John caused flooding, mudslides in California and elsewhere in Southwest". Moscow-Pullman Daily News. Associated Press. Archived from the original on May 12, 2016. Retrieved April 24, 2010.
- ^ a b c d e f g Lixion Avila (October 12, 2006). "Hurricane Kristy Tropical Cyclone Report" (PDF). National Hurricane Center. Retrieved November 17, 2008.
- ^ Richard Pasch (August 30, 2006). "Tropical Storm Kristy Discussion Four". National Hurricane Center. Retrieved November 18, 2008.
- ^ Beven; et al. (September 1, 2006). "Hurricane Kristy Discussion Nine". National Hurricane Center. Retrieved November 20, 2008.
- ^ Mainelli/Avila (September 1, 2006). "Tropical Storm Kristy Discussion Eleven". National Hurricane Center. Retrieved November 20, 2008.
- ^ Fiorino/Avila (September 2, 2006). "Tropical Storm Kristy Discussion Fifteen". National Hurricane Center. Retrieved November 20, 2008.
- ^ Fiorino/Franklin (September 3, 2006). "Tropical Storm Kristy Discussion Twenty". National Hurricane Center. Retrieved November 21, 2008.
- ^ Robbie Blake; Stacy Stewart (September 5, 2006). "Tropical Storm Kristy Discussion Twenty-Seven". National Hurricane Center. Retrieved November 21, 2008.
- ^ Roberts/Franklin (September 6, 2006). "Tropical Depression Kristy Discussion Thirty-Two". National Hurricane Center. Retrieved November 21, 2008.
- ^ Richard Knabb (2006). "Hurricane Lane Tropical Cyclone Report" (PDF). National Hurricane Center. Retrieved November 30, 2006.
- ^ Staff Writer (September 15, 2006). "Tropical Storm Lane lashes Mexico's Pacific coast, heads toward Baja". McCook Daily Gazette. Associated Press. Archived from the original on May 10, 2016. Retrieved April 24, 2010.
- ^ a b Coordinación General de Asesoria y Políticas Públicas Gobierno del Estato (2006). "Sociedad y gobierno unidos ante los daños del Huracán Lane" (in Spanish). Archived from the original on February 18, 2012. Retrieved September 5, 2007.
- ^ Valdez Cardenas, Javier; Leon, Raymundo (September 24, 2006). "En Sinaloa, los daños por Lane suman 1,200 millones de pesos". La Jornada (in Spanish). Archived from the original on October 4, 2012. Retrieved October 3, 2006.
- ^ James Franklin (2006). "Tropical Storm Miriam Tropical Cyclone Report" (PDF). National Hurricane Center. Retrieved October 3, 2006.
- ^ Tanabe/Houston (September 19, 2006). "Tropical Depression Two-C Discussion Three". Central Pacific Hurricane Center. Archived from the original on June 14, 2012. Retrieved April 15, 2010.
- ^ a b Jack Beven (November 30, 2006). "Tropical Cyclone Report: Tropical Storm Norman" (PDF). National Hurricane Center. Retrieved December 4, 2006.
- ^ Servicio Meteorológico Nacional (2006). "Resumen de la Tormenta Tropical "Norman" Del Océano Pacífico" (PDF) (in Spanish). Archived from the original (PDF) on February 27, 2012. Retrieved August 31, 2008.
- ^ Juan Cervantes Gómez (October 16, 2006). "Suspenden clases en Acapulco por tormenta tropical "Norman"". El Universal (in Spanish). Archived from the original on January 2, 2014. Retrieved August 31, 2008.
- ^ a b c Staff Writer (October 17, 2006). "Desbordan lluvias ríos en Guerrero" (in Spanish). La Journada. Archived from the original on January 12, 2013. Retrieved August 31, 2008.
- ^ a b c Stacy R. Stewart (2006). "Tropical Storm Olivia Tropical Cyclone Report" (PDF). National Hurricane Center. Retrieved November 26, 2008.
- ^ James Franklin (2006). "Tropical Depression 16-E Discussion Number 1". National Hurricane Center. Archived from the original on October 18, 2012. Retrieved November 26, 2008.
- ^ Richard Pasch (2006). "Tropical Storm Olivia Discussion Number 6". National Hurricane Center. Archived from the original on October 18, 2012. Retrieved November 26, 2008.
- ^ Knabb/Willis (2006). "Tropical Depression Olivia Discussion Number 7". National Hurricane Center. Archived from the original on October 18, 2012. Retrieved November 26, 2008.
- ^ Andy Nash (October 13, 2006). "Tropical Depression Four-C Discussion One". Central Pacific Hurricane Center. Archived from the original on March 20, 2012. Retrieved January 5, 2009.
- ^ Federal Emergency Management Agency (October 17, 2006). "National Situation Update". Archived from the original on July 3, 2012. Retrieved January 5, 2009.
- ^ Jamie R. Rhome; Robert J. Berg (November 20, 2006). "Hurricane Paul Tropical Cyclone Report" (PDF). National Hurricane Center. Retrieved March 31, 2009.
- ^ Mark Stevenson (October 25, 2006). "Tropical Storm Paul Weakens". The Washington Post. Associated Press. Archived from the original on October 24, 2012. Retrieved October 26, 2006.
- ^ Staff Writer (October 26, 2006). "Hurricane Paul kills two in northwestern Mexico". Reuters. Archived from the original on March 3, 2016. Retrieved November 21, 2008.
- ^ Alex Morales (October 26, 2006). "Tropical Depression Paul Rains on Mexico, Weakens Over Land". Bloomberg.com. Archived from the original on October 27, 2006. Retrieved October 26, 2006.
- ^ Consejo Directivo del Instituto Sinaloense de Acuacultura (2006). "Acta de la Sesión Ordinaria del Consejo Directivo del Instituto Sinaloense de Actuaculture, Celebrada el Día 10 de Noviembre de 2006, en la Ciudad de Culiacán, Sinaloa" (in Spanish). Archived from the original (DOC) on February 18, 2012. Retrieved November 17, 2008.
- ^ a b Michelle Mainelli (November 13, 2006). "Abbreviated Tropical Cyclone Report: Tropical Depression Eighteen-E" (PDF). National Hurricane Center. Retrieved December 1, 2007.
- ^ a b Jack Beven (October 26, 2006). "Tropical Depression Eighteen-E Discussion One". National Hurricane Center. Archived from the original on October 18, 2012. Retrieved March 19, 2009.
- ^ Blake/Pasch (October 27, 2006). "Tropical Depression Eighteen-E Discussion Three". National Hurricane Center. Archived from the original on October 18, 2012. Retrieved March 19, 2009.
- ^ Jack Beven (October 27, 2006). "Tropical Depression Eighteen-E Discussion Five". National Hurricane Center. Archived from the original on October 18, 2012. Retrieved March 19, 2009.
- ^ a b c d Daniel P. Brown (2006). "Tropical Storm Rosa Tropical Cyclone Report" (PDF). National Hurricane Center. Retrieved March 30, 2009.
- ^ Stacy Stewart (2006). "Tropical Depression Nineteen-E Discussion Number 1". National Hurricane Center. Archived from the original on October 18, 2012. Retrieved October 15, 2008.
- ^ Eric Blake (2006). "Tropical Depression Nineteen-E Discussion Number 3". National Hurricane Center. Archived from the original on October 18, 2012. Retrieved October 15, 2008.
- ^ a b Stacy Stewart (2006). "Tropical Depression Nineteen-E Discussion Number 5". National Hurricane Center. Archived from the original on October 18, 2012. Retrieved October 15, 2008.
- ^ Daniel Brown (2006). "Tropical Depression Nineteen-E Discussion Number 4". National Hurricane Center. Archived from the original on October 18, 2012. Retrieved October 15, 2008.
- ^ a b Eric S. Blake (November 16, 2006). "Tropical Depression Twenty-E Tropical Cyclone Report" (PDF). National Hurricane Center. Retrieved March 19, 2009.
- ^ Stacy Stewart (November 11, 2006). "Tropical Depression Twenty-E Discussion One". National Hurricane Center. Archived from the original on February 24, 2014. Retrieved March 19, 2009.
- ^ a b Richard Pasch; David Roberts (2006). "Hurricane Sergio Tropical Cyclone Report" (PDF). National Hurricane Center. Retrieved February 13, 2007.
- ^ Servicio Meteorológico Nacional (2006). "Resumen del Huracan "Sergio" del Océano Pacífic" (PDF) (in Spanish). Archived from the original (PDF) on December 9, 2013. Retrieved February 13, 2007.
- ^ "Subtropical Storm off the Coast of Oregon". NASA. November 2, 2006. Archived from the original on September 8, 2015. Retrieved September 30, 2017.
- ^ "Thingamabobbercane revisited". Jeff Masters' Blog. Weather Underground. November 8, 2006. Archived from the original on September 30, 2017. Retrieved September 30, 2017.
- ^ a b National Hurricane Center (2008). "Worldwide Tropical Cyclone Names". National Oceanic and Atmospheric Administration. Archived from the original on September 8, 2010. Retrieved May 14, 2008.
- ^ Dennis H. McCarthy (2007). "National Weather Service Instruction Tropical Cyclone Names and Pronunciation Guide" (PDF). Archived from the original (PDF) on September 10, 2008. Retrieved December 29, 2007.
- ^ Interdepartmental Hurricane Conference (2007). "The Nation's Hurricane Program: An Interagency Success Story" (PDF). Archived from the original (PDF) on March 10, 2009. Retrieved December 29, 2007.
External links[]
- National Hurricane Center's Eastern Pacific Tropical Weather Outlook – updated four times daily
- National Hurricane Center
- National Hurricane Center's 2006 Advisory Archive
- Central Pacific Hurricane Center
Tropical cyclones of the 2006 Pacific hurricane season | ||
|---|---|---|
 | ||
| ||
- 2006 Pacific hurricane season
- Pacific hurricane seasons
- Tropical cyclones in 2006