2006 Atlantic hurricane season
| 2006 Atlantic hurricane season | |
|---|---|
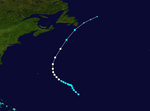
 Season summary map | |
| Seasonal boundaries | |
| First system formed | June 10, 2006 |
| Last system dissipated | October 2, 2006 |
| Strongest storm | |
| Name | Gordon and Helene |
| • Maximum winds | 120 mph (195 km/h) (1-minute sustained) |
| • Lowest pressure | 955 mbar (hPa; 28.2 inHg) |
| Seasonal statistics | |
| Total depressions | 10 |
| Total storms | 10 |
| Hurricanes | 5 |
| Major hurricanes (Cat. 3+) | 2 |
| Total fatalities | 14 total |
| Total damage | $504.42 million (2006 USD) |
| Related articles | |
The 2006 Atlantic hurricane season was the least active since 1997 as well as the first season since 2001 in which no hurricanes made landfall in the United States, and was the first since 1994 in which no tropical cyclones formed during October.[1] Following the intense activity of 2003, 2004, and 2005, forecasters predicted that the 2006 season would be only slightly less active. Instead activity was slowed by a rapidly forming moderate El Niño event, the presence of the Saharan Air Layer over the tropical Atlantic, and the steady presence of a robust secondary high-pressure area to the Azores high centered on Bermuda. There were no tropical cyclones after October 2.[2]
Tropical Storm Alberto was indirectly responsible for two deaths when it made landfall in Florida. Hurricane Ernesto caused heavy rainfall in Haiti, and directly killed at least seven in Haiti and the United States. Four hurricanes formed after Ernesto, including the strongest storms of the season, Hurricanes Helene and Gordon. In total, the season was responsible for 14 deaths and $500 million (2006 USD; $642 million 2021 USD) in damage. The calendar year 2006 also saw Tropical Storm Zeta, which arose in December 2005 and persisted until early January, only the second such event on record. The storm can be considered a part of the 2005 and 2006 seasons, although it occurred outside the June 1 – November 30 period during which most Atlantic basin tropical cyclones form.
Seasonal forecasts[]
Forecasts of hurricane activity are issued before each hurricane season by noted hurricane experts Philip J. Klotzbach, Dr. William M. Gray, and their associates at Colorado State University; and separately by NOAA forecasters.
Klotzbach's team (formerly led by Gray) has defined the average number of storms per season (1950–2000) as 9.6 tropical storms, 5.9 hurricanes, and 2.3 major hurricanes (storms exceeding Category 3 strength in the Saffir–Simpson scale). A normal season, as defined by NOAA, has 6–14 named storms, with 4–8 of those reaching hurricane strength, and 1–3 major hurricanes.[3][4]
| Source | Date | Named storms |
Hurricanes | Major hurricanes |
| CSU | Average (1950–2000)[3] | 9.6 | 5.9 | 2.3 |
| NOAA | Average[5] | 6–14 | 4–8 | 1–3 |
| Record high activity from 1950–2006 | 28 | 15 | 7 | |
| Record low activity from 1950–2006 | 4 | 2 | 0 | |
| CSU | December 5, 2005 | 17 | 9 | 5 |
| CSU | April 4, 2006 | 17 | 9 | 5 |
| NOAA | May 22, 2006 | 13–16 | 8–10 | 4–6 |
| CSU | May 31, 2006 | 17 | 9 | 5 |
| CSU | August 3, 2006 | 15 | 7 | 3 |
| NOAA | August 8, 2006 | 12–15 | 7–9 | 3–4 |
| CSU | September 1, 2006 | 13 | 5 | 2 |
| CSU | October 3, 2006 | 11 | 6 | 2 |
| Actual activity | 10 | 5 | 2 | |
Pre-season forecasts[]
On December 5, 2005, Klotzbach's team issued its initial extended-range forecast for the 2006 season, predicting an above average of 17 named storms, nine of them hurricanes, and five classified as Category 3 intensity or higher.[3]
As in the 2005 season, the team predicted it was highly probable that at least one major hurricane would directly impact the United States. The forecast suggested an 81% probability that at least one major hurricane would strike the U.S. mainland, a 64% chance of at least one major hurricane striking the East Coast of the United States (including the Florida peninsula), and a 47% chance of at least one major hurricane striking the Gulf Coast of the United States from the Florida Panhandle westward. The team also predicted that the potential for major hurricane activity in the Caribbean was above average. A few months later, on April 4, 2006, CSU issued another forecast confirming its December predictions.[6]
On May 22, 2006, NOAA released its pre-season forecast for the 2006 season. The prediction was for 13–16 named storms, 8–10 of those becoming hurricanes, and 4–6 becoming major hurricanes.[7]
On May 31, 2006, Klotzbach's team released its final pre-season forecast for 2006, confirming its earlier prediction.[8]
Midseason outlooks[]
On August 3, 2006, Klotzbach's team lowered its season estimate to 15 named storms, with 7 becoming hurricanes and 3 becoming major hurricanes, noting that conditions had become less favorable for storms than they had been earlier in the year. The sea-level pressure and trade wind strength in the tropical Atlantic were reported to be above normal, while sea surface temperature anomalies were on a decreasing trend.[9]
On August 8, 2006, NOAA revised its season estimate to 12–15 named storms, with 7–9 becoming hurricanes, and 3–4 becoming major hurricanes. The reduction was attributed to less favorable environmental conditions, a decrease in La Niña conditions, and the lack of a "very persistent upper-level ridge pattern over the eastern U.S. and western Atlantic"[10]
On September 1, Klotzbach's team also revised its season estimate, to 13 named storms, 5 hurricanes, and 2 major hurricanes, citing a larger volume of the Saharan Air Layer and an El Niño trend in the Pacific.[11] The team again reduced the number of tropical storms expected for the season a month later, on October 3, with an updated forecast of 11 named storms, 6 hurricanes, and 2 major hurricanes, citing the ongoing El Niño.[12]
Seasonal summary[]


Tropical Storm Zeta formed on December 30, 2005, and lasted until January 6, 2006. Although the majority of its existence was spent in 2006, it is officially a storm of the 2005 Atlantic hurricane season because that is the year in which it formed. Zeta joined Hurricane Alice as only the second North Atlantic tropical cyclone in recorded history to span two calendar years.[13]
The season started on June 1, 2006, and officially ended on November 30, 2006. These dates conventionally delimit the period of each year when most tropical cyclones form in the Atlantic basin.[14] Ten days into the start of the season, Tropical Storm Alberto developed in the Caribbean,[15] and after four months of activity, Hurricane Isaac dissipated on October 3 south of Newfoundland.[16] Compared to the devastating 2005 Atlantic hurricane season, 2006 was not severe in terms of deaths and damage. Three tropical storms made landfall in the United States. The first of them, Tropical Storm Alberto, made landfall in Florida with winds of 50 mph (80 km/h), causing flooding and light damage.[15] Tropical Storm Beryl made landfall on Nantucket, but left little impact.[17] The third and more significant storm was Hurricane Ernesto, which killed two people in Virginia and two in Florida, as well as causing $500 million in damage (2006 USD).[18] During the season, only one tropical cyclone in the Atlantic – Alberto – affected Mexico.[19] Canada was affected by several tropical cyclones during 2006, including Alberto, the unnamed storm, Beryl, Florence, and Isaac.[20]
On June 20, an upper-level disturbance formed east of the Bahamas and moved westward across the islands. Between June 24 and 26, areas of convection developed occasionally, and a low-level disturbance formed. The system turned northward and upon reaching the Gulf Stream on June 27, it began to mature. It made landfall near Morehead City, North Carolina and moved northeastward along the U.S. East Coast. The storm contributed to severe and deadly flooding in the Mid-Atlantic States. While the NHC did not operationally classify it, data from reconnaissance aircraft, NEXRAD weather radar, and surface observations suggest it may have met the criteria for a tropical cyclone.[21]
The National Hurricane Center's pre-season activity outlook predicted 13–16 named storms, 8–10 hurricanes and 4–6 major hurricanes.[7] They also predicted a high risk of at least one major hurricane strike to the Southeast United States. In the event, only ten storms formed during the season, the lowest number since the 1997 season, when there were seven. Five of the ten storms developed into hurricanes— the lowest number since 2002– only two attained major hurricane status, tying with 2002 for the fewest since 1997. Only one named storm was observed during October, the lowest number since 1994, when none were seen during that month. Additionally, only three named storms made landfall in the United States, the fewest since 2001.[2] Because of several factors, including a rapidly forming El Niño event, the Saharan Air Layer over the tropical Atlantic and the presence of a high-pressure area to the Azores high situated near Bermuda, it contributed to a below average season.[7] Also, sea surface temperatures in the western Atlantic were just at or slightly below average. In contrast, sea surface temperatures during the 2005 season were well above average.[22]
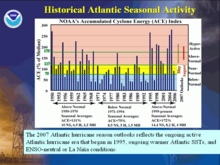
Overall, the season's activity was reflected with a low cumulative accumulated cyclone energy (ACE) rating of 79.[23] ACE is, broadly speaking, a measure of the power of the hurricane multiplied by the length of time it existed, so storms that last a long time, as well as particularly strong hurricanes, have high ACEs. ACE is only calculated for full advisories on tropical systems at or exceeding 34 knots (39 mph, 63 km/h) or tropical storm strength. Subtropical cyclones are excluded from the total.[24]
Systems[]
Tropical Storm Alberto[]
| Tropical storm (SSHWS) | |
  | |
| Duration | June 10 – June 14 |
|---|---|
| Peak intensity | 70 mph (110 km/h) (1-min) 995 mbar (hPa) |
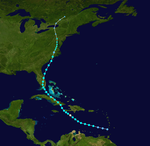
On June 10, an area of disturbed weather associated with a broad low-pressure area off the coast of Belize organized over the warm waters of the Caribbean into the first tropical depression of the season.[15] It dropped light rainfall in Mexico, with a 24-hour total peaking at 4 inches (100 mm) in Peto, Yucatán.[19] Southwesterly vertical wind shear initially prevented significant development, but as it moved closer to Florida, the depression strengthened into a tropical storm on June 11. Passing over the warm, deep water of the Loop Current allowed accelerated development, and the cyclone reached its peak winds of 70 mph (115 km/h), just shy of hurricane strength. Subsequent weakening occurred as it moved over the cooler waters of the continental shelf, and Alberto made landfall near Adams Beach, Florida, on June 14 with winds of about 45 mph (72 km/h).[15] Losing its tropical characteristics, Alberto moved northeastward and produced heavy rainfall in South Carolina and North Carolina. The remnants tracked off the East Coast and transitioned into a powerful extratropical storm which affected Nova Scotia with high winds, heavy rain, and rough surf, leaving four fisherman missing offshore.[15]
Alberto caused record rainfall in North Carolina, peaking at 8 inches (200 mm).[25] In Florida, two people died,[26] and damage was estimated at $250,000 (2006 USD).[27] Later, the storm left four sailors missing about 230 miles (370 km) south of Nova Scotia.[15]
Unnamed tropical storm[]
| Tropical storm (SSHWS) | |
  | |
| Duration | July 17 – July 18 |
|---|---|
| Peak intensity | 50 mph (85 km/h) (1-min) 998 mbar (hPa) |
A cold front exited the eastern United States on July 13 and subsequently stalled over the western Atlantic Ocean.[28] It decayed and dissipated, leaving behind two areas of low pressure.[29] The southern area near North Carolina became Tropical Storm Beryl,[30] and the northern system became an extratropical low on July 16, south-southeast of Cape Cod, Massachusetts. the system separated itself from the dissipating front later that day while moving northeastward over warm waters. Convection developed near the center, and the system transitioned into a tropical depression early on July 17, about 240 miles (390 km) southeast of Nantucket, Massachusetts.[28] Accelerating northeastward, the depression intensified into a tropical storm six hours later. Banding features became prominent, and after continued strengthening, the storm attained peak winds of 50 mph (85 km/h) late on July 17, while located about 245 miles (395 km) south of Halifax, Nova Scotia. Shortly thereafter, the storm encountered much cooler water temperatures after leaving the Gulf Stream. The storm quickly weakened as the convection rapidly diminished, and on July 18, degenerated into a non-convective remnant low. The remnants crossed Newfoundland, before turning to the east-northeast and dissipating on July 19.[28] The storm greatly weakened prior to moving across Newfoundland, and as a result, its impact was minimal.[20]
Operationally, the storm was considered as a non-tropical gale, connected to a cold front. However, a post-season analysis provided enough evidence of tropical characteristics, indicating no frontal features and no cold air intrusion at the time of peak winds. Observations analyzed the storm as having a symmetric warm-core, whereas in real time it was considered subtropical. The National Hurricane Center officially re-classified the system as an unnamed tropical storm on December 15, 2006.[28]
Tropical Storm Beryl[]
| Tropical storm (SSHWS) | |
  | |
| Duration | July 18 – July 21 |
|---|---|
| Peak intensity | 60 mph (95 km/h) (1-min) 1000 mbar (hPa) |
The same frontal system that developed the previous system spawned another low-pressure area east of North Carolina. On July 18, it developed into a tropical depression, and with associated deep convection, the storm organized sufficiently to be upgraded to Tropical Storm Beryl on July 19. It tracked northeast and passed over Nantucket before dissipating southwest of Nova Scotia on July 21.[17] Waves along the southern coast of Nantucket reached 10 feet (3.0 m) in height as the storm approached the island,[31] resulting in four people being rescued by lifeguards from rip currents.[32] The remnants of Tropical Storm Beryl dropped moderate precipitation in Atlantic Canada, with totals of up to 3.5 inches (88 mm); in some locations 1 inch (25 mm) of rain fell in an hour. Moderate winds were reported along its path, which peaked at 60 mph (96 km/h) in southern Nova Scotia.[20]
Tropical Storm Chris[]
| Tropical storm (SSHWS) | |
  | |
| Duration | August 1 – August 4 |
|---|---|
| Peak intensity | 65 mph (100 km/h) (1-min) 1001 mbar (hPa) |
In late July, a tropical wave moved off the coast of Africa and traversed the Atlantic Ocean. The associated convection organized and became a tropical depression on August 1 about 160 miles (260 km) east of Antigua. The depression tracked westward and soon intensified into Tropical Storm Chris before reaching peak winds of 65 mph (100 km/h) northeast of the United States Virgin Islands. The storm was forecast to strengthen further and become a hurricane as it moved into the Bahamas. However, Chris began to be affected by wind shear and became disorganized. The storm weakened to a tropical depression on August 4, and dissipated as it approached the Cuban coast on August 5.[33]
The storm's effects were limited to moderate rainfall in Hispaniola and Cuba. Cruise lines such as Royal Caribbean re-routed their ships to avoid the storm.[34] In Puerto Rico, rainfall from the storm caused the Fajardo River to overflow its banks. The floodwaters temporarily forced a closure of a highway in the northeastern portion of the island. Rainfall reached up to 2 inches (50 mm) across portions of Hispaniola, the Turks and Caicos, the Bahamas, and eastern Cuba, and reached 4 inches (100 mm) in some mountainous areas.[33]
Tropical Storm Debby[]
| Tropical storm (SSHWS) | |
  | |
| Duration | August 21 – August 26 |
|---|---|
| Peak intensity | 50 mph (85 km/h) (1-min) 999 mbar (hPa) |
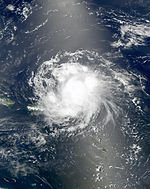
On August 20 a tropical wave emerged off the coast of Africa for the Atlantic Ocean. Immediately following, the wave developed convective banding and a broad circulation. At 1800 UTC on August 21, a tropical depression formed to the south-southeast of the Cape Verde Islands.[35] The depression was a large, well-organized system,[36] and tracking west-northwestward it intensified into Tropical Storm Debby on August 23.[37]
Later on August 23, the storm attained peak winds of 50 mph (80 km/h), which it maintained for about two days.[37] However, Debby entered a dry and stable air mass and deteriorated in organization.[38] An upper-level trough increased southerly wind shear and displaced the convection from the center. The cyclone began to weaken, and on August 26 Debby weakened to a tropical depression before degenerating into a remnant low. The circulation lasted another two days.[37]
Hurricane Ernesto[]
| Category 1 hurricane (SSHWS) | |
  | |
| Duration | August 24 – September 1 |
|---|---|
| Peak intensity | 75 mph (120 km/h) (1-min) 985 mbar (hPa) |
Hurricane Ernesto originated from a tropical wave which moved off the coast of Africa on August 18. The wave progressed westward and reached the Western Atlantic, spawning a tropical depression on August 24 near the Windward Islands. It moved west-northwestward through the Caribbean Sea and intensified into Tropical Storm Ernesto on August 25. The storm briefly attained hurricane status on August 27 to the southwest of Haiti, before land interaction caused weakening. Ernesto made landfall near Guantanamo Bay, Cuba, early in the morning on August 28 as a tropical storm. At one point the storm was predicted to become a major hurricane in the Gulf of Mexico and threaten parts of the Gulf Coast. However, Ernesto moved much farther east than anticipated, and made landfall as a tropical storm on the southern tip of Florida on August 29. Ernesto retained tropical storm strength as it crossed Florida and emerged from land near Cape Canaveral, and was just below hurricane strength when it made landfall again in North Carolina on August 31. Ernesto transitioned into an extratropical cyclone over Virginia on September 1, which ultimately dissipated over Quebec on September 4.[18]
Early in its duration, Ernesto killed five people in Haiti from rainfall. Later, two people died in Florida in traffic accidents due to slick roads. Damage was heaviest in Virginia, where heavy rains left severe flooding. Damage in the United States was estimated at $500 million (2006 USD).[18]
Hurricane Florence[]
| Category 1 hurricane (SSHWS) | |
  | |
| Duration | September 3 – September 12 |
|---|---|
| Peak intensity | 90 mph (150 km/h) (1-min) 974 mbar (hPa) |
Hurricane Florence originated on September 3 from the complex merging of two tropical waves, creating one large low-pressure area. The disturbance moved westward and became a tropical depression in the open waters of the Atlantic. On September 5, it organized further and was upgraded into Tropical Storm Florence. With a disorganized structure and multiple circulation centers, Florence remained a weak tropical storm for several days, even after external conditions became favorable for strengthening. Florence tracked west-northwest and intensified into a hurricane on September 10 while south of Bermuda. The storm passed just to the east of Bermuda as a Category 1 hurricane on the Saffir–Simpson scale as it reached its peak intensity of 90 mph (145 km/h). It moved north before losing its tropical characteristics and passing over the Canadian Maritimes as a strong extratropical storm.[39]
Large swells, rip tide, and undertow were reported on Bermuda, the Leeward Islands, the Virgin Islands, and Hispaniola.[40] Florence affected Bermuda with wind gusts up to 115 mph (185 km/h) and heavy rain which left 23,000 houses without electricity. In all, the storm caused $200,000 (2006 USD; $256,751 2021 USD) in damage. Florence then brought heavy rains across Newfoundland as an extratropical storm, destroying one house and causing minor damage to several others. There were no fatalities as a result of the hurricane.[41]
Hurricane Gordon[]
| Category 3 hurricane (SSHWS) | |
  | |
| Duration | September 10 – September 20 |
|---|---|
| Peak intensity | 120 mph (195 km/h) (1-min) 955 mbar (hPa) |
A tropical wave moved off the coast of Africa on September 1. The wave tracked westward across the Atlantic for several days until it reached an area of relaxed wind shear and its associated low-pressure area organized into a tropical depression. It moved east-northeast and was upgraded to Tropical Storm Gordon on September 11, while located over the open waters of the Atlantic. Gordon turned north, and became a hurricane on September 13. It intensified to Category 3 status on the Saffir–Simpson scale and reached its peak intensity of 120 mph (195 km/h) on September 14. Tracking northward, it began to lose tropical characteristics. On September 20, the system affected Britain with high winds and heavy rain as an extratropical cyclone.[42] During Gordon's passage through Britain, 120,000 homes were left without power after winds of 80 mph (130 km/h) affected the country.[43]
Hurricane Helene[]
| Category 3 hurricane (SSHWS) | |
  | |
| Duration | September 12 – September 24 |
|---|---|
| Peak intensity | 120 mph (195 km/h) (1-min) 955 mbar (hPa) |
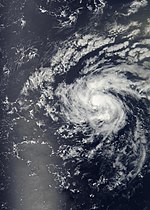
On September 11, a vigorous tropical wave moved off the west coast of Africa. The wave organized rapidly and spawned a tropical depression to the south-southeast of Cape Verde. On September 14, the depression intensified into Tropical Storm Helene while tracking west-northwest. Helene continued to intensify and was upgraded to a hurricane on September 16. The storm began to execute a northward track, and reached Category 3 hurricane status on the Saffir–Simpson scale on September 18, before reaching its peak intensity of 120 mph (195 km/h). It started to weaken when it reached the cold waters of the North Atlantic, and Helene dissipated on September 20, without having had major effects on land other than moderate wind gusts in the British Isles.[44]
Hurricane Isaac[]
| Category 1 hurricane (SSHWS) | |
  | |
| Duration | September 27 – October 2 |
|---|---|
| Peak intensity | 85 mph (140 km/h) (1-min) 985 mbar (hPa) |
Hurricane Isaac originated in a tropical wave that moved off the coast of Africa on September 18. The wave tracked west, produced a tropical depression, and became a tropical storm on September 28. Isaac moved north-northwest and was upgraded to a hurricane on September 30. It turned north and reached its peak intensity of 85 mph (135 km/h) before weakening and brushing Nova Scotia.[16] Isaac produced moderate winds on land in Newfoundland, peaking at 60 mph (96 km/h) with a sustained wind of 46 mph (74 km/h) was recorded.[45]
Storm names[]
The following names were used for storm names in the North Atlantic in 2006. This is the same list used in the 2000 season except for Kirk, which replaced Keith. No storm was given a previously unused name, for the first time since the 1993 season. It was the first hurricane season since the 1997 season that no Atlantic names were retired. The same list was used for the 2012 season.
|
Season effects[]
This is a table of all the storms that have formed in the 2006 Atlantic hurricane season. It includes their duration, names, landfall(s), denoted in parentheses, damages, and death totals. Deaths in parentheses are additional and indirect (an example of an indirect death would be a traffic accident), but were still related to that storm. Damage and deaths include totals while the storm was extratropical, a wave, or a low, and all the damage figures are in 2006 USD.
| Saffir–Simpson scale | ||||||
| TD | TS | C1 | C2 | C3 | C4 | C5 |
| Storm name |
Dates active | Storm category
at peak intensity |
Max 1-min wind mph (km/h) |
Min. press. (mbar) |
Areas affected | Damage (USD) |
Deaths | Refs
| ||
|---|---|---|---|---|---|---|---|---|---|---|
| Alberto | June 10–14 | Tropical storm | 70 (110) | 995 | Southeast United States, Atlantic Canada, Florida | $420 thousand | 2 | |||
| Unnamed | July 17–18 | Tropical storm | 50 (85) | 998 | East Coast of the United States, Atlantic Canada | None | None | |||
| Beryl | July 18–21 | Tropical storm | 60 (95) | 1000 | Long Island, Massachusetts, Atlantic Canada | Minimal | None | |||
| Chris | August 1–4 | Tropical storm | 65 (100) | 1001 | Leeward Islands, Puerto Rico, Turks & Caicos Islands, Hispaniola, Bahamas, Eastern Cuba | Minimal | None | |||
| Debby | August 21–26 | Tropical storm | 50 (85) | 999 | Cape Verde | None | None | |||
| Ernesto | August 24 – September 1 | Category 1 hurricane | 75 (120) | 985 | Lesser Antilles, Puerto Rico, Hispaniola, Cuba, East Coast of the United States, Eastern Canada | $500 million | 7 (4) | |||
| Florence | September 3–12 | Category 1 hurricane | 90 (150) | 974 | Bermuda, Newfoundland, East Coast of the United States, Atlantic Canada, Iceland, Greenland | $200 thousand | None | |||
| Gordon | September 10–20 | Category 3 hurricane | 120 (195) | 955 | Azores, Iberian Peninsula, British Isles | $3.8 million | None | |||
| Helene | September 12–24 | Category 3 hurricane | 120 (195) | 955 | British Isles | None | None | |||
| Isaac | September 27 – October 2 | Category 1 hurricane | 85 (140) | 985 | Newfoundland | Minimal | None | |||
| Season aggregates | ||||||||||
| 10 systems | June 10 – October 2 | 120 (190) | 955 | $504.42 million | 7 (7) | |||||
See also[]
- List of Atlantic hurricanes
- Tropical cyclones in 2006
- 2006 Pacific hurricane season
- 2006 Pacific typhoon season
- 2006 North Indian Ocean cyclone season
- South-West Indian Ocean cyclone seasons: 2005–06, 2006–07
- Australian region cyclone seasons: 2005–06, 2006–07
- South Pacific cyclone seasons: 2005–06, 2006–07
- South Atlantic tropical cyclone
- Mediterranean tropical-like cyclone
References[]
- ^ Mainelli, Michelle; Beven, Jack (November 1, 2006). "Monthly Tropical Weather Summary for October 2006". National Hurricane Center. Archived from the original on November 6, 2013. Retrieved November 1, 2006.
- ^ Jump up to: a b Klotzbach, Philip J.; Gray, William M. (November 17, 2006). "Summary of 2006 Atlantic Tropical Cyclone Activity and Verification of Authors' Seasonal and Monthly Forecasts". Colorado State University. Archived from the original on February 5, 2012. Retrieved November 17, 2006.
- ^ Jump up to: a b c Klotzbach, Philip J.; Gray, William M. (December 6, 2005). "Extended Range Forecast of Atlantic Seasonal Hurricane Activity and U.S. Landfall Strike Probability for 2006". Colorado State University. Archived from the original on June 13, 2006. Retrieved May 22, 2006.
- ^ Landsea, Christopher (2005). "AOML Frequently Asked Questions, E10". NOAA. Archived from the original on June 14, 2006. Retrieved May 22, 2006.
- ^ "NOAA Reviews Record-Setting 2005 Atlantic Hurricane Season". National Oceanic and Atmospheric Administration. April 13, 2006. Archived from the original on April 23, 2006. Retrieved April 26, 2006.
- ^ Klotzbach, Philip J.; Gray, William M. (April 4, 2006). "Extended Range Forecast of Atlantic Seasonal Hurricane Activity and U.S. Landfall Strike Probability for 2006". Colorado State University. Archived from the original on June 14, 2006. Retrieved May 22, 2006.
- ^ Jump up to: a b c "NOAA Predicts Very Active 2006 North Atlantic Hurricane Season". National Oceanic and Atmospheric Administration. 2006. Archived from the original on June 12, 2006. Retrieved May 22, 2006.
- ^ Klotzbach, Philip J.; Gray, William M. (May 31, 2006). "Extended Range Forecast of Atlantic Seasonal Hurricane Activity and U.S. Landfall Strike Probability for 2006". Colorado State University. Archived from the original on June 12, 2006. Retrieved May 31, 2006.
- ^ Klotzbach, Philip J.; Gray, William M. (August 3, 2006). "Extended Range Forecast of Atlantic Seasonal Hurricane Activity and U.S. Landfall Strike Probability for 2006". Colorado State University. Archived from the original on August 8, 2006. Retrieved August 3, 2006.
- ^ "NOAA: August 2006 Update to Atlantic Hurricane Season Outlook". National Oceanic and Atmospheric Administration. August 8, 2006. Archived from the original on August 11, 2006. Retrieved August 8, 2006.
- ^ Klotzbach, Philip J.; Gray, William M. (September 1, 2006). "Forecast of Atlantic hurricane activity for September and October 2006 and seasonal update through August". Colorado State University. Archived from the original on September 8, 2006. Retrieved September 1, 2006.
- ^ Klotzbach, Philip J.; Gray, William M. (October 3, 2006). "Forecast of Atlantic hurricane activity for October–November 2006 and seasonal update through September". Colorado State University. Archived from the original on October 31, 2006. Retrieved October 3, 2006.
- ^ Knabb, Richard D.; Brown, Daniel P. (March 17, 2006). "Tropical Cyclone Report: Tropical Storm Zeta" (PDF). National Hurricane Center. Retrieved February 3, 2011.
- ^ Hurricane Resreach Division. "FAQ Subjest G3: When is hurricane season?". Archived from the original on April 16, 2008. Retrieved April 16, 2008.
- ^ Jump up to: a b c d e f Avila, Lixion A.; Brown, Daniel P. (September 11, 2007). "Tropical Storm Alberto Tropical Cyclone Report" (PDF). National Hurricane Center. Retrieved January 26, 2008.
- ^ Jump up to: a b Mainelli, Michelle (November 16, 2006). "Hurricane Isaac Tropical Cyclone Report" (PDF). National Hurricane Center. Retrieved January 26, 2008.
- ^ Jump up to: a b Pasch, Richard J. (August 31, 2006). "Tropical Storm Beryl Tropical Cyclone Report" (PDF). National Hurricane Center. Retrieved January 27, 2008.
- ^ Jump up to: a b c Knabb, Richard D.; Mainelli, Michelle (December 15, 2006). "Hurricane Ernesto Tropical Cyclone Report" (PDF). National Hurricane Center. Retrieved January 27, 2008.
- ^ Jump up to: a b Hernández Unzón, Alberto (2006). "Resumen de la Tormenta Tropical "Alberto" del Océano Atlántico" (PDF). Servicio Meteorológico Nacional. Archived from the original (PDF) on January 2, 2007. Retrieved May 11, 2007.
- ^ Jump up to: a b c "2006 Atlantic Hurricane Season Review". Canadian Hurricane Centre. 2007. Archived from the original on July 26, 2007. Retrieved May 24, 2007.
- ^ Gruskin, Zachary (January 2010). "Structure and Evolution of a Possible U.S. Landfalling Tropical Storm in 2006". Monthly Weather Review. American Meteorological Society. 138 (1): 265–278. Bibcode:2010MWRv..138..265G. doi:10.1175/2009MWR3000.1. Retrieved February 15, 2010.
- ^ "2006 Tropical Storm Season Now Below Average". WeatherStreet. August 21, 2006. Archived from the original on May 12, 2008. Retrieved May 5, 2008.
- ^ Hurricane Research Division (March 2011). "Atlantic basin Comparison of Original and Revised HURDAT". National Oceanic and Atmospheric Administration. Archived from the original on November 29, 2011. Retrieved July 23, 2011.
- ^ Levinson, David (August 20, 2008). "2005 Atlantic Ocean Tropical Cyclones". National Climatic Data Center. Archived from the original on December 1, 2005. Retrieved July 23, 2011.
- ^ Blaes (2006). "Remnants of Alberto Produced Record Rainfall Amounts Across Central North Carolina". Raleigh, North Carolina National Weather Service. Archived from the original on February 5, 2012. Retrieved May 20, 2007.
- ^ "Tropical Storm Alberto Event Report for Florida (3)". National Climatic Data Center. 2006. Archived from the original on July 19, 2009. Retrieved May 21, 2007.
- ^ "Storm event: Tropical Storm – Florida". National Climatic Data Center. 2006. Archived from the original on March 8, 2008. Retrieved January 27, 2008.
- ^ Jump up to: a b c d Blake, Eric & Beven, John (2006). "Unnamed Tropical Storm Tropical Cyclone Report" (PDF). National Hurricane Center. Retrieved March 28, 2012.
- ^ Mainelli, Michelle & Beven, Jack (July 16, 2006). "July 16, 2006 Tropical Weather Outlook (2)". National Hurricane Center. Archived from the original on November 6, 2013. Retrieved June 20, 2007.
- ^ Pasch, Richard (August 31, 2006). "Tropical Storm Beryl Tropical Cyclone Report" (PDF). National Hurricane Center. Retrieved March 28, 2012.
- ^ NASA/GOES Project Office (2006). "Beryl's Effect on Nantucket Island, Mass". Archived from the original on September 26, 2015. Retrieved May 22, 2007.
- ^ Johnson, Carolyn; Zheng, Yuxing (July 21, 2006). "Tropical Storm Beryl sweeps into region". Boston Globe. Archived from the original on June 3, 2015. Retrieved May 22, 2007.
- ^ Jump up to: a b Stewart, Stacy R. (December 14, 2006). "Tropical Storm Chris Tropical Cyclone Report" (PDF). National Hurricane Center. Retrieved January 27, 2008.
- ^ Royal Caribbean. "Tropical Weather Update for August 2, 2006". Archived from the original on September 28, 2007. Retrieved August 2, 2006.
- ^ Franklin, James (November 2, 2006). "Tropical Cyclone Report: Tropical Storm Debby" (PDF). National Hurricane Center. Archived from the original (PDF) on October 31, 2008. Retrieved June 6, 2008.
- ^ Stewart, Stacy (August 21, 2006). "Tropical Depression Four Discussion Number 2". National Hurricane Center. Archived from the original on October 2, 2015. Retrieved June 6, 2008.
- ^ Jump up to: a b c Franklin, James L. (November 4, 2006). "Tropical Storm Debby Tropical Cyclone Report" (PDF). National Hurricane Center. Archived from the original (PDF) on October 31, 2008. Retrieved October 27, 2008.
- ^ Franklin, James (August 23, 2006). "Tropical Storm Debby Discussion Number 9". National Hurricane Center. Archived from the original on October 2, 2015. Retrieved June 6, 2008.
- ^ Beven, Jack (January 4, 2007). "Hurricane Florence Tropical Cyclone Report" (PDF). National Hurricane Center. Retrieved January 27, 2008.
- ^ "Bermuda braces as Florence becomes hurricane". CNN. Associated Press. September 10, 2006. Archived from the original on September 26, 2006.
- ^ "Florence deals Bermuda a blow, moves on". NBC News. September 8, 2006. Archived from the original on September 1, 2014. Retrieved January 27, 2008.
- ^ Blake, Eric S. (November 14, 2006). "Hurricane Gordon Tropical Cyclone Report" (PDF). National Hurricane Center. Retrieved January 27, 2008.
- ^ "Thousands of homes without power". BBC News. September 23, 2006. Archived from the original on January 2, 2014. Retrieved January 26, 2008.
- ^ Brown, Daniel P. (November 15, 2006). "Hurricane Helene Tropical Cyclone Report" (PDF). National Hurricane Center. Retrieved January 27, 2008.
- ^ Bowyer, Peter (2006). "Canadian Tropical Cyclone Season Summary for 2006". Canadian Hurricane Centre. Archived from the original on August 10, 2014. Retrieved October 5, 2012.
External links[]

- National Hurricane Center (NHC)
- NHC's Atlantic Tropical Weather Outlook – updated four times daily
- NHC's 2006 Advisory Archive
- HPC's Rainfall Page for tropical cyclones which affected the United States in 2006
- Unisys' 2006 Season Page – includes map of paths of all storms
- Flash Hurricane Tracker – track active and archived hurricanes.
- NRL hurricane page – Naval Research Laboratory page with extensive archives on individual storms
- 2006 Hurricanes – Free Google Earth Hurricane tracker
| show Tropical cyclones of the 2006 Atlantic hurricane season |
|---|

- 2006 Atlantic hurricane season
- Atlantic hurricane seasons
- Tropical cyclones in 2006