2003 Atlantic hurricane season
| 2003 Atlantic hurricane season | |
|---|---|
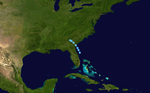
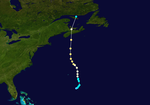
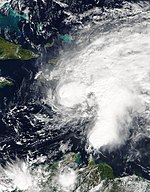
 Season summary map | |
| Seasonal boundaries | |
| First system formed | April 20, 2003 |
| Last system dissipated | December 11, 2003 |
| Strongest storm | |
| Name | Isabel |
| • Maximum winds | 165 mph (270 km/h) (1-minute sustained) |
| • Lowest pressure | 915 mbar (hPa; 27.02 inHg) |
| Seasonal statistics | |
| Total depressions | 21 |
| Total storms | 16 |
| Hurricanes | 7 |
| Major hurricanes (Cat. 3+) | 3 |
| Total fatalities | 93 total |
| Total damage | $4.42 billion (2003 USD) |
| Related articles | |
The 2003 Atlantic hurricane season was a highly active Atlantic hurricane season with tropical activity before and after the official bounds of the season—the first such occurrence since the 1954 season. The season produced 21 tropical cyclones, of which 16 developed into named storms; seven of those attained hurricane status, of which three reached major hurricane status. With sixteen storms, the season was tied for the fifth-most active Atlantic hurricane season on record, although it has since dropped down to become the seventh most active season. The strongest hurricane of the season was Hurricane Isabel, which reached Category 5 status on the Saffir–Simpson hurricane scale northeast of the Lesser Antilles; Isabel later struck North Carolina as a Category 2 hurricane, causing $3.6 billion in damage (2003 USD) and a total of 51 deaths across the Mid-Atlantic region of the United States.
Although the bounds of the season are typically from June 1 to November 30, the season began early with the formation of Subtropical Storm Ana on April 20, and it ended relatively late on December 11 with the dissipation of Tropical Storm Peter. In early September, Hurricane Fabian struck Bermuda as a Category 3 hurricane, where it was the worst hurricane since 1926; on the island it caused four deaths and $300 million in damage (2003 USD). Hurricane Juan caused considerable destruction to Nova Scotia, particularly Halifax, as a Category 2 hurricane, the first hurricane of significant strength to hit the province since 1893. Additionally, Hurricanes Claudette and Erika struck Texas and Mexico, respectively, as minimal hurricanes. In December, Tropical Storm Odette struck the Dominican Republic, and Tropical Storm Peter formed in the eastern portion of the basin.
Seasonal forecasts[]
| Source | Date | Tropical storms |
Hurricanes | Major hurricanes |
| CSU | Average (1950–2000) | 9.6 | 5.9 | 2.3 |
| NOAA | Average[1] | 11 | 6 | 2 |
| NOAA | May 19, 2003 | 11–15 | 6–9 | 2–4 |
| CSU | April 4, 2003 | 12 | 8 | 3 |
| CSU | May 30, 2003 | 14 | 8 | 3 |
| CSU | August 6, 2003 | 14 | 8 | 3 |
| Actual activity | 16 | 7 | 3 | |
Pre-season outlook[]
On May 19, prior to the start of the season, NOAA forecasters issued a 55% probability of above normal activity. The forecasters predicted 11–15 tropical storms, 6–9 of those becoming hurricanes, and 2–4 of those hurricanes reaching at least Category 3 strength on the Saffir–Simpson hurricane scale. The above normal activity predicted was due to the likelihood of La Niña developing in the season.[2]
Noted hurricane expert Dr. William M. Gray on April 4 predicted twelve named storms, with eight reaching hurricane strength and three of the eight reaching Category 3 strength.[3] The prediction issued on May 30 was similar, increasing the named storms to fourteen. The synoptic pattern of the season prior to June 1 resembled other previous seasons, with the 1952, 1954, 1964, 1966, and 1998 seasons considered the best analogs for the season. The prediction also included a 68% probability for a hurricane landfall along the United States.[4]
Mid-season outlook[]
On August 6, Dr. Gray announced he had maintained his previous prediction; with an active start of the season, the rest of the season was forecast to have been only slightly above average, due to an anticipated overall less favorable environment across the Atlantic Ocean.[5] A day later, NOAA released an updated prediction as well, with a 60% probability of above normal activity, with 12–15 named storms, 7–9 hurricanes, and 3–4 major hurricanes expected.[6]
A normal season, as defined by NOAA, has 6–14 tropical storms, 4–8 of which reach hurricane strength, and 1–3 of those reaching Category 3 strength.[7]
Seasonal summary[]


The official beginning of the season was on June 1, 2003,[8] though Subtropical Storm Ana formed on April 20, well before the start to the season.[9] Starting at the official start of the season, the National Hurricane Center began issuing five-day forecasts, extending from the three-day forecasts issued since 1964. Officials conducted tests during the previous two seasons, indicating the new five-day forecasts would be as accurate as the three-day forecasts were 15 years earlier.[10] The tropics were active and well ahead of climatology in the early portion of the season, with the seventh tropical depression forming by the end of July.[11] The season officially ended on November 30, 2003,[8] although tropical storms Odette and Peter developed in early December.[12][13]
The season is one of only six with a storm before and after the official bounds of the season; the others are 1887, 1951, 1953, 1954 and 2007. When Tropical Storm Peter formed on December 7, the season became the second on record with two December storms. The 235 days between the development of the first storm, Tropical Storm Ana, and the dissipation of the last storm, Peter, made the 2003 season the longest season since 1952. The season was the tenth most active on record, behind the 2020, 2005, 1933, 2012, 2011, 2010, 1995, 1887, 1969, 2019, 2017, and 1936 seasons; it tied with 1949, 1950, 1954, and 2008.[14]
Overall, the season's activity was reflected with a high cumulative accumulated cyclone energy (ACE) rating of 177.[15] ACE is, broadly speaking, a measure of the power of the hurricane multiplied by the length of time it existed, so storms that last a long time, as well as particularly strong hurricanes, like Isabel and Fabian, have high ACEs. ACE is only calculated for full advisories on tropical systems at or exceeding 34 knots (39 mph, 63 km/h) or tropical storm strength. Subtropical cyclones are excluded from the total.[16]
No cyclones in the season had a significant impact on South America or Central America. However, a total of eight tropical cyclones made landfall on Mexico from either the Atlantic or the Pacific Ocean, which was the greatest total since the record of nine in 1971. A total of seven deaths occurred in Mexico from Atlantic hurricanes. Much of the Caribbean did not receive significant impact from tropical cyclones during the season.[17]
Six tropical cyclones made landfall along the coast of the United States during the season, including two hurricanes. The first, Claudette, caused locally heavy damage in southeastern Texas in July; two deaths were reported in the state, while earlier in its duration it caused an indirect death from rough waves in Florida.[18] In September, Hurricane Isabel caused deaths and damage from North Carolina through southern Canada.[19] The worst damage from the hurricane occurred in Virginia, where it was the costliest disaster in the history of the state;[20] there, damage totaled over $1.85 billion (2003 USD), and there were 32 fatalities, ten of which were caused directly by the hurricane.[19] Hurricane Isabel caused deaths in seven states and one Canadian province, and about 6 million people were left without power as a result of the storm.[21]
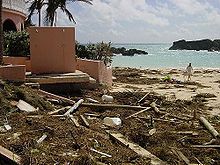
Several cyclones impacted Bermuda during the season, most significantly Hurricane Fabian. On the island, its passage proved to be the costliest and resulted in the first death since a hurricane in 1926.[22] The hurricane killed four on the island when its strong waves and storm surge washed two cars off the causeway between St. George's Parish and St. David's Island.[23] Damage from the hurricane totaled $300 million (2003 USD).[24] Elsewhere, Hurricane Juan was considered among the most damaging in the history of Halifax, Nova Scotia, where strong winds downed thousands of trees and left low-lying areas flooded from a record storm surge to the city. The hurricane caused a total of eight deaths and damage estimated at $200 million (2003 CAD, $150 million 2003 USD).[25]
Systems[]
Tropical Storm Ana[]
| Tropical storm (SSHWS) | |
  | |
| Duration | April 20 – April 24 |
|---|---|
| Peak intensity | 60 mph (95 km/h) (1-min) 994 mbar (hPa) |
A non-tropical low-pressure area developed about 240 miles (390 km) south-southwest of Bermuda on April 18 through the interaction of an upper-level trough and a surface frontal trough. It tracked northwestward at first, then turned to the southeast. After developing centralized convection, the system developed into Subtropical Storm Ana on April 20 to the west of Bermuda. It tracked east-southeastward and organized, and on April 21 it transitioned into a tropical cyclone with peak winds of 60 mph (97 km/h), after developing an upper-level warm core. Increased wind shear caused fluctuations in intensity and a steady weakening trend, and on April 24 the center of Ana merged with an approaching cold front, thus signaling the completion of extratropical transition. The extratropical remnants continued east-northeastward, and on April 27 the gale was absorbed within the cold front.[9]
The cyclone is most notable for being the only Atlantic tropical cyclone in the month of April, until Tropical Storm Arlene in 2017. When Ana became a subtropical storm, it became the second subtropical cyclone on record in the month, after a storm in 1992.[9] Ana dropped 2.63 inches (67 mm) of rainfall in Bermuda over a period of several days.[26] Increased swells from the storm caused two drowning deaths in southeastern Florida when a boat capsized.[9] The remnants of the storm brought light rainfall to the Azores and the United Kingdom, though no significant damage was reported.[27]
Tropical Depression Two[]
| Tropical depression (SSHWS) | |
  | |
| Duration | June 11 – June 11 |
|---|---|
| Peak intensity | 35 mph (55 km/h) (1-min) 1008 mbar (hPa) |
A tropical wave moved off the coast of Africa on June 6.[28] Tracking westward at a low latitude, convection increased markedly on June 10.[29] The system was declared Tropical Depression Two early on June 11 in the central tropical Atlantic Ocean.[28] The depression was at the time the third tropical cyclone on record to develop in the month of June to the east of the Lesser Antilles;[30] the others were Tropical Depression Two in 2000,[31] Ana in 1979, and a storm in 1933.[30] The next such system to accomplish this would be Bret in 2017.[32]
Initially, the depression was forecast to attain tropical storm status, maintaining good outflow and some banding features around the system.[29] Around 09:00 UTC on June 11 satellite-based intensity estimates indicated the depression was near tropical storm status.[33] However, the convection subsequently diminished and became displaced to the northeast of the center, and late on June 11 the depression degenerated into an open tropical wave about 950 miles (1,530 km) east-southeast of Barbados.[28] The tropical wave remained well defined with a well-defined low-level vorticity, though strong wind shear prevented tropical redevelopment.[34] On June 13 its remnants passed through the Windward Islands and subsequently entered the Caribbean.[35]
Tropical Storm Bill[]
| Tropical storm (SSHWS) | |
  | |
| Duration | June 29 – July 2 |
|---|---|
| Peak intensity | 60 mph (95 km/h) (1-min) 997 mbar (hPa) |
Tropical Storm Bill developed from a tropical wave on June 29 to the north of the Yucatán Peninsula. It slowly organized as it moved northward, and reached a peak of 60 mph (97 km/h) shortly before making landfall 27 miles (43 km) west of Chauvin, Louisiana. Bill quickly weakened over land, and as it accelerated to the northeast, moisture from the storm, combined with cold air from an approaching cold front, produced an outbreak of 34 tornadoes. Bill became extratropical on July 2, and was absorbed by the cold front later that day.[36]
Upon making landfall on Louisiana, the storm produced a moderate storm surge, causing tidal flooding.[37] In a city in the northeastern portion of the state, the surge breached a levee, which flooded many homes in the town.[38] Moderate winds combined with wet soil knocked down trees, which then hit a few houses and power lines,[39] and left hundreds of thousands without electric power.[40] Further inland, tornadoes from the storm produced localized moderate damage. Throughout its path, Tropical Storm Bill caused around $50 million in damage (2003 USD) and four deaths.[36]
Hurricane Claudette[]
| Category 1 hurricane (SSHWS) | |
  | |
| Duration | July 8 – July 17 |
|---|---|
| Peak intensity | 90 mph (150 km/h) (1-min) 979 mbar (hPa) |
A well-organized tropical wave tracked quickly through the Lesser Antilles on July 7, producing tropical storm force winds but failing to attain a low-level circulation. After organizing in the Caribbean, it developed into Tropical Storm Claudette to the south of the Dominican Republic on July 8. Its intensity fluctuated over the subsequent days, attaining hurricane status briefly on July 10 before weakening and hitting Puerto Morelos on the Yucatán Peninsula on July 11 as a tropical storm. The storm remained disorganized due to moderate wind shear, though after turning west-northwestward into an area of lighter shear, it re-attained hurricane status on July 15 off the coast of Texas; it intensified quickly and made landfall on Matagorda Island with peak winds of 90 mph (140 km/h). It slowly weakened after moving ashore, tracking across northern Tamaulipas before dissipating in northwestern Chihuahua.[18]
The precursor cyclone caused light damage in the Lesser Antilles, and waves from the hurricane caused an indirect death off of Florida.[18] Widespread flooding and gusty winds destroyed or severely damaged 412 buildings in southeast Texas, with a further 1,346 buildings suffering lighter impact. The hurricane caused locally severe beach erosion along the coast.[41] High winds downed many trees along the coast, causing one direct and one indirect death. Damage was estimated at $180 million (2003 USD).[18]
Hurricane Danny[]
| Category 1 hurricane (SSHWS) | |
  | |
| Duration | July 16 – July 21 |
|---|---|
| Peak intensity | 75 mph (120 km/h) (1-min) 1000 mbar (hPa) |
A tropical wave moved off the coast of Africa on July 9. The northern portion of the wave tracked to the west-northwest, and on July 13 an area of convection developed along the wave axis. The system slowly organized, and after a closed low-level circulation developed, the system was classified as Tropical Depression Five about 630 miles (1,010 km) east of Bermuda. It quickly organized, becoming Tropical Storm Danny a day after forming. Tracking around the periphery of an anticyclone, the storm moved northwestward before turning north and later northeastward. Despite being located at a high latitude, Danny continued to strengthen due to unusually warm water temperatures, and on July 19 it attained hurricane status about 525 miles (845 km) south of St. John's, Newfoundland and Labrador, despite having an unusually high minimum pressure for a storm of its intensity.[42]
Wind shear increased the next day as the hurricane turned eastward, causing a steady weakening trend that was accelerated after crossing into an area of cooler water temperatures. By July 20 the cyclone had turned to the southeast and weakened to tropical depression status, and on July 21 it degenerated into a remnant low-pressure area. The remnants of Danny tracked erratically southwestward before dissipating on July 27 about 630 miles (1,010 km) east of where it originally developed. There were no reports of damages or casualties associated with Danny.[42]
Tropical Depression Six[]
| Tropical depression (SSHWS) | |
  | |
| Duration | July 19 – July 21 |
|---|---|
| Peak intensity | 35 mph (55 km/h) (1-min) 1010 mbar (hPa) |
A tropical wave moved westward off the coast of Africa on July 14.[43] After tracking steadily westward, an area of thunderstorms became more concentrated as its upper-level environment became more favorable,[44] and late on July 19 the National Hurricane Center classified it as Tropical Depression Six while it was located about 1,035 miles (1,666 km) east of the Lesser Antilles.[43] Upon being classified as a tropical cyclone, the depression maintained two ill-defined hooking bands to its north and south, and was originally forecast to attain hurricane status before passing through the Lesser Antilles. With warm waters and very light wind shear forecast, its environmental conditions met four out of five parameters for rapid intensification.[45] Subsequently, convection diminished as the result of cold air inflow and instability from a disturbance to its southeast.[46]
With a fast forward speed, confirmation of a low-level circulation on July 20 became difficult.[47] Convection increased in curvature on July 21,[48] and several islands in the Lesser Antilles issued tropical storm warnings and watches. After it passed north of Barbados, a Hurricane hunters flight failed to report a closed low-level circulation, and it is estimated the depression degenerated into an open tropical wave late on July 21. The remnants brought a few showers to the Lesser Antilles,[43] and after tracking into the Caribbean redevelopment was prevented by increased wind shear.[49] The northern portion of the wave axis split and developed into Tropical Depression Seven.[43]
Tropical Depression Seven[]
| Tropical depression (SSHWS) | |
  | |
| Duration | July 25 – July 27 |
|---|---|
| Peak intensity | 35 mph (55 km/h) (1-min) 1016 mbar (hPa) |
A tropical wave interacted with an upper-level low to develop an area of deep convection near Hispaniola on July 23.[50] A mid- to lower-level circulation developed within the system at it tracked generally north-northwestward, and based on surface and satellite observations, it is estimated the system developed into Tropical Depression Seven at 1200 UTC on July 25 about 60 miles (97 km) east of Daytona Beach, Florida. The system was embedded in an environment characterized by high surface pressures. Tracking through an area of cool water temperatures,[50] as well as unfavorable upper-level winds, the depression failed to achieve winds greater than 35 mph (56 km/h).[51]
Early on July 26 it moved ashore on St. Catherines Island, Georgia, and after steadily weakening over land it dissipated on July 27. As the storm was never forecast to attain tropical storm status, no tropical storm warnings or watches were issued.[50] However, flood watches were posted for much of Georgia and South Carolina.[52] The depression dropped light to moderate rainfall from Florida to the coast of North Carolina, peaking at 5.17 inches (131 mm) in Savannah, Georgia. Mostly, rainfall totals between 1 and 3 inches (25 and 76 mm) were common.[53] There were no reports of damage or casualties associated with this depression.[50]
Hurricane Erika[]
| Category 1 hurricane (SSHWS) | |
  | |
| Duration | August 14 – August 17 |
|---|---|
| Peak intensity | 75 mph (120 km/h) (1-min) 986 mbar (hPa) |
The precursor system to Hurricane Erika was first noted as a non-tropical low on August 9 about 1,150 miles (1,850 km) east of Bermuda. It tracked quickly southwestward then westward in tandem with an upper-level low, which prevented tropical development. On August 13 an area of convection increased as it passed through the Bahamas, and while crossing Florida a circulation built toward the surface; it is estimated the system developed into Tropical Storm Erika on August 14 about 85 miles (137 km) west-southwest of Fort Myers, Florida. A strong ridge caused the storm to continue quickly westward, and the system gradually strengthened and organized. By August 15 its forward motion slowed, allowing the convection to organize into curved rainbands, and late in the day an eye feature began developing. Tropical Storm Erika attained hurricane status at around 1030 UTC as it was moving ashore in northeastern Tamaulipas; operationally it was not classified as a hurricane, due to lack of data. The winds rapidly decreased as it tracked across the mountainous terrain of northeastern Mexico, and early on August 17 the cyclone dissipated.[54]
The hurricane dropped light to moderate rainfall along its path, which caused some flooding; in Montemorelos in Nuevo León, two people died after being swept away by floodwaters. Several mudslides were reported, which left numerous highways blocked or impassable. In southern Texas, the hurricane caused light winds and minor damage, with no reports of deaths or injuries in the United States.[54]
Tropical Depression Nine[]
| Tropical depression (SSHWS) | |
  | |
| Duration | August 21 – August 22 |
|---|---|
| Peak intensity | 35 mph (55 km/h) (1-min) 1007 mbar (hPa) |
A strong tropical wave moved off the coast of Africa on August 14,[55] and after tracking steadily westward an area of convection began to become better organized on August 18.[56] After it tracked through the Lesser Antilles, it developed into Tropical Depression Nine on August 21 to the south of Puerto Rico. The depression quickly showed signs of organization, and forecasters predicted the depression to intensify to a strong tropical storm.[57] However, strong southwesterly wind shear unexpectedly became established over the system, and the depression degenerated into a tropical wave late on August 22 to the south of the eastern tip of the Dominican Republic.[55]
The depression caused moderate rainfall in Puerto Rico, where 2 to 3 inches (50 to 75 mm) of precipitation were recorded.[58] The flooding from the rainfall entered 10 houses and left some streets impassable.[59] A mudslide was reported in the eastern portion of the island.[60] A river in northeastern Puerto Rico surpassed its banks from flooding, though it returned to normal levels within hours.[61] Damage in Puerto Rico totaled $20,000 (2003 USD, $28,137 2021 USD).[59] The remnants of the depression dropped light to moderate precipitation in the Dominican Republic, which caused flooding and overflowing rivers. More than 100 houses were flooded, and some crop damage was reported.[17] The rainfall was welcome in the country, as conditions were dry in the preceding months.[62] Flooding was also reported in eastern Jamaica, though damage there, if any, is unknown.[17]
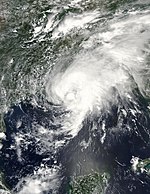
Hurricane Fabian[]
| Category 4 hurricane (SSHWS) | |
  | |
| Duration | August 27 – September 8 |
|---|---|
| Peak intensity | 145 mph (230 km/h) (1-min) 939 mbar (hPa) |
On August 25, a tropical wave emerged off the coast of Africa, and two days later developed enough organized convection to develop into Tropical Depression Ten. Tracking through warm waters and low vertical shear, the depression was named Tropical Storm Fabian on August 28. On August 30, the storm intensified into a hurricane, and it quickly strengthened to attain major hurricane status late that day; on September 1 Fabian reached its peak intensity of 145 mph (233 km/h). The hurricane turned to the north and gradually weakened before passing 14 miles (23 km) west of Bermuda on September 5 with winds of 120 mph (190 km/h). The cyclone accelerated northeastward into an environment of unfavorable conditions, becoming an extratropical cyclone on September 8; two days later it merged with another extratropical storm between southern Greenland and Iceland.[24]
Strong waves caused extensive damage to the Bermuda coastline,[17] destroying 10 nests of the endangered Bermuda petrel.[63] The storm surge from the hurricane stranded one vehicle with three police officers and another with a resident on the causeway between St. George's Parish and St. David's Island, later washing both vehicles into Castle Harbour;[64] all four were killed.[24] Strong winds left about 25,000 people without power on the island, and also caused severe damage to vegetation.[17] The strong winds damaged or destroyed the roofs of numerous buildings on Bermuda,[65] Damage on the island totaled $300 million (2003 USD). Elsewhere, strong waves from the hurricane killed a surfer in North Carolina and caused three deaths off of Newfoundland when a fishing vessel sank.[24]
Tropical Storm Grace[]
| Tropical storm (SSHWS) | |
  | |
| Duration | August 30 – September 2 |
|---|---|
| Peak intensity | 40 mph (65 km/h) (1-min) 1007 mbar (hPa) |
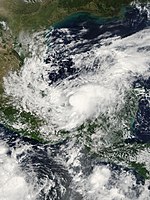
A strong tropical wave accompanied with a low-pressure system moved off the coast of Africa on August 19. It moved quickly westward, failing to organize significantly, and developed a surface low-pressure area on August 29 in the Gulf of Mexico. Convection continued to organize, and the tropical wave developed into Tropical Depression Eleven on August 30 while located 335 miles (539 km) east-southeast of Corpus Christi, Texas. The depression quickly intensified to become Tropical Storm Grace, though further intensification was limited due to a nearby upper-level low. On August 31, Grace moved ashore on Galveston Island, Texas, and it quickly weakened over land. The storm turned northeastward and was absorbed by a cold front over extreme eastern Oklahoma on September 2.[66]
The storm produced light to moderate precipitation from Texas through the eastern United States, peaking at 10.4 inches (260 mm) in eastern Texas.[67] Near where it made landfall, Grace produced flooding of low-lying areas and light beach erosion.[68] In Oklahoma and southern Missouri, the remnants of the storm caused localized flooding.[69][70] No deaths were reported, and damage was minimal.[66]
Tropical Storm Henri[]
| Tropical storm (SSHWS) | |
  | |
| Duration | September 3 – September 8 |
|---|---|
| Peak intensity | 60 mph (95 km/h) (1-min) 997 mbar (hPa) |
On August 22, a tropical wave moved off the coast of Africa, and it remained disorganized until reaching the eastern Gulf of Mexico on September 1. A tropical disturbance developed into Tropical Depression Twelve on September 3 about 300 miles (480 km) west of Tampa, Florida. It moved eastward and strengthened into Tropical Storm Henri on September 5, and despite strong wind shear it intensified to reach peak winds of 60 mph (97 km/h) later that day. Subsequently, it quickly weakened, and it struck the western Florida coast as a tropical depression. On September 8 it degenerated into a remnant low-pressure area off the coast of North Carolina,[71] and after moving ashore near Cape Hatteras,[72] it crossed the Mid-Atlantic states and dissipated on September 17 over New England.[73]
Henri was responsible for locally heavy rainfall across Florida, but damage was minimal.[71] The remnants of Henri caused heavy precipitation in Delaware and Pennsylvania, causing $19.6 million in damage (2003 USD).[74][75] In Delaware, the rainfall caused record-breaking river flooding, with part of the Red Clay Creek experiencing a 500-year flood,[76] and the system left 109,000 residents without power in Pennsylvania.[75] The impacts of the storm were severely compounded the following week by Hurricane Isabel across the region.[19]
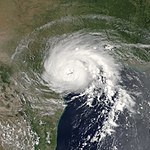
Hurricane Isabel[]
| Category 5 hurricane (SSHWS) | |
  | |
| Duration | September 6 – September 19 |
|---|---|
| Peak intensity | 165 mph (270 km/h) (1-min) 915 mbar (hPa) |
A tropical wave moved off the coast of Africa on September 1, which developed into Tropical Depression Thirteen early on September 6 to the southwest of the Cape Verde islands. It quickly intensified into Tropical Storm Isabel,[19] and it continued to gradually intensify within an area of light wind shear and warm waters.[77] Isabel strengthened to a hurricane on September 7, and the following day it attained major hurricane status. Its intensity fluctuated over the subsequent days as it passed north of the Lesser Antilles, and it attained peak winds of 165 mph (266 km/h) on September 11, a Category 5 hurricane on the Saffir–Simpson scale. The hurricane oscillated between Category 4 and Category 5 status over the following four days, before weakening due to wind shear. On September 18 Isabel made landfall between Cape Lookout and Ocracoke Island in North Carolina with winds of 105 mph (169 km/h). It continued northwestward, becoming extratropical over western Pennsylvania before being absorbed by a larger storm over Ontario on September 19.[19]
Strong winds from Isabel extended from North Carolina to New England and westward to West Virginia. The winds, combined with previous rainfall which moistened the soil, downed many trees and power lines across its path, leaving about 6 million electricity customers without power at some point. Coastal areas suffered from waves and its powerful storm surge, with areas in eastern North Carolina and southeast Virginia reporting severe damage from both winds and the storm surge. Throughout its path, Isabel resulted in $3.6 billion in damage (2003 USD) and 47 deaths, of which 16 were directly related to the storm's effects.[21]
The governors of Pennsylvania, West Virginia, Maryland, New Jersey, and Delaware declared states of emergencies.[78] Isabel was the first major hurricane to threaten the Mid-Atlantic states and the South since Hurricane Floyd in September 1999. Isabel's greatest impact was due to flood damage, the worst in some areas of Virginia since 1972's Hurricane Agnes. More than 60 million people were affected to some degree — a similar number to Floyd but more than any other hurricane in recent memory.[79]
Tropical Depression Fourteen[]
| Tropical depression (SSHWS) | |
  | |
| Duration | September 8 – September 10 |
|---|---|
| Peak intensity | 35 mph (55 km/h) (1-min) 1007 mbar (hPa) |
A strong tropical wave moved off the coast of Africa on September 6, and almost immediately it became associated with a broad surface circulation.[80] With favorable upper-level winds the system quickly became better organized,[81] and on September 8, it possessed enough organization to be classified as Tropical Depression Fourteen while located about 290 miles (470 km) southeast of the southernmost Cape Verde islands.[80] Initially the depression failed to maintain an inner core of deep convection, and despite its occurrence with nearby dry air, the depression was forecast to intensify to hurricane status due to anticipated favorable conditions.[81]
In the hours subsequent to formation, the convection near the center decreased as the banding features dissipated.[82] Dry air greatly increased over the depression, and by September 9 the system was not forecast to intensify past minimal tropical storm status.[83] Later that day an upper-level low tracked southward to the west of the depression, which increased wind shear and caused a steady north-northwest motion for the depression. The circulation became elongated and separated from the convection as it passed just west of the Cape Verde Islands,[80] where it brought heavy rainfall,[84] and on September 10 the depression dissipated.[80]
Hurricane Juan[]
| Category 2 hurricane (SSHWS) | |
  | |
| Duration | September 24 – September 29 |
|---|---|
| Peak intensity | 105 mph (165 km/h) (1-min) 969 mbar (hPa) |
A large tropical wave moved off the coast of Africa on September 14,[85] and due to unfavorable wind shear it initially remained disorganized.[86] An area of convection increased in association with an upper-level low, and it developed into Tropical Depression Fifteen on September 24 to the southeast of Bermuda. It steadily organized as it tracked northward, intensifying into Tropical Storm Juan on September 25 and attaining hurricane status on September 26.[85] With warm waters and light wind shear, Juan reached peak winds of 105 mph (169 km/h) on September 27 about 635 miles (1,022 km) south of Halifax, Nova Scotia.[87] It accelerated northward, weakening only slightly before moving ashore near Halifax on September 29 with winds of 100 mph (160 km/h). It quickly weakened while crossing the southern Canadian Maritimes before being absorbed by a large extratropical cyclone over the Gulf of Saint Lawrence.[85]
The eyewall of Hurricane Juan was the first to directly cross over Halifax since a hurricane in August of 1893; the cyclone became one of the most damaging tropical cyclones in modern history for the city. The hurricane produced a record storm surge of 4.9 feet (1.5 m), which resulted in extensive flooding of the Halifax and Dartmouth waterfront properties. Strong winds caused widespread occurrences of falling trees, downed power lines, and damaged houses, and the hurricane was responsible for four direct deaths and four indirect deaths.[85] More than 800,000 people were left without power. Nearly all wind-related damage occurred to the east of the storm track, and damage amounted to about $200 million (2003 CAD; $150 million 2003 USD).[25]
Hurricane Kate[]
| Category 3 hurricane (SSHWS) | |
  | |
| Duration | September 25 – October 7 |
|---|---|
| Peak intensity | 125 mph (205 km/h) (1-min) 952 mbar (hPa) |
Kate developed from a tropical wave in the central tropical Atlantic on September 25. The storm moved northwestward until a weakness in the subtropical ridge forced it eastward. Kate strengthened to a hurricane, turned sharply westward while moving around a mid-level low, and intensified to a 125 mph (201 km/h) major hurricane on October 4. Kate turned sharply northward around the periphery of an anticyclone, weakened, and became extratropical after passing to the east of Newfoundland. The extratropical storm persisted for three days until losing its identity near Scandinavia.[88]
Kate threatened Atlantic Canada just one week after Hurricane Juan caused severe damage in Nova Scotia. The storm had minimal effects on land, limited to moderately strong winds and heavy rainfall over Newfoundland;[89] St. John's reported 1.8 inches (46 mm) on October 6, a record for the date.[90] The interaction between Kate and a high-pressure area to its north produced 3 to 4 ft (1 m) waves along the coast of North Carolina and New England.[91]
Tropical Storm Larry[]
| Tropical storm (SSHWS) | |
  | |
| Duration | October 1 – October 7 |
|---|---|
| Peak intensity | 65 mph (100 km/h) (1-min) 993 mbar (hPa) |
A tropical wave moved off the coast of Africa on September 17, which developed a low-pressure area on September 27 in the western Caribbean. It moved ashore along the Yucatán Peninsula on September 29 and developed into an extratropical cyclone as it interacted with a stationary cold front. Deep convection increased, and it transitioned into Tropical Storm Larry by October 1. The storm drifted generally southward, and after reaching peak winds of 65 mph (105 km/h) it made landfall in the Mexican state of Tabasco on October 5,[92] the first landfall in the region since Hurricane Brenda in 1973.[93] The remnants of Larry crossed the Isthmus of Tehuantepec, degenerating into a remnant low-pressure area before dissipating on October 7 in the eastern Pacific Ocean.[92]
The storm caused flooding and mudslides throughout the region, and coincided with the landfall in southwestern Mexico of two Pacific tropical cyclones, Nora and Olaf, adding to the damage.[94] Overall, the storm resulted in five deaths and $53.4 million in damage (2003 USD).[92][95]
Tropical Storm Mindy[]
| Tropical storm (SSHWS) | |
  | |
| Duration | October 10 – October 14 |
|---|---|
| Peak intensity | 45 mph (75 km/h) (1-min) 1002 mbar (hPa) |
A tropical wave exited the coast of Africa on October 1 and moved westward.[96] On October 8, thunderstorms spread across the Lesser Antilles, and the wave slowly organized.[97] Rainfall reached 2.98 inches (76 mm) in Christiansted in Saint Croix, and 7.13 inches (181 mm) near Ponce, Puerto Rico.[98] Strong winds left around 29,000 people without power in northeastern Puerto Rico.[99] The rainfall wrecked bridges in Las Piedras and Guayama,[100][101] and led to flooded streams, downed trees, and rockslides that closed four roads. One car was swept away,[102] and a few houses were flooded.[103] The damage total was at least $46,000 (2003 USD).[100][101][104]
It turned northwestward through a weakness in the subtropical ridge, and despite strong wind shear developed into Tropical Storm Mindy late on October 10 over eastern Dominican Republic, with peak winds of 45 mph (72 km/h).[96] It produced 2.63 inches (67 mm) of rain in Santiago Rodríguez, which caused flooding and damaged 320 houses.[105] Although forecast to intensify to 65 mph (105 km/h) winds, the storm weakened due to the wind shear.[106] The center passed near the Turks and Caicos Islands on October 11,[96] and winds reached only 31 mph (50 km/h) at Grand Turk Island.[105] On October 12, Mindy weakened to a tropical depression, and later turned eastward due to an approaching short-wave trough. Devoid of deep convection, the circulation dissipated on October 14 about 445 miles (716 km) south-southwest of Bermuda.[96] Mindy produced 2 to 3 ft (0.6 to 0.9 m) swells along the U.S. Atlantic coast from Florida through North Carolina.[91]
Tropical Storm Nicholas[]
| Tropical storm (SSHWS) | |
  | |
| Duration | October 13 – October 23 |
|---|---|
| Peak intensity | 70 mph (110 km/h) (1-min) 990 mbar (hPa) |
Forming from a tropical wave on October 13 in the central tropical Atlantic Ocean, Nicholas slowly developed due to moderate levels of wind shear throughout its lifetime. Deep convection slowly organized, and Nicholas attained a peak intensity of 70 mph (110 km/h) on October 17. After moving west-northwestward for much of its lifetime, it turned northward and weakened due to increasing shear. The storm again turned to the west and briefly restrengthened, but after turning again to the north Nicholas transitioned to an extratropical cyclone on October 24. As an extratropical storm, Nicholas executed a large loop to the west, and after moving erratically for a week and organizing into a tropical low, it was absorbed by a non-tropical low. The low continued westward, crossed Florida, and ultimately dissipated over the Gulf Coast of the United States on November 5.[107]
Nicholas had no impact as a tropical cyclone, and impact from the low that absorbed the storm was limited to rainfall, gusty winds, and rough surf.[108] The low that absorbed the storm nearly developed into a tropical cyclone, which would have been called Odette. However, moderate wind shear prevented further development.[109]
Tropical Storm Odette[]
| Tropical storm (SSHWS) | |
  | |
| Duration | December 4 – December 7 |
|---|---|
| Peak intensity | 65 mph (100 km/h) (1-min) 993 mbar (hPa) |
Odette was a rare December tropical storm, the first since Hurricane Lili in 1984, that formed on December 4 in the southwest Caribbean Sea.[12] It became the second December tropical storm on record to form in the Caribbean Sea, after a hurricane in 1822.[12][110] Odette strengthened and made landfall near Cabo Falso in the Dominican Republic on December 6 as a moderately strong tropical storm. A day later, Odette became extratropical, and eventually merged with a cold front.[12]
Eight deaths were directly attributed to this tropical storm in the Dominican Republic due to mudslides or flash flooding. In addition, two deaths were indirectly caused by the storm. Approximately 35% of the nation's banana crop was destroyed.[12] Light to moderate rainfall was reported in Puerto Rico.[111]
Tropical Storm Peter[]
| Tropical storm (SSHWS) | |
  | |
| Duration | December 7 – December 11 |
|---|---|
| Peak intensity | 70 mph (110 km/h) (1-min) 990 mbar (hPa) |
By December 5, an extratropical cyclone developed and was moving southward, isolated from the westerlies. Convection developed near the center, and the system organized into a subtropical storm late on December 7, about 835 miles (1,344 km) south-southwest of the Azores. The system moved southwestward over warmer waters, and deep convection continued to organize over the center. Banding features also increased, and the National Hurricane Center declared the system as Tropical Storm Peter on December 9, about 980 miles (1,580 km) northwest of the Cape Verde islands. With the development of Peter and Odette, 2003 became the first year since 1887 that two storms were active in the month of December.[13]
Initially, the National Hurricane Center did not anticipate strengthening;[112] however, Peter intensified to winds of 70 mph (110 km/h) late on December 9, after an eye feature developed. Usually that would indicate hurricane intensity, but as the eye was short-lived, Peter remained a tropical storm. It turned northward ahead of the same frontal system that absorbed Tropical Storm Odette, and the combination of strong upper-level winds and cooler water temperatures caused quick weakening. By December 10, Peter degenerated into a tropical depression, and after turning northeastward it was absorbed by the cold front the next day.[13]
Storm names[]
The following names were used for named storms that formed in the North Atlantic in 2003.[113] The names not retired from this list were used again in the 2009 season.[114] This is the same list used for the 1997 season.[115] Storms were named Larry, Mindy, Nicholas, Odette, and Peter for the first time in 2003.
|
Retirement[]
On April 30, 2004, The World Meteorological Organization retired three names: Fabian, Isabel, and Juan. They were replaced in the 2009 season by Fred, Ida, and Joaquin, respectively.[17] However, due to lack of activity in 2009, the name Joaquin was not used until the 2015 season.
Season effects[]
This is a table of all the storms that have formed in the 2003 Atlantic hurricane season It includes their duration, names, landfall(s), denoted in parentheses, damages, and death totals. Deaths in parentheses are additional and indirect (an example of an indirect death would be a traffic accident), but were still related to that storm. Damage and deaths include totals while the storm was extratropical, a wave, or a low, and all the damage figures are in 2003 USD.
| Saffir–Simpson scale | ||||||
| TD | TS | C1 | C2 | C3 | C4 | C5 |
| Storm name |
Dates active | Storm category
at peak intensity |
Max 1-min wind mph (km/h) |
Min. press. (mbar) |
Areas affected | Damage (USD) |
Deaths | Refs
| ||
|---|---|---|---|---|---|---|---|---|---|---|
| Ana | April 20 – 24 | Tropical storm | 60 (95) | 994 | Florida, Bermuda, Azores, British Isles | Moderate | 2 | |||
| Two | June 11 | Tropical depression | 35 (55) | 1008 | None | None | None | |||
| Bill | June 28 – July 2 | Tropical storm | 60 (95) | 997 | Gulf Coast of the United States, Southeastern United States | $50.5 million | 4 | |||
| Claudette | July 8 – 17 | Category 1 hurricane | 90 (150) | 979 | Yucatán Peninsula, Texas, Windward Islands, Jamaica | $181 million | 1 (2) | |||
| Danny | July 16 – 21 | Category 1 hurricane | 75 (120) | 1000 | None | None | None | |||
| Six | July 19 – 21 | Tropical depression | 35 (55) | 1010 | None | None | None | |||
| Seven | July 25 – 27 | Tropical depression | 35 (55) | 1016 | Georgia | None | None | |||
| Erika | August 14 – 17 | Category 1 hurricane | 75 (120) | 988 | Florida, Mexico, Southern Texas | $100 thousand | 2 | |||
| Nine | August 21 – 22 | Tropical depression | 35 (55) | 1007 | Lesser Antilles, Puerto Rico, Dominican Republic | $20 thousand | None | |||
| Fabian | August 25 – September 8 | Category 4 hurricane | 145 (235) | 939 | Leeward Islands, Bermuda, Eastern Canada | $300 million | 8 | |||
| Grace | August 30 – September 2 | Tropical storm | 40 (65) | 1007 | Texas, Oklahoma, Ohio Valley, Mid-Atlantic States | $113 thousand | None | |||
| Henri | September 3 – 8 | Tropical storm | 60 (95) | 997 | Florida, Delaware, Pennsylvania | $19.6 million | None | |||
| Isabel | September 6 – 19 | Category 5 hurricane | 165 (270) | 915 | Lesser Antilles, Greater Antilles, Turks and Caicos Islands, Bahamas, East coast of the United States, Atlantic Canada | $3.6 billion | 16 (35) | |||
| Fourteen | September 8 – 10 | Tropical depression | 35 (55) | 1007 | None | None | None | |||
| Juan | September 24 – 29 | Category 2 hurricane | 105 (170) | 969 | Eastern Canada (Nova Scotia and Prince Edward Island) | $200 million | 4 (4) | |||
| Kate | September 25 – October 7 | Category 3 hurricane | 125 (205) | 952 | Newfoundland, Iceland, Europe | None | None | |||
| Larry | October 1 – 6 | Tropical storm | 65 (100) | 993 | Central America | $53.6 million | 5 | |||
| Mindy | October 10 – 14 | Tropical storm | 45 (75) | 1002 | Hispaniola, Puerto Rico | $50 thousand | None | |||
| Nicholas | October 13 – 23 | Tropical storm | 70 (110) | 990 | None | None | None | |||
| Odette | December 4 – 7 | Tropical storm | 65 (100) | 993 | Dominican Republic, Haiti, Puerto Rico | $8 million | 8 (2) | |||
| Peter | December 7 – 11 | Tropical storm | 70 (110) | 990 | None | None | None | |||
| Season aggregates | ||||||||||
| 21 systems | April 20 – December 11 | 165 (270) | 915 | $4.42 billion | 50 (43) | |||||
See also[]
- Tropical cyclones in 2003
- List of Pacific hurricanes
- Pacific hurricane season
- 2003 Pacific hurricane season
- 2003 Pacific typhoon season
- 2003 North Indian Ocean cyclone season
- South-West Indian Ocean cyclone seasons: 2002–03, 2003–04
- Australian region cyclone seasons: 2002–03, 2003–04
- South Pacific cyclone seasons: 2002–03, 2003–04
References[]
- ^ "NOAA Reviews Record-Setting 2005 Atlantic Hurricane Season". National Oceanic and Atmospheric Administration. April 13, 2006. Archived from the original on April 23, 2006. Retrieved April 26, 2006.
- ^ "NOAA Forecasters Say Six to Nine Hurricanes Could Threaten in 2003". National Oceanic and Atmospheric Administration. May 19, 2003. Archived from the original on July 15, 2007. Retrieved December 15, 2007.
- ^ William M. Gray; Philip J. Klotzbach; Christopher W. Landsea (April 4, 2003). "Extended Range Forecast of Atlantic Seasonal Hurricane Activity and U.S. Landfall Strike Probability for 2003". Colorado State University. Archived from the original on September 14, 2006. Retrieved December 15, 2007.
- ^ William M. Gray; Philip J. Klotzbach; Christopher W. Landsea (May 30, 2003). "Extended Range Forecast of Atlantic Seasonal Hurricane Activity and U.S. Landfall Strike Probability for 2003". Colorado State University. Archived from the original on July 19, 2011. Retrieved December 15, 2007.
- ^ William M. Gray; Philip J. Klotzbach; Christopher W. Landsea (August 6, 2003). "Updated Forecast of Atlantic Seasonal Hurricane Activity and U.S. Landfall Strike Probability for 2003". Colorado State University. Archived from the original on July 19, 2011. Retrieved December 15, 2007.
- ^ "2003 Atlantic Hurricane Outlook Update". National Oceanic and Atmospheric Administration. August 7, 2003. Archived from the original on November 29, 2014. Retrieved December 15, 2007.
- ^ Climate Prediction Center (2002). "Background Information: The North Atlantic Hurricane Season". National Oceanic and Atmospheric Administration. Archived from the original on February 11, 2012. Retrieved June 2, 2006.
- ^ Jump up to: a b Martin Merzer (May 20, 2003). "Hurricane forecast 'not good news'". Miami Herald. p. 1B. Retrieved February 25, 2021 – via Newspapers.com.

- ^ Jump up to: a b c d John L. Beven (December 19, 2003). Tropical Cyclone Report: Tropical Storm Ana (PDF) (Report). National Hurricane Center. Retrieved January 31, 2017.
- ^ Frank Lepore (2003). "NOAA Extends Hurricane Forecasts From Three To Five Days". National Oceanic and Atmospheric Administration. Archived from the original on December 14, 2007. Retrieved December 15, 2007.
- ^ National Hurricane Center (2003). "Tropical Weather Summary for July 2003". Archived from the original on October 23, 2012. Retrieved December 15, 2007.
- ^ Jump up to: a b c d e James L. Franklin (December 19, 2003). "Tropical Cyclone Report: Tropical Storm Odette" (PDF). National Hurricane Center. Retrieved February 25, 2021.
- ^ Jump up to: a b c Lixion A. Avila (December 17, 2003). "Tropical Cyclone Report: Tropical Storm Peter" (PDF). National Hurricane Center. Retrieved February 25, 2021.
- ^ "Atlantic hurricane best track (HURDAT version 2)" (Database). United States National Hurricane Center. May 25, 2020.
- ^ Hurricane Research Division (March 2011). "Atlantic basin Comparison of Original and Revised HURDAT". National Oceanic and Atmospheric Administration. Archived from the original on November 29, 2011. Retrieved July 23, 2011.
- ^ David Levinson (August 20, 2008). "2005 Atlantic Ocean Tropical Cyclones". National Climatic Data Center. Archived from the original on December 1, 2005. Retrieved July 23, 2011.
- ^ Jump up to: a b c d e f World Meteorological Organization (2004). "Final Report of the Twenty-Sixth Session" (PDF). Archived from the original (PDF) on January 2, 2014. Retrieved June 3, 2006.
- ^ Jump up to: a b c d Jack L. Beven (September 9, 2003). "Tropical Cyclone Report: Hurricane Claudette" (PDF). National Hurricane Center. Retrieved February 25, 2021.
- ^ Jump up to: a b c d e Jack L. Beven & Hugh D. Cobb (September 9, 2014). "Tropical Cyclone Report: Hurricane Isabel" (PDF). National Hurricane Center. Retrieved February 25, 2021.
- ^ Church World Service (2003). "The CWS Response" (PDF). Archived from the original (PDF) on February 3, 2007. Retrieved February 21, 2007.
- ^ Jump up to: a b United States Department of Commerce (2004). "Service Assessment of Hurricane Isabel" (PDF). National Oceanic and Atmospheric Administration. Archived from the original (PDF) on September 27, 2006. Retrieved February 10, 2007.
- ^ PartnerRE Ltd. (2003). "PartnerRe Weathers Hurricane Fabian". Archived from the original on April 13, 2010. Retrieved October 17, 2006.
- ^ Karen Smith; Dan Rutstein (September 6, 2003). "Search for the missing a 'difficult job'". The Royal Gazette. Archived from the original on April 7, 2015. Retrieved December 9, 2011.
- ^ Jump up to: a b c d Richard J. Pasch; Eric S. Blake; Daniel P. Brown (November 19, 2003). "Tropical Cyclone Report: Hurricane Fabian" (PDF). National Hurricane Center. Retrieved February 25, 2021.CS1 maint: multiple names: authors list (link)
- ^ Jump up to: a b Chris Fogarty (2003). "Hurricane Juan Storm Summary" (PDF). Canadian Hurricane Centre/Environment Canada. Archived (PDF) from the original on December 1, 2007. Retrieved December 21, 2007.
- ^ "Bermuda Weather for April 2003". Bermuda Weather Service. May 25, 2003. Archived from the original on February 8, 2012. Retrieved February 25, 2021.
- ^ Gary Padgett (2003). "April 2003 Global Tropical Cyclone Summary". Archived from the original on December 6, 2012. Retrieved February 25, 2021.
- ^ Jump up to: a b c James L. Franklin (August 6, 2003). Tropical Cyclone Report: Tropical Depression Two (PDF) (Report). United States National Hurricane Center. Retrieved January 31, 2017.
- ^ Jump up to: a b Lixion A. Avila (June 11, 2003). "Tropical Depression Two Discussion Number One". National Hurricane Center. Archived from the original on August 12, 2014. Retrieved November 29, 2010.
- ^ Jump up to: a b Richard J. Pasch; Stacy R. Stewart; Miles B. Lawrence (July 1, 2003). "June 2003 Tropical Weather Summary". National Hurricane Center. Archived from the original on August 12, 2014. Retrieved November 29, 2010.CS1 maint: multiple names: authors list (link)
- ^ Gary Padgett (2000). "Monthly Global Tropical Cyclone Summary June 2000". Australia Severe Weather. Archived from the original on December 18, 2014. Retrieved February 25, 2021.
- ^ Michael J. Brennan (March 5, 2018). Tropical Cyclone Report: Tropical Storm Bret (PDF) (Report). National Hurricane Center. Retrieved February 25, 2021.
- ^ Richard J. Pasch (June 11, 2003). "Tropical Depression Two Discussion Number Two". National Hurricane Center. Archived from the original on August 12, 2014. Retrieved February 25, 2021.
- ^ Mike Formosa (June 13, 2003). "Tropical Weather Discussion". National Hurricane Center. Retrieved February 25, 2021.
- ^ Mike Formosa (June 13, 2003). "Tropical Weather Discussion". National Hurricane Center. Retrieved November 29, 2010.
- ^ Jump up to: a b Lixion A. Avila (July 30, 2003). "Tropical Cyclone Report: Tropical Storm Bill" (PDF). National Hurricane Center. Retrieved February 25, 2021.
- ^ National Climatic Data Center (August 2, 2003). "Event Report for Louisiana". Archived from the original on December 7, 2008. Retrieved November 29, 2010.
- ^ National Climatic Data Center (August 2, 2003). "Event Report for Louisiana (2)". Archived from the original on December 7, 2008. Retrieved November 29, 2010.
- ^ New Orleans National Weather Service (October 9, 2003). "Tropical Storm Bill Post Tropical Cyclone Report". Archived from the original on September 30, 2006. Retrieved November 29, 2010.
- ^ "Gulf Coast reeling from Tropical Storm Bill". USA Today. June 30, 2003. Archived from the original on January 16, 2016. Retrieved November 29, 2010.
- ^ National Weather Service at Houston/Galveston (2003). "Upper Texas Coast Tropical Cyclones in the 2000s". Archived from the original on January 11, 2007. Retrieved December 15, 2007.
- ^ Jump up to: a b Stacy R. Stewart (November 27, 2003). Tropical Cyclone Report: Hurricane Danny (PDF) (Report). National Hurricane Center. Retrieved January 31, 2017.
- ^ Jump up to: a b c d Miles B. Lawrence (August 18, 2003). "Tropical Cyclone Report: Tropical Depression Six" (PDF). National Hurricane Center. Retrieved February 25, 2021.
- ^ Lixion A. Avila (July 19, 2003). "Tropical Weather Outlook". National Hurricane Center. Retrieved February 25, 2021.
- ^ Lixion A. Avila (July 19, 2003). "Tropical Depression Six Discussion Number One". National Hurricane Center. Archived from the original on August 12, 2014. Retrieved February 25, 2021.
- ^ Stacy R. Stewart (June 20, 2003). "Tropical Depression Six Discussion Number Three". National Hurricane Center. Archived from the original on August 12, 2014. Retrieved February 25, 2021.
- ^ Miles B. Lawrence (July 20, 2003). "Tropical Depression Six Discussion Number Four". National Hurricane Center. Archived from the original on February 13, 2015. Retrieved February 25, 2021.
- ^ Jack L. Beven (July 21, 2003). "Tropical Depression Six Discussion Number Six". National Hurricane Center. Archived from the original on February 13, 2015. Retrieved February 25, 2021.
- ^ Stacy R. Stewart (July 22, 2003). "Tropical Weather Outlook". National Hurricane Center. Retrieved February 25, 2021.
- ^ Jump up to: a b c d Richard J. Pasch (November 30, 2003). "Tropical Cyclone Report: Tropical Depression Seven" (PDF). National Hurricane Center. Retrieved February 25, 2021.
- ^ Lixion A. Avila (July 25, 2003). "Tropical Depression Seven Discussion Number One". National Hurricane Center. Archived from the original on August 12, 2014. Retrieved February 25, 2021.
- ^ "Saturday: No. 7 Unlucky For Soggy Georgia, SC". WJXT. July 26, 2003. Archived from the original on May 24, 2011. Retrieved February 25, 2021.
- ^ David M. Roth (August 4, 2008). "Tropical Depression #7 – July 25–27, 2003". Hydrometeorological Prediction Center. Archived from the original on December 21, 2014. Retrieved November 29, 2010.
- ^ Jump up to: a b James L. Franklin (November 13, 2003). "Tropical Cyclone Report: Hurricane Erika" (PDF). National Hurricane Center. Retrieved February 25, 2021.
- ^ Jump up to: a b Lixion A. Avila (November 17, 2003). "Tropical Cyclone Report: Tropical Depression Nine" (PDF). National Hurricane Center. Retrieved February 25, 2021.
- ^ Stacy R. Stewart (August 18, 2003). "Tropical Weather Outlook". National Hurricane Center. Retrieved February 25, 2021.
- ^ Lixion A. Avila (August 21, 2003). "Tropical Depression Nine Discussion Number One". National Hurricane Center. Archived from the original on August 12, 2014. Retrieved February 25, 2021.
- ^ National Climatic Data Center (2003). "Event Report for Puerto Rico". Archived from the original on May 19, 2011. Retrieved October 24, 2006.
- ^ Jump up to: a b National Climatic Data Center (2003). "Event Report for Puerto Rico (2)". Archived from the original on May 19, 2011. Retrieved October 24, 2006.
- ^ National Climatic Data Center (2003). "Event Report for Puerto Rico (3)". Archived from the original on May 19, 2011. Retrieved October 24, 2006.
- ^ National Climatic Data Center (2003). "Event Report for Puerto Rico (4)". Archived from the original on May 19, 2011. Retrieved October 24, 2006.
- ^ Stormcarib.net (2003). "Unofficial Reports from the Dominican Republic". Archived from the original on February 13, 2015. Retrieved February 25, 2021.
- ^ Environment News Service (2003). "Bermuda's National Bird Blown Away". Archived from the original on February 26, 2014. Retrieved February 25, 2021.
- ^ Karen Smith & Dan Rutstein (September 6, 2003). "Search for the missing a difficult job". The Royal Gazette. Archived from the original on December 10, 2008. Retrieved February 25, 2021.
- ^ The Royal Gazette (September 6, 2003). "Bermuda Shorts — Fabian". Archived from the original on December 10, 2008. Retrieved February 3, 2008.
- ^ Jump up to: a b Stacy R. Stewart (November 27, 2003). "Tropical Cyclone Report: Tropical Storm Grace" (PDF). National Hurricane Center. Retrieved February 25, 2021.
- ^ David M. Roth (2005). "Rainfall data for Tropical Storm Grace". Hydrometeorological Prediction Center. Archived from the original on December 21, 2014. Retrieved December 17, 2007.
- ^ Jim O'Donnel (September 5, 2003). "Tropical Storm Grace Preliminary Storm Report". Jamaica Beach Weather Observatory. Archived from the original on July 5, 2008. Retrieved February 25, 2021.
- ^ Ty Judd (2003). "The 2003 Labor Day Weekend Heavy Rain and Flooding Event". Norman, Oklahoma National Weather Service. Archived from the original on June 4, 2006. Retrieved February 25, 2021.
- ^ Paducah, Kentucky National Weather Service (2003). "Autumn 2003 Weather Summary". Archived from the original on August 5, 2012. Retrieved February 25, 2021.
- ^ Jump up to: a b Daniel P. Brown & Miles B. Lawrence (November 17, 2003). "Tropical Cyclone Report: Tropical Storm Henri" (PDF). National Hurricane Center. Retrieved February 25, 2021.
- ^ James L. Franklin (September 12, 2003). "Tropical Weather Outlook". National Hurricane Center. Retrieved February 25, 2021.
- ^ David M. Roth (2006). "Rainfall information on Tropical Storm Henri". Hydrometeorological Prediction Center. Archived from the original on September 22, 2013. Retrieved February 25, 2021.
- ^ National Climatic Data Center (2003). "Event Report for Delaware". Archived from the original on January 12, 2012. Retrieved December 19, 2007.
- ^ Jump up to: a b National Climatic Data Center (2003). "Event Report for Pennsylvania". Archived from the original on January 12, 2012. Retrieved December 19, 2007.
- ^ Stefanie Baxter (November 24, 2003). "Henri Visits Delaware" (PDF). Delaware Geological Survey. Archived from the original (PDF) on September 28, 2011. Retrieved February 1, 2011.
- ^ Lixion A. Avila (September 6, 2003). "Tropical Storm Isabel Discussion Number Two". National Hurricane Center. Archived from the original on August 25, 2018. Retrieved February 25, 2021.
- ^ Scotsman.com (September 19, 2003). "America feels the wrath of Isabel". The Scotsman. Edinburgh. Archived from the original on June 5, 2011. Retrieved February 25, 2021.
- ^ National Climatic Data Center (2003). "Climate of 2003 – Comparison of Hurricanes Floyd, Hugo and Isabel". Archived from the original on January 21, 2017. Retrieved February 25, 2021.
- ^ Jump up to: a b c d James L. Franklin (September 11, 2003). "Tropical Cyclone Report: Tropical Depression Fourteen" (PDF). National Hurricane Center. Retrieved February 25, 2021.
- ^ Jump up to: a b Stacy R. Stewart (September 8, 2003). "Tropical Depression Fourteen Discussion Number One". National Hurricane Center. Archived from the original on August 12, 2014. Retrieved February 25, 2021.
- ^ Stacy R. Stewart (September 8, 2003). "Tropical Depression Fourteen Discussion Number Two". National Hurricane Center. Archived from the original on August 12, 2014. Retrieved February 25, 2021.
- ^ Richard D. Knabb & James L. Franklin (September 9, 2003). "Tropical Depression Fourteen Discussion Number Three". National Hurricane Center. Archived from the original on February 13, 2015. Retrieved February 25, 2021.
- ^ Lixion A. Avila (September 10, 2003). "Tropical Depression Fourteen Public Advisory Eight". National Hurricane Center. Archived from the original on February 13, 2015. Retrieved February 25, 2021.
- ^ Jump up to: a b c d Lixion A. Avila (September 13, 2012). "Hurricane Juan Tropical Cyclone Report" (PDF). National Hurricane Center. Retrieved February 25, 2021.
- ^ Lixion A. Avila (September 17, 2003). "Tropical Weather Outlook". National Hurricane Center. Retrieved February 25, 2021.
- ^ Lixion A. Avila (September 27, 2003). "Hurricane Juan Discussion Number Ten". National Hurricane Center. Archived from the original on October 20, 2012. Retrieved February 25, 2021.
- ^ Richard J. Pasch; Robert Molleda (November 30, 2003). "Tropical Cyclone Report: Hurricane Kate" (PDF). National Hurricane Center. Retrieved February 25, 2021.CS1 maint: multiple names: authors list (link)
- ^ Guy Rousell; Peter Bowyer (October 6, 2003). "Canadian Hurricane Information Statement at 9:30 AM NDT Monday October 6, 2003". Canadian Hurricane Centre. Archived from the original on October 2, 2006. Retrieved February 25, 2021.CS1 maint: multiple names: authors list (link)
- ^ CBC news (October 7, 2003). "Lots of rain, but no flooding from Kate". CBC News. Archived from the original on December 4, 2008. Retrieved February 25, 2021.
- ^ Jump up to: a b Sean Collins (November 2003). "Wavetraks October Newsletter". Surfline Forecast Team. Archived from the original on February 5, 2012. Retrieved October 9, 2006.
- ^ Jump up to: a b c Stacy R. Stewart (December 7, 2003). "Tropical Cyclone Report: Tropical Storm Larry" (PDF). National Hurricane Center. Retrieved February 25, 2021.
- ^ Servicio Meteorológico Nacional (2003). "Tormenta Tropical "Larry" del Océano Atlántico" (in Spanish). Archived from the original on December 29, 2005. Retrieved February 25, 2021.
- ^ "Tropical Depression Olaf weakens after moving inland". Associated Press. October 8, 2003. Archived from the original on September 30, 2007. Retrieved February 25, 2021.
- ^ Foro Consultivo Cientifico y Technológio (2005). "Desastres mayores registrados en México de 1980 a 2003" (PDF) (in Spanish). Archived (PDF) from the original on September 1, 2006. Retrieved June 3, 2006.
- ^ Jump up to: a b c d Miles B. Lawrence (February 9, 2004). "Tropical Cyclone Report: Tropical Storm Mindy" (PDF). National Hurricane Center. Retrieved February 25, 2021.
- ^ Jack L. Beven (October 8, 2003). "Tropical Weather Outlook". National Hurricane Center. Retrieved February 25, 2021.
- ^ David M. Roth (2005). "Rainfall Information for Tropical Storm Mindy". Hydrometeorological Prediction Center. Archived from the original on September 22, 2013. Retrieved October 9, 2006.
- ^ National Climatic Data Center (2003). "Event Report for Puerto Rico (6)". Archived from the original on December 7, 2008. Retrieved October 9, 2006.
- ^ Jump up to: a b National Climatic Data Center (2003). "Event Report for Puerto Rico (8)". Archived from the original on December 7, 2008. Retrieved October 9, 2006.
- ^ Jump up to: a b National Climatic Data Center (2003). "Event Report for Puerto Rico (12)". Archived from the original on December 7, 2008. Retrieved October 9, 2006.
- ^ National Climatic Data Center (2003). "Event Report for Puerto Rico (3)". Archived from the original on June 13, 2007. Retrieved October 9, 2006.
- ^ National Climatic Data Center (2003). "Event Report for Puerto Rico (4)". Archived from the original on June 13, 2007. Retrieved October 9, 2006.
- ^ National Climatic Data Center (2003). "Event Report for Puerto Rico (11)". Archived from the original on June 13, 2007. Retrieved October 9, 2006.
- ^ Jump up to: a b World Meteorological Organization (2004). "Final Report of the 2003 Hurricane Season" (PDF). Archived from the original (PDF) on October 29, 2005. Retrieved February 25, 2021.
- ^ Jack L. Beven (October 11, 2003). "Tropical Storm Mindy Discussion Number Two". National Hurricane Center. Archived from the original on October 24, 2012. Retrieved February 25, 2021.
- ^ John L. Beven (January 7, 2004). Tropical Cyclone Report: Tropical Storm Nicholas (PDF) (Report). United States National Hurricane Center. Retrieved January 31, 2017.
- ^ Sean Collins (December 16, 2003). "XXL Storm of the month". Surfline Forecast Team. Archived from the original on March 2, 2012. Retrieved February 25, 2021.
- ^ Gary Padgett (2003). "Monthly Global Tropical Cyclone Summary — November 2003". Archived from the original on October 27, 2014. Retrieved February 25, 2021.
- ^ Michael Chenoweth (2006). "A Reassessment of Historical Atlantic Basin Tropical Cyclone Activity, 1700–1855". National Oceanic and Atmospheric Administration. Archived from the original on October 5, 2008. Retrieved February 25, 2021.
- ^ David M. Roth (June 20, 2007). "Tropical Storm Odette — December 3–7, 2003". Hydrometeorological Prediction Center. Archived from the original on April 4, 2015. Retrieved February 25, 2021.
- ^ Lixion A. Avila (December 7, 2003). "Tropical Storm Peter Discussion Number One". National Hurricane Center. Archived from the original on October 24, 2012. Retrieved February 25, 2021.
- ^ Aline Mendelsohn (June 10, 2003). "Hurricane names aren't meant to kick up a storm". Orlando Sentinel. p. E1. Retrieved February 25, 2021 – via Newspapers.com.
- ^ "Hurricane names for 2012-2016". Sun-Sentinel. April 17, 2011. Retrieved February 25, 2021.
- ^ "Names Are Listed For 1997 Hurricanes". The New York Times. Associated Press. May 26, 1997. Retrieved February 25, 2021.
External links[]
| Wikimedia Commons has media related to 2003 Atlantic hurricane season. |
- Monthly Weather Review
- National Hurricane Center 2003 Atlantic hurricane season summary
- U.S. Rainfall from Tropical Cyclones in 2003
| show Tropical cyclones of the 2003 Atlantic hurricane season |
|---|

- 2003 Atlantic hurricane season
- Atlantic hurricane seasons
- Tropical cyclones in 2003