Atlantic hurricane

(1851–2019)
| Part of a series on |
| Weather |
|---|
 |
|
|
An Atlantic hurricane or tropical storm is a tropical cyclone that forms in the Atlantic Ocean, primarily between the months of June and November. A hurricane differs from a cyclone or typhoon only on the basis of location.[1] A hurricane is a storm that occurs in the Atlantic Ocean and northeastern Pacific Ocean, a typhoon occurs in the northwestern Pacific Ocean, and a cyclone occurs in the South Pacific Ocean or Indian Ocean.[1]
Tropical cyclones can be categorized by intensity. Tropical storms have one-minute maximum sustained winds of at least 39 mph (34 knots, 17 m/s, 63 km/h), while hurricanes have one-minute maximum sustained winds exceeding 74 mph (64 knots, 33 m/s, 119 km/h).[2] Most North Atlantic tropical storms and hurricanes form between June 1 and November 30.[3] The United States National Hurricane Center monitors the basin and issues reports, watches, and warnings about tropical weather systems for the North Atlantic Basin as one of the Regional Specialized Meteorological Centers for tropical cyclones, as defined by the World Meteorological Organization.[4]
In recent times, tropical disturbances that reach tropical storm intensity are named from a predetermined list. Hurricanes that result in significant damage or casualties may have their names retired from the list at the request of the affected nations in order to prevent confusion should a subsequent storm be given the same name.[5] On average, in the North Atlantic basin (from 1966 to 2009) 11.3 named storms occur each season, with an average of 6.2 becoming hurricanes and 2.3 becoming major hurricanes (Category 3 or greater).[6] The climatological peak of activity is around September 10 each season.[6]
In March 2004, Catarina was the first hurricane-intensity tropical cyclone to be recorded in the Southern Atlantic Ocean. Since 2011, the Brazilian Navy Hydrographic Center has started to use the same scale as the North Atlantic Ocean for tropical cyclones in the South Atlantic Ocean and assign names to those which reach 35 kn (65 km/h; 40 mph).[7]
Steering factors[]

Tropical cyclones are steered by the surrounding flow throughout the depth of the troposphere (the atmosphere from the surface to about eight miles (13 km) high). Neil Frank, former director of the United States National Hurricane Center, used the analogies such as "a leaf carried along in a stream" or a "brick moving through a river of air" to describe the way atmospheric flow affects the path of a hurricane across the ocean. Specifically, air flow around high pressure systems and toward low-pressure areas influences hurricane tracks.
In the tropical latitudes, tropical storms and hurricanes generally move westward with a slight tendency toward the north, under the influence of the subtropical ridge, a high-pressure system that usually extends east–west across the subtropics.[8] South of the subtropical ridge, surface easterly winds (blowing from east to west) prevail. If the subtropical ridge is weakened by an upper trough, a tropical cyclone may turn poleward and then recurve,[9] or curve back toward the northeast into the main belt of the Westerlies. Poleward (north) of the subtropical ridge, westerly winds prevail and generally steer tropical cyclones that reach northern latitudes toward the east. The westerlies also steer extratropical cyclones with their cold and warm fronts from west to east.[10]
Intensity[]
| Most intense Atlantic hurricanes | |||||
|---|---|---|---|---|---|
| Rank | Hurricane | Season | Pressure | ||
| hPa | inHg | ||||
| 1 | Wilma | 2005 | 882 | 26.05 | |
| 2 | Gilbert | 1988 | 888 | 26.23 | |
| 3 | "Labor Day" | 1935 | 892 | 26.34 | |
| 4 | Rita | 2005 | 895 | 26.43 | |
| 5 | Allen | 1980 | 899 | 26.55 | |
| 6 | Camille | 1969 | 900 | 26.58 | |
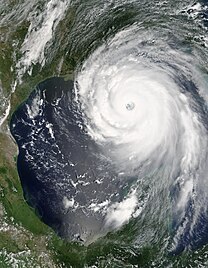
| 7 | Katrina | 2005 | 902 | 26.64 | |
| 8 | Mitch | 1998 | 905 | 26.73 | |
| Dean | 2007 | ||||
| 10 | Maria | 2017 | 908 | 26.81 | |
| Source: HURDAT[11] | |||||
Generally speaking, the intensity of a tropical cyclone is determined by either the storm's maximum sustained winds or lowest barometric pressure. The following table lists the most intense Atlantic hurricanes in terms of their lowest barometric pressure. In terms of wind speed, Hurricane Allen (in 1980) was the strongest Atlantic tropical cyclone on record, with maximum sustained winds of 190 mph (305 km/h). However, these measurements are suspect since instrumentation used to document wind speeds at the time would likely succumb to winds of such intensity.[12] Nonetheless, their central pressures are low enough to rank them among the strongest recorded Atlantic hurricanes.[11]
Owing to their intensity, the strongest Atlantic hurricanes have all attained Category 5 classification. Hurricane Opal, the strongest Category 4 hurricane recorded, intensified to reach a minimum pressure of 916 mbar (hPa; 27.05 inHg),[13] a pressure typical of Category 5 hurricanes.[14] Nonetheless, the pressure remains too high to list Opal as one of the ten strongest Atlantic tropical cyclones.[11] Hurricane Wilma is the strongest Atlantic hurricane recorded, after reaching an intensity of 882 mbar (hPa; 26.05 inHg) in October 2005;[12] this also made Wilma the strongest tropical cyclone worldwide outside of the West Pacific,[15][16][17][18][19] where seven tropical cyclones have been recorded to intensify to lower pressures.[20] However, this was later superseded by Hurricane Patricia in 2015 in the east Pacific, which had a pressure reading of 872 mbar. Preceding Wilma is Hurricane Gilbert, which had also held the record for most intense Atlantic hurricane for 17 years.[21] The 1935 Labor Day hurricane, with a pressure of 892 mbar (hPa; 26.34 inHg), is the third strongest Atlantic hurricane and the strongest documented tropical cyclone prior to 1950.[11] Since the measurements taken during Wilma and Gilbert were documented using dropsonde, this pressure remains the lowest measured over land.[22]
Hurricane Rita is the fourth strongest Atlantic hurricane in terms of barometric pressure and one of three tropical cyclones from 2005 on the list, with the others being Wilma and Katrina at first and seventh respectively.[11] However, with a barometric pressure of 895 mbar (hPa; 26.43 inHg), Rita is the strongest tropical cyclone ever recorded in the Gulf of Mexico.[23] Mitch and Dean share intensities for the eighth strongest Atlantic hurricane at 905 mbar (hPa; 26.72 inHg).[22] The tenth place for most intense Atlantic tropical cyclone is Hurricane Maria listed to have deepened to a pressure as low as 908 mbar (hPa; 26.81 inHg).[11]
Many of the strongest recorded tropical cyclones weakened prior to their eventual landfall or demise. However, three of the storms remained intense enough at landfall to be considered some of the strongest landfalling hurricanes – three of the ten hurricanes on the list constitute the three most intense Atlantic landfalls in recorded history. The 1935 Labor Day hurricane made landfall at peak intensity, making it the most intense Atlantic landfall. Though it weakened slightly before its eventual landfall on the Yucatán Peninsula, Hurricane Gilbert maintained a pressure of 900 mbar (hPa; 26.58 inHg) at landfall, as did Camille, making their landfalls tied as the second strongest. Similarly, Hurricane Dean made landfall on the peninsula, though it did so at peak intensity and with a higher barometric pressure; its landfall marked the fourth strongest in Atlantic hurricane history.[22]
Climatology[]
| Total and Average Number of Tropical Storms by Month (1851–2017) | |||
|---|---|---|---|
| Month | Total | Average per year | |
| January — April | 7 | <0.05 | |
| May | 22 | 0.1 | |
| June | 92 | 0.5 | |
| July | 120 | 0.7 | |
| August | 389 | 2.3 | |
| September | 584 | 3.5 | |
| October | 341 | 2.0 | |
| November | 91 | 0.5 | |
| December | 17 | 0.1 | |
| Source: NOAA FAQ[24] | |||
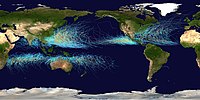
Climatology serves to characterize the general properties of an average season and can be used as one of many other tools for making forecasts. Most storms form in warm waters several hundred miles north of the equator near the Intertropical convergence zone from tropical waves. The Coriolis force is usually too weak to initiate sufficient rotation near the equator.[25] Storms frequently form in the warm waters of the Gulf of Mexico, the Caribbean, and the tropical Atlantic Ocean as far east as the Cape Verde Islands, the origin of strong and long-lasting Cape Verde-type hurricanes. Systems may also strengthen over the Gulf Stream off the coast of the eastern United States, wherever water temperatures exceed 26.5 °C (79.7 °F).[25]
Although most storms are found within tropical latitudes, occasionally storms will form further north and east from disturbances other than tropical waves such as cold fronts and upper-level lows. These are known as baroclinically induced tropical cyclones.[26] There is a strong correlation between Atlantic hurricane activity in the tropics and the presence of an El Niño or La Niña in the Pacific Ocean. El Niño events increase the wind shear over the Atlantic, producing a less-favorable environment for formation and decreasing tropical activity in the Atlantic basin. Conversely, La Niña causes an increase in activity due to a decrease in wind shear.[27]
According to the Azores High hypothesis by , an anti-phase pattern is expected to exist between the Gulf of Mexico coast and the North American Atlantic coast. During the quiescent periods (3000–1400 BC, and 1000 AD to present), a more northeasterly position of the Azores High would result in more hurricanes being steered toward the Atlantic coast. During the hyperactive period (1400 BC to 1000 AD), more hurricanes were steered towards the Gulf coast as the Azores High was shifted to a more southwesterly position near the Caribbean.[28][29] Such a displacement of the Azores High is consistent with paleoclimatic evidence that shows an abrupt onset of a drier climate in Haiti around 3200 14C years BP,[30] and a change towards more humid conditions in the Great Plains during the late-Holocene as more moisture was pumped up the Mississippi Valley through the Gulf coast. Preliminary data from the northern Atlantic coast seem to support the Azores High hypothesis. A 3000-year proxy record from a coastal lake in Cape Cod suggests that hurricane activity has increased significantly during the past 500–1000 years, just as the Gulf coast was amid a quiescent period of the last millennium.
Seasonal variation[]
Climatologically speaking, approximately 97 percent of tropical cyclones that form in the North Atlantic develop between the dates of June 1 and November 30 – dates which delimit the modern-day Atlantic hurricane season. Though the beginning of the annual hurricane season has historically remained the same, the official end of the hurricane season has shifted from its initial date of October 31. Regardless, on average once every few years a tropical cyclone develops outside the limits of the season;[31] As of September 2021, there have been 88 tropical cyclones in the off-season, with the most recent being Tropical Storm Ana in May 2021. The first tropical cyclone of the 1938 Atlantic hurricane season, which formed on January 3, became the earliest forming tropical storm and hurricane after reanalysis concluded on the storm in December 2012.[32] Hurricane Able in 1951 was initially thought to be the earliest forming major hurricane – a tropical cyclone with winds exceeding 115 mph (185 km/h)[nb 1] – however following post-storm analysis it was determined that Able only reached Category 1 strength which made Hurricane Alma of 1966 the new record holder; as it became a major hurricane on June 8.[11] Though it developed within the bounds of the Atlantic hurricane season,[11][31] Hurricane Audrey in 1957 became the earliest developing Category 4 hurricane on record after it reached the intensity on June 27.[34] However, reanalysis from 1956 to 1960 by NOAA downgraded Audrey to a Category 3, making Hurricane Dennis of 2005 the earliest Category 4 on record on July 8, 2005.[35] The earliest-forming Category 5 hurricane, Emily, reached the highest intensity on the Saffir–Simpson hurricane wind scale on July 17, 2005.[36]
Though the official end of the Atlantic hurricane season occurs on November 30, the dates of October 31 and November 15 have also historically marked the official end date for the hurricane season.[31] December, the only month of the year after the hurricane season, has featured the cyclogenesis of fourteen tropical cyclones.[11] Tropical Storm Zeta in 2005 was the latest tropical cyclone to attain tropical storm intensity as it did so on December 30. However, the second Hurricane Alice in 1954 was the latest forming tropical cyclone to attain hurricane intensity. Both Zeta and Alice were the only two storms to exist in two calendar years – the former from 1954 to 1955 and the latter from 2005 to 2006.[37] No storms have been recorded to exceed Category 1 hurricane intensity in December.[11] In 1999, Hurricane Lenny reached Category 4 intensity on November 17 as it took an unprecedented west to east track across the Caribbean; its intensity made it the latest developing Category 4 hurricane, though this was well within the bounds of the hurricane season.[38] Hurricane Hattie (October 27 – November 1, 1961) was initially thought to have been the latest forming Category 5 hurricane ever documented,[39] though reanalysis indicated that a devastating hurricane in 1932 reached such an intensity at a later date.[11][32] Consequently, this made the hurricane the latest developing tropical cyclone to reach all four Saffir–Simpson hurricane wind scale classifications past Category 1 intensity.[11] Although 2020's Hurricane Iota would go on to surpass the 1932 hurricane in both of these categories.
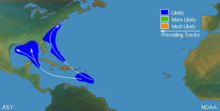
June[]

The beginning of the hurricane season is most closely related to the timing of increases in sea surface temperatures, convective instability, and other thermodynamic factors.[40] Although June marks the beginning of the hurricane season, generally little activity occurs during the month with an average of 1 tropical cyclone every 2 years. Tropical systems usually form in the Gulf of Mexico or off the east coast of the United States.[41]
Since 1851, a total of 81 tropical storms and hurricanes formed in the month of June. During this period, two of these systems developed in the deep tropics east of the Lesser Antilles.[41] Since 1870, three major hurricanes have formed during June, most notably Hurricane Audrey in 1957. Audrey attained an intensity greater than that of any Atlantic tropical cyclone during June or July until Hurricanes Dennis and Emily of 2005.[42] The easternmost forming storm during June, Tropical Storm Ana in 1979, formed at 45°W.[41]
July[]
Not much tropical activity occurs during the month of July, but the majority of hurricane seasons see the formation of one tropical cyclone during July. From an average of Atlantic tropical cyclone seasons from 1944 to 1996, the first tropical storm in half of the seasons occurred by 11 July, and a second formed by 8 August.[6]
Formation usually occurs in the eastern Caribbean around the Lesser Antilles, in the northern and eastern parts of the Gulf of Mexico, in the vicinity of the northern Bahamas, and off the coast of The Carolinas and Virginia over the Gulf Stream. Storms travel westward through the Caribbean and then either move towards the north and curve near the eastern coast of the United States or stay on a north-westward track and enter the Gulf of Mexico.[11]
Since 1851, a total of 105 tropical storms have formed during the month of July.[43] Since 1870, ten of these storms reached major hurricane intensity. Only Hurricane Emily of 2005, the strongest July tropical cyclone in the Atlantic basin, attained Category 5 hurricane status during July, making it the earliest Category 5 hurricane on record.[42][44] The easternmost forming storm and longest lived during the month of July, Hurricane Bertha in 2008, formed at 22.9°W and lasted 17 days.[45]
August[]
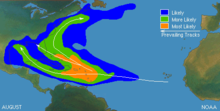
Decrease in wind shear from July to August contributes to a significant increase of tropical activity.[46] An average of 2.8 Atlantic tropical storms develop annually in August. On average, four named tropical storms, including one hurricane, occur by August 30, and the first intense hurricane develops by 4 September.[6]
September[]

The peak of the hurricane season occurs in September and corresponds with low wind shear[46] and the warmest sea surface temperatures.[47] The month of September sees an average of 3 storms a year. By 24 September, the average Atlantic season features 7 named tropical storms, including 4 hurricanes. In addition, two major hurricanes occur on average by 28 September. Relatively few tropical cyclones make landfall at these intensities.[6]
October[]

The favorable conditions found during September begin to decay in October. The main reason for the decrease in activity is increasing wind shear, although sea surface temperatures are also cooler than in September.[40] Activity falls markedly with 1.8 cyclones developing on average despite a climatological secondary peak around 20 October.[48] By 21 October, the average season features 9 named storms with 5 hurricanes. A third major hurricane occurs after 28 September in half of all Atlantic tropical cyclone seasons.[6] In contrast to mid-season activity, the mean locus of formation shifts westward to the Caribbean and Gulf of Mexico, reversing the eastward progression of June through August.[11]
November[]

Wind shear from westerlies increases substantially through November, generally preventing cyclone formation.[40] On average, one tropical storm forms during every other November. On rare occasions, a major hurricane occurs. The few intense hurricanes in November include Hurricane "Cuba" in late October and early November 1932 (the strongest November hurricane on record peaking as a Category 5 hurricane), Hurricane Lenny in mid-November 1999, Hurricane Kate in late November 1985 which was the latest major hurricane formation on record until Hurricane Otto (a category 3 storm) of the 2016 hurricane season.[11] Hurricane Paloma was a very potent category 4 storm that made landfall in Cuba in early November 2008, and Hurricane Eta strengthened into a Category 4 hurricane in early November 2020, becoming the second-most intense tropical cyclone in November, then made landfall in Central America. In that same year Hurricane Iota strengthened to a Category 4 hurricane on November 16, becoming the second most intense hurricane in November since 1933.[49]
December to May[]

Although the hurricane season is defined as beginning on June 1 and ending on November 30, there have been several off-season storms.[11] Since 1870, there have been 32 off-season cyclones, 18 of which occurred in May. In the same time span, nine storms formed in December, two in April, and one each in January, February and March.[42] During four years (1887,[50] 1953,[51] 2003, and 2007), tropical cyclones formed in the North Atlantic Ocean both during or before May and during December.[52] In 1887, four storms occurred outside the season, the most in a single year.[50] High vertical wind shear and low sea surface temperatures generally preclude tropical cyclone formation during the off-season.[6]
Tropical cyclones have formed in all months.[42] Four tropical cyclones existed during the month of January, two of which formed during late December: the second Hurricane Alice in 1954/1955, and Tropical Storm Zeta in 2005/2006. The only two hurricanes to form in January are a Category 1 hurricane in the 1938 season, and Hurricane Alex in the 2016 season. A subtropical storm in January also began the 1978 Atlantic hurricane season.[11] No major hurricanes have occurred in the off-season.[53]
Extremes[]
- The season in which the most tropical storms formed on record is the 2020 Atlantic hurricane season (30). However, 2005 was the one in which the most hurricanes formed on record (15).[11]
- The 2005 Atlantic hurricane season has had the most major hurricanes on record (7), also tied with 2020.[11] The 1950 Atlantic hurricane season and 1961 Atlantic hurricane season were once thought to have 8 and 7 respectively, but re-analysis showed that several storms during both seasons were weaker than thought, and thus the records are now held by the 2005 and 2020 seasons.
- The least active season on record since 1946 (when the database is considered more reliable) was the 1983 Atlantic hurricane season, with four tropical storms, two hurricanes, and one major hurricane. Overall, the 1914 Atlantic hurricane season remains the least active, with only one documented storm.[11]
- The most intense hurricane (by barometric pressure) on record in the North Atlantic basin was Hurricane Wilma (2005) (882 mbar).[11]
- The largest hurricane (in gale diameter winds) on record to form in the North Atlantic was Hurricane Sandy (2012) with a gale diameter of 870 miles (1,400 km)[54]
- The longest-lasting hurricane was the 1899 San Ciriaco hurricane, which lasted for 27 days and 18 hours as a tropical cyclone.[55]
- The longest-tracked hurricane was Hurricane Faith, which traveled for 6,850 miles (11,020 km) as a tropical cyclone.[56] Faith is also the northernmost moving tropical cyclone in the Atlantic basin.
- The most tornadoes spawned by a hurricane was 127 by Hurricane Ivan (2004 season).[11]
- The strongest landfalling hurricane was the Labor Day Hurricane of 1935 (892 hPa).[11]
- The deadliest hurricane was the Great Hurricane of 1780 (22,000 fatalities).[57]
- The deadliest hurricane to make landfall on the continental United States was the Galveston Hurricane in 1900 which may have killed up to 12,000 people.[58]
- The most damaging hurricane was both Hurricane Katrina and Hurricane Harvey of the 2005 and 2017 seasons, respectively, both of which caused $125 billion in damages in their respective years.[59] However, when adjusted for inflation, Katrina is the costliest with $161 billion.
- The quickest forming hurricane was Hurricane Humberto in 2007. It was a minimal hurricane that formed and intensified faster than any other tropical cyclone on record before landfall. Developing on September 12, 2007, in the northwestern Gulf of Mexico, the cyclone rapidly strengthened and struck High Island, Texas, with winds of about 90 mph (145 km/h) early on September 13.
Trends[]

This section needs to be updated. (September 2020) |
Paleoclimatology and historical trends[]
Proxy records based on paleotempestological research have revealed that major hurricane activity along the Gulf of Mexico coast varies on timescales of centuries to millennia.[28][29][60] Few major hurricanes struck the Gulf coast during 3000–1400 BC and again during the most recent millennium. These quiescent intervals were separated by a hyperactive period during 1400 BC and 1000 AD, when the Gulf coast was struck frequently by catastrophic hurricanes and their landfall probabilities increased by 3–5 times. This millennial-scale variability has been attributed to long-term shifts in the position of the Azores High,[29] which may also be linked to changes in the strength of the North Atlantic Oscillation.[61]
According to the Azores High hypothesis, an anti-phase pattern is expected to exist between the Gulf of Mexico coast and the Atlantic coast. During the quiescent periods, a more northeasterly position of the Azores High would result in more hurricanes being steered towards the Atlantic coast. During the hyperactive period, more hurricanes were steered towards the Gulf coast as the Azores High was shifted to a more southwesterly position near the Caribbean. Such a displacement of the Azores High is consistent with paleoclimatic evidence that shows an abrupt onset of a drier climate in Haiti around 3200 14C years BP,[30] and a change towards more humid conditions in the Great Plains during the late-Holocene as more moisture was pumped up the Mississippi Valley through the Gulf coast. Preliminary data from the northern Atlantic coast seem to support the Azores High hypothesis. A 3,000-year proxy record from a coastal lake in Cape Cod suggests that hurricane activity increased significantly during the past 500–1000 years, just as the Gulf Coast was amid a quiescent period during the last millennium. Evidence also shows that the average latitude of hurricane impacts has been steadily shifting northward, towards the Eastern Seaboard over the past few centuries. This change has been sped up in modern times due to the Arctic Ocean heating up especially much from fossil fuel-caused global warming.[62]
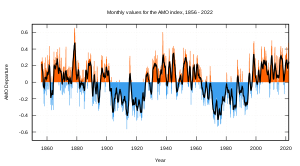
The number and strength of Atlantic hurricanes may undergo a 50–70 year cycle, also known as the Atlantic Multidecadal Oscillation.[63] Nyberg et al. reconstructed Atlantic major hurricane activity back to the early eighteenth century and found five periods averaging 3–5 major hurricanes per year and lasting 40–60 years, and six other averaging 1.5–2.5 major hurricanes per year and lasting 10–20 years. These periods are associated with the Atlantic multidecadal oscillation. Throughout, a decadal oscillation related to solar irradiance was responsible for enhancing/dampening the number of major hurricanes by 1–2 per year.[64]
Climate change[]
Between 1979 and 2019, the intensity of tropical cyclones increased: globally, tropical cyclones are 8% more likely to reach major intensity, defined as Saffir–Simpson categories 3 to 5. This trend is particularly strong North Atlantic, where the probability of cyclones reaching category three or higher increased by 49% per decade. This is consistent with the theoretical understanding of the link between climate change and tropical cyclones and model studies.[65]
While the number of storms in the Atlantic has increased since 1995, there is no obvious global trend. The annual number of tropical cyclones worldwide remains about 87 ± 10. However, the ability of climatologists to make long-term data analysis in certain basins is limited by the lack of reliable historical data in some basins, primarily in the Southern Hemisphere.[66]
It has been observed that a poleward migration exists for the paths of maximum intensity of tropical cyclone activity in the Atlantic.[67] The focus of that research was on the latitude at which recent tropical cyclones in the Atlantic are reaching maximum intensity. The data indicates that during the past thirty years, the peak intensity of these storms has shifted poleward in both hemispheres at a rate of approximately 60 km per decade, amounting to approximately one degree of latitude per decade.
Impact[]
Atlantic storms are becoming more financially destructive, since five of the ten most expensive storms in United States history have occurred since 1990. According to the World Meteorological Organization, "recent increase in societal impact from tropical cyclones has largely been caused by rising concentrations of population and infrastructure in coastal regions."[68] Pielke et al. (2008) normalized mainland U.S. hurricane damage from 1900–2005 to 2005 values and found no remaining trend of increasing absolute damage. The 1970s and 1980s were notable because of the extremely low amounts of damage compared to other decades. The decade 1996–2005 has the second most damage among the past 11 decades, with only the decade 1926–1935 surpassing its costs. The most damaging single storm is the 1926 Miami hurricane, with $157 billion of normalized damage.[69]
Often in part because of the threat of hurricanes, many coastal regions had sparse population between major ports until the advent of automobile tourism; therefore, the most severe portions of hurricanes striking the coast may have gone unmeasured in some instances. The combined effects of ship destruction and remote landfall severely limit the number of intense hurricanes in the official record before the era of hurricane reconnaissance aircraft and satellite meteorology. Although the record shows a distinct increase in the number and strength of intense hurricanes, therefore, experts regard the early data as suspect.[70] Christopher Landsea et al. estimated an undercount bias of zero to six tropical cyclones per year between 1851 and 1885 and zero to four per year between 1886 and 1910. These undercounts roughly take into account the typical size of tropical cyclones, the density of shipping tracks over the Atlantic basin, and the amount of populated coastline.[71]
Although more uncommon since 1995, few above-normal hurricane seasons occurred during 1970–94.[72] Destructive hurricanes struck frequently from 1926 to 1960, including many major New England hurricanes. Twenty-one Atlantic tropical storms formed in 1933, a record only recently exceeded in 2005 and 2020, which saw 28 and 30 storms, respectively. Tropical hurricanes occurred infrequently during the seasons of 1900–25; however, many intense storms formed during 1870–99. During the 1887 season, 19 tropical storms formed, of which a record 4 occurred after November 1 and 11 strengthened into hurricanes. Few hurricanes occurred in the 1840s to 1860s; however, many struck in the early 19th century, including an 1821 storm that made a direct hit on New York City. Some historical weather experts say these storms may have been as high as Category 4 in strength.[73]
These active hurricane seasons predated satellite coverage of the Atlantic basin. Before the satellite era began in 1960, tropical storms or hurricanes went undetected unless a reconnaissance aircraft encountered one, a ship reported a voyage through the storm, or a storm landed in a populated area.[70] The official record, therefore, could miss storms in which no ship experienced gale-force winds, recognized it as a tropical storm (as opposed to a high-latitude extra-tropical cyclone, a tropical wave, or a brief squall), returned to port, and reported the experience.
See also[]
- 2021 Atlantic hurricane season
- Atlantic hurricane seasons
- Hebert Box
- Lists of Atlantic hurricanes
- List of historical tropical cyclone names
- List of United States hurricanes
- Mediterranean tropical cyclone
- Pacific hurricane
- South Atlantic tropical cyclone
- Western Hemisphere Warm Pool
Notes[]
- ^ A major hurricane is a storm that ranks as Category 3 or higher on the Saffir–Simpson hurricane wind scale.[33]
References[]
- ^ a b "What is the difference between a hurricane, a cyclone, and a typhoon?". OCEAN FACTS. National Ocean Service. Retrieved 2016-12-24.
- ^ National Hurricane Center. Glossary of NHC/TPC Terms. Retrieved on 2006-10-28.
- ^ Chris Landsea. Subject: E16- When did the earliest and latest hurricanes occur? Retrieved on 2008-06-10.
- ^ World Meteorological Organization (April 25, 2006). "RSMCs". Tropical Cyclone Programme (TCP). Retrieved 2006-11-05.
- ^ NOAA The Retirement of Hurricane Names Archived 2008-05-11 at the Wayback Machine Retrieved on 2008-06-10.
- ^ a b c d e f g "Tropical Cyclone Climatology". National Hurricane Center. Retrieved 4 November 2017.
- ^ "Normas Da Autoridade Marítima Para As Atividades De Meteorologia Marítima" (PDF) (in Portuguese). Brazilian Navy. 2011. Archived from the original (PDF) on 6 February 2015. Retrieved 6 February 2015.
- ^ Atlantic Oceanographic and Meteorological Laboratory, Hurricane Research Division. "Frequently Asked Questions: What determines the movement of tropical cyclones?". NOAA. Retrieved 2006-07-25.
- ^ U. S. Navy. Section 2: Tropical Cyclone Motion Terminology. Retrieved on 2007-04-10.
- ^ Hurricane Research Division. Frequently Asked Questions: Subject G6 - What determines the movement of tropical cyclones? Retrieved on 2006-10-28.
- ^ a b c d e f g h i j k l m n o p q r s t u v w "Atlantic hurricane best track (HURDAT version 2)" (Database). United States National Hurricane Center. May 25, 2020.
- ^ a b Landsea, Chris (April 21, 2010). "E1) Which is the most intense tropical cyclone on record?". Frequently Asked Questions (FAQ). 4.6. United States National Oceanic and Atmospheric Administration's Atlantic Oceanographic and Meteorological Laboratory. Retrieved 22 September 2013.
- ^ Mayfield, Max (November 29, 1995). Hurricane Opal Preliminary Report (Preliminary Report). National Hurricane Center. Archived from the original on May 3, 2015. Retrieved 22 September 2013.
- ^ Louisiana Geographic Information Center. "The Saffir–Simpson Hurricane Scale". Baton Rouge, Louisiana: Louisiana State University. Archived from the original on 1 June 2013. Retrieved 23 September 2013.
- ^ National Hurricane Center; Hurricane Research Division; Central Pacific Hurricane Center. "The Northeast and North Central Pacific hurricane database 1949–2019". United States National Oceanic and Atmospheric Administration's National Weather Service. Retrieved 1 October 2020. A guide on how to read the database is available here.
- ^ "Tropical Cyclone Best Track Information for the North Indian Ocean 1990–2008". India Meteorological Department. 2009. Archived from the original (XLS) on November 16, 2009. Retrieved 22 September 2013.
- ^ Royer, Stephane (7 February 2003). "Very Intense Tropical Cyclone Gafilo". Météo France. Archived from the original on 27 September 2013. Retrieved 22 September 2013.
- ^ "Tropical Cyclone Information for the Australian Region". Bureau of Meteorology. 2008. Archived from the original on 21 July 2012. Retrieved 22 February 2013.
- ^ MetService (May 22, 2009). "TCWC Wellington Best Track Data 1967–2006". International Best Track Archive for Climate Stewardship.[permanent dead link]
- ^ "Western North Pacific Typhoon best track file 1951–2021". Japan Meteorological Agency. Retrieved 22 September 2013.
- ^ Willoughby, H.E.; Masters, J. M.; Landsea, C. W. (December 1, 1989). "A Record Minimum Sea Level Pressure Observed in Hurricane Gilbert". Monthly Weather Review. Miami, Florida: American Meteorological Society. 117 (12): 2824–2828. Bibcode:1989MWRv..117.2824W. doi:10.1175/1520-0493(1989)117<2824:ARMSLP>2.0.CO;2.
- ^ a b c Franklin, James L. (January 31, 2008). "Hurricane Dean" (PDF). National Hurricane Center Tropical Cyclone Reports. Miami, Florida: National Hurricane Center. Retrieved 23 September 2013.
- ^ National Weather Service (November 14, 2005). "Post Storm Data Acquisition – Hurricane Rita Peak Gust Analysis and Storm Surge Data" (PDF). United States National Oceanic and Atmospheric Administration. Archived from the original (PDF) on November 2, 2012. Retrieved 23 September 2013.
- ^ "TC FAQ: E17: How many hurricanes have there been in each month?". Atlantic Oceanographic and Meteorological Laboratory. National Oceanic and Atmospheric Administration. 2010-04-22. Retrieved 2010-06-15.
- ^ a b Atlantic Oceanographic and Meteorological Laboratory, Hurricane Research Division. "Frequently Asked Questions: How do tropical cyclones form?". NOAA. Archived from the original on August 27, 2009. Retrieved 2006-07-26.
- ^ Christopher A. Davis & Lance F. Bosart (November 2003). "Baroclinically Induced Tropical Cyclogenesis". Monthly Weather Review. American Meteorological Society. 131 (11): 2730. Bibcode:2003MWRv..131.2730D. doi:10.1175/1520-0493(2003)131<2730:BITC>2.0.CO;2. ISSN 1520-0493.
- ^ Marc C. Cove, James J. O'Brien, et al. Effect of El Niño on U.S. Landfalling Hurricanes, Revisited. Retrieved on 2006-10-28.
- ^ a b Liu, Kam-biu (1999). Millennial-scale variability in catastrophic hurricane landfalls along the Gulf of Mexico coast. 23d Conf. on Hurricanes and Tropical Meteorology. Dallas, Texas: Amer. Meteor. Soc. pp. 374–377.
- ^ a b c Liu, Kam-biu; Fearn, Miriam L. (2000). "Reconstruction of Prehistoric Landfall Frequencies of Catastrophic Hurricanes in Northwestern Florida from Lake Sediment Records". Quaternary Research. 54 (2): 238–245. Bibcode:2000QuRes..54..238L. doi:10.1006/qres.2000.2166. S2CID 140723229.
- ^ a b Higuera-Gundy, Antonia; et al. (1999). "A 10,300 14C yr Record of Climate and Vegetation Change from Haiti". Quaternary Research. 52 (2): 159–170. Bibcode:1999QuRes..52..159H. doi:10.1006/qres.1999.2062.
- ^ a b c Dorst, Neal (January 21, 2010). "G1) When is hurricane season?". Frequently Asked Questions (FAQ). 4.6. United States National Oceanic and Atmospheric Administration's Atlantic Oceanographic and Meteorological Laboratory. Retrieved 14 August 2013.
- ^ a b Landsea, Chris; et al. (June 2013). "Documentation of Atlantic Tropical Cyclones Changes in HURDAT" (TXT). United States National Oceanic and Atmospheric Administration's Hurricane Research Division. Archived from the original on 2 August 2013. Retrieved 14 August 2013.
- ^ Goldenburg, Stan (June 1, 2012). "A3) What is a super-typhoon? What is a major hurricane? What is an intense hurricane?". Frequently Asked Questions (FAQ). 4.5. United States National Oceanic and Atmospheric Administration's Atlantic Oceanographic and Meteorological Laboratory. Retrieved 3 September 2013.
- ^ Hurricanes: Science and Society. "1957 – Hurricane Audrey". Storms in the 1950s. University of Rhode Island. Retrieved 3 September 2013.
- ^ "Reanalysis of 1956 to 1960 Atlantic hurricane seasons completed: 10 new tropical storms discovered" (PDF). National Hurricane Center. July 20, 2016.
- ^ Franklin, James L.; Brown, Daniel P. (March 10, 2006). Hurricane Emily (PDF). National Hurricane Center Tropical Cyclone Report (Report). Miami, Florida: United States National Oceanic and Atmospheric Administration's National Hurricane Center. Retrieved 3 September 2013.
- ^ "Atlantic Hurricane and Tropical Storm Records". Hurricane.com. Archived from the original on January 3, 2013. Retrieved March 5, 2016.
- ^ Chambers, Gillan (December 1999). "Late Hurricanes: a Message for the Regio". Environment and development in coastal regions and in small islands. Coast and Beach Stability in the Lesser Antilles. Archived from the original on 15 September 2012. Retrieved 22 September 2013.
- ^ Paolino, JJ; Myrie, Donovan (2011). "Category Five Notables". Stormfacts.net. Retrieved 22 September 2013.
- ^ a b c William M. Gray and Philip J. Klotzbach. SUMMARY OF 2005 ATLANTIC TROPICAL CYCLONE ACTIVITY AND VERIFICATION OF AUTHOR’S SEASONAL AND MONTHLY FORECASTS. Retrieved on 2006-10-28.
- ^ a b c USDC and NOAA (2009) Historical Climatology Series 6-2 Tropical Cyclones of the North Atlantic Ocean 1851–2006 pp. 212
- ^ a b c d USDC and NOAA (2009) Historical Climatology Series 6-2 Tropical Cyclones of the North Atlantic Ocean 1851–2006 pp. 27
- ^ USDC and NOAA (2009) Historical Climatology Series 6-2 Tropical Cyclones of the North Atlantic Ocean 1851–2006 pp. 213
- ^ USDC and NOAA (2009) Historical Climatology Series 6-2 Tropical Cyclones of the North Atlantic Ocean 1851–2006 pp. 200
- ^ USDC and NOAA (2009) Historical Climatology Series 6-2 Tropical Cyclones of the North Atlantic Ocean 1851–2006 pp. 203
- ^ a b Anantha R. Aiyyer. Climatology of Vertical Wind Shear Over the Tropical Atlantic. Archived 2008-05-28 at the Wayback Machine Retrieved on 2006-10-28.
- ^ Landsea, Chris. "Frequently Asked Questions: G4) Why do tropical cyclones occur primarily in the summer and autumn?". Archived from the original on 2018-03-28. Retrieved 2018-10-05.
- ^ NOAA. Graph showing average activity during the hurricane Season. Retrieved on 2006-10-28.
- ^ "Hurricane Iota makes landfall in Nicaragua as Category 4 storm".
- ^ a b USDC and NOAA (2009) Historical Climatology Series 6-2 Tropical Cyclones of the North Atlantic Ocean 1851–2006 pp. 82
- ^ USDC and NOAA (2009) Historical Climatology Series 6-2 Tropical Cyclones of the North Atlantic Ocean 1851–2006 pp. 148
- ^ USDC and NOAA (2009) Historical Climatology Series 6-2 Tropical Cyclones of the North Atlantic Ocean 1851–2006 pp. 202
- ^ USDC and NOAA (2009) Historical Climatology Series 6-2 Tropical Cyclones of the North Atlantic Ocean 1851–2006 pp. 146
- ^ "Tropical Cyclone Report Hurricane Sandy" (PDF). Hurricane Sandy – National Hurricane Center. National Hurricane Center]]. Retrieved 4 November 2020..
- ^ "Tropics: Nadine finally done, while Oscar strengthens". Central Florida News 13. Archived from the original on October 6, 2012. Retrieved 4 October 2012.
- ^ Dorst, Neal (2004). "What is the farthest a tropical cyclone has traveled?". NOAA Tropical cyclone FAQ. NOAA. Retrieved 5 January 2013.
- ^ Edward N. Rappaport and Jose Fernandez-Partagas. The Deadliest Atlantic Tropical Cyclones, 1492–1996. Retrieved on 2008-06-10.
- ^ "Table 2. The thirty deadliest mainland United States tropical cyclones 1900–2000". Atlantic Oceanographic and Meteorological Laboratory. Retrieved 4 November 2020.
- ^ Eric S. Blake, Edward N. Rappaport, and Chris Landsea. The Dealiest, Costliest, and Most Intense United States Tropical Cyclones From 1851 to 2006 (and other frequently requested hurricane facts). Retrieved on 2008-03-19.
- ^ McCloskey, T. A.; Knowles, J. T. (2009). "Migration of the tropical cyclone zone throughout the Holocene". In Elsner, J. B.; Jagger, T. H. (eds.). Hurricanes and Climate Change. New York: Springer. ISBN 978-0-387-09409-0.
- ^ Elsner, James B.; Liu, Kam-biu; Kocher, Bethany (2000). "Spatial Variations in Major U.S. Hurricane Activity: Statistics and a Physical Mechanism". Journal of Climate. 13 (13): 2293–2305. Bibcode:2000JCli...13.2293E. doi:10.1175/1520-0442(2000)013<2293:SVIMUS>2.0.CO;2. S2CID 131457444.
- ^ "Killer Hurricanes". www.pbs.org/wgbh/nova/. 1 November 2017. Retrieved 20 January 2018.
- ^ Chylek, Petr; Lesins, Glen (2008). "Multidecadal variability of Atlantic hurricane activity: 1851–2007". Journal of Geophysical Research: Atmospheres. 113 (D22): D22106. Bibcode:2008JGRD..11322106C. doi:10.1029/2008JD010036.
- ^ Nyberg, J.; Winter, A.; Malmgren, B. A. (2005). "Reconstruction of Major Hurricane Activity". Eos Trans. AGU. 86 (52, Fall Meet. Suppl): Abstract PP21C–1597. Bibcode:2005AGUFMPP21C1597N.
- ^ Kossin, James P.; Knapp, Kenneth R.; Olander, Timothy L.; Velden, Christopher S. (2020-05-18). "Global increase in major tropical cyclone exceedance probability over the past four decades". Proceedings of the National Academy of Sciences. 117 (22): 11975–11980. doi:10.1073/pnas.1920849117. ISSN 0027-8424. PMC 7275711. PMID 32424081.
- ^ Landsea, Chris; et al. (July 28, 2006). "Can We Detect Trends in Extreme Tropical Cyclones?" (PDF). Science. 313 (5786): 452–454. doi:10.1126/science.1128448. PMID 16873634. S2CID 29364864. Retrieved 2007-06-09.
- ^ Kossin, James P., Emanuel, Kerry A, and Vecchi, Gabriel A., The poleward migration of the location of tropical cyclone maximum intensity, Nature 509, 349–352 (15 May 2014) doi:10.1038/nature13278, received 21 October 2013 accepted 21 March 2014 published online 14 May 2014
- ^ "Summary Statement on Tropical Cyclones and Climate Change" (PDF) (Press release). World Meteorological Organization. 2006-12-04. Archived from the original (PDF) on 2009-03-25.
- ^ Pielke, Roger A. Jr.; et al. (2008). "Normalized Hurricane Damage in the United States: 1900–2005" (PDF). Natural Hazards Review. 9 (1): 29–42. doi:10.1061/(ASCE)1527-6988(2008)9:1(29). Archived from the original (PDF) on 2013-06-17.
- ^ a b Neumann, Charles J. "1.3: A Global Climatology". Global Guide to Tropical Cyclone Forecasting. Bureau of Meteorology. Archived from the original on June 28, 2001. Retrieved 2006-11-30.
- ^ Landsea, C. W.; et al. (2004). "The Atlantic hurricane database re-analysis project: Documentation for the 1851–1910 alterations and additions to the HURDAT database". In Murname, R. J.; Liu, K.-B. (eds.). Hurricanes and Typhoons: Past, Present and Future. New York: Columbia University Press. pp. 177–221. ISBN 0-231-12388-4.
- ^ (March 2006). "U.S. and Caribbean Hurricane Activity Rates" (PDF). Archived from the original (PDF) on 2007-06-14. Retrieved 2006-11-30.
- ^ Center for Climate Systems Research. "Hurricanes, Sea Level Rise, and New York City". Columbia University. Archived from the original on 2007-01-02. Retrieved 2006-11-29.
External links[]
| Concepts |
| ||||||||||||||||||||||||||||||
|---|---|---|---|---|---|---|---|---|---|---|---|---|---|---|---|---|---|---|---|---|---|---|---|---|---|---|---|---|---|---|---|
| Anticyclone |
| ||||||||||||||||||||||||||||||
| Cyclone |
| ||||||||||||||||||||||||||||||

| Authority control |
|---|
- Atlantic hurricanes
- Tropical cyclone meteorology