1995 Atlantic hurricane season
| 1995 Atlantic hurricane season | |
|---|---|
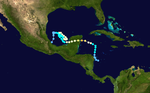
 Season summary map | |
| Seasonal boundaries | |
| First system formed | June 2, 1995 |
| Last system dissipated | November 1, 1995 |
| Strongest storm | |
| Name | Opal |
| • Maximum winds | 150 mph (240 km/h) (1-minute sustained) |
| • Lowest pressure | 916 mbar (hPa; 27.05 inHg) |
| Seasonal statistics | |
| Total depressions | 21 |
| Total storms | 19 |
| Hurricanes | 11 |
| Major hurricanes (Cat. 3+) | 5 |
| Total fatalities | 182 total |
| Total damage | $12.32 billion (1995 USD) |
| Related articles | |
| |
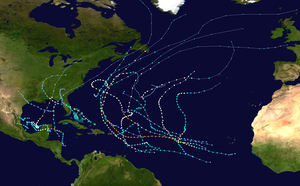
The 1995 Atlantic hurricane season was an above average Atlantic hurricane season in terms of activity, and is considered to be the start of an ongoing era of high-activity tropical cyclone formation. The season produced twenty-one tropical cyclones, nineteen named storms, as eleven hurricanes and five major hurricanes.[nb 1] The season officially began on June 1 and ended on November 30, dates which conventionally delimit the period of each year when most tropical cyclones develop in the Atlantic basin. The first tropical cyclone, Hurricane Allison, developed on June 2, while the season's final storm, Hurricane Tanya, transitioned into an extratropical cyclone on November 1. The very active Atlantic hurricane activity in 1995 was caused by La Niña conditions, which also influenced a very inactive Pacific hurricane season.
There were four particularly destructive hurricanes during the season, including Luis, Marilyn, Opal and Roxanne. Hurricanes Luis and Marilyn both caused catastrophic damage in the Leeward Islands and Virgin Islands. The former storm was the first hurricane to affect those regions since Hugo in 1989, while the latter was the most devastating cyclone on those islands since Hugo as well. Opal, the strongest and most intense storm of the season, caused devastation along portions of the Gulf Coast of the United States. Roxanne, a rare late-season major hurricane,[nb 2] caused significant damage when it made landfall in Quintana Roo. Additionally, Erin produced moderate damage in Florida and into Alabama. Felix generated strong waves, causing heavy beach erosion in the Northeastern United States and drowning nine people. Iris caused flooding that left five deaths in the Lesser Antilles. Collectively, the tropical cyclones of the season caused about $12.32 billion (1995 USD)[nb 3] in damage and at least 182 deaths.
Seasonal forecasts[]
Pre-season forecasts[]
| Source | Date | Named storms |
Hurricanes | Major hurricanes |
Ref |
| CSU | December 1994 | 12 | 8 | 3 | [3] |
| WRC | Early 1995 | 10 | 6 | N/A | [4] |
| CSU | April | 10 | 6 | 2 | [3] |
| CSU | June | 12 | 8 | 3 | [3] |
| Record high activity | 30 | 15 | 7 | [5] | |
| Record low activity | 1 | 0 (tie) | 0 | [5] | |
| Actual activity | 19 | 11 | 5 | ||
Forecasts of hurricane activity are issued before each hurricane season by noted hurricane experts such as Dr. William M. Gray and his associates at Colorado State University (CSU) and the Weather Research Center (WRC). A normal season, as defined by the National Oceanic and Atmospheric Administration (NOAA), has 12.1 named storms; of these, 6.4 reach hurricane strength; and 2.7 major hurricanes, which are Category 3 or higher on the Saffir–Simpson hurricane wind scale.[6] Additionally, the 1950–2000 CSU average for a normal season is 9.6 named storms, of these 5.9 reach hurricane strength, and 2.3 become major hurricanes.[7]
In December 1994, CSU predicted that only 12 named storms would form and 8 of those would become hurricanes; 3 major hurricanes were projected. CSU noted an above average season due to expectations that the existing El Niño would dissipate, while a La Niña would develop by the summer of 1995. Additionally, the western areas of the Sahara Desert were predicted to have the fourth or fifth rainiest season since 1970. A year with heavier precipitation in this region usually correlates with an active Atlantic hurricane season.[8] In April 1995, CSU revised their forecast, decreasing the number of named storms to 10, hurricanes to 6, and major hurricanes to 2. However, in June, CSU reverted to their December forecast, which called for 12 named storms, 8 hurricanes, and 3 major hurricanes.[3] The forecast by the WRC in early 1995 was 10 named storms and 6 hurricanes, with no prediction on the number of major hurricanes.[4]
Seasonal summary[]


| Rank | Season | ACE |
|---|---|---|
| 1 | 1933 | 259 |
| 2 | 2005 | 250 |
| 3 | 1893 | 231 |
| 4 | 1926 | 230 |
| 5 | 1995 | 228 |
| 6 | 2004 | 227 |
| 7 | 2017 | 225 |
| 8 | 1950 | 211 |
| 9 | 1961 | 189 |
| 10 | 1998 | 182 |
The Atlantic hurricane season officially began on June 1,[11] and activity in 1995 began on the next day with the formation of Hurricane Allison on June 2. It was a well-above average season in which 21 tropical depressions formed, 19 of which attained tropical storm status, and 11 of these attained hurricane status. In addition, five tropical cyclones reached major hurricane status,[5] which was well above the 1950–2005 average of two per season.[7] At the time, only 1933 surpassed the season's total storms, making the season the second most active in recorded history tying with 1887. Following record activity in 2005 and 2020, it has been pushed down to the fourth most active season alongside 2010, 2011, 2012, and 2021.[12][13][14][5] The 1995 season would be the beginning of an active period in the Atlantic basin, which has lasted for over 20 years. Collectively, the tropical cyclones of this season caused 182 deaths and $12.02 billion in damage.[15] The last storm of the season, Hurricane Tanya, became extratropical on November 1,[5] over four weeks before the official end of the season on November 30.[11]
Tropical cyclogenesis in the 1995 Atlantic hurricane season began with the development of Hurricane Allison on June 2. The month of July was very active, with four tropical cyclones forming. This record of storms in July stood until the 2005 Atlantic hurricane season when five storms formed in July. A total of seven storms formed in August — Felix, Gabrielle, Humberto, Iris, Jerry, Karen, and Luis — tying the 1933 record for most in the month; this record was broken in the 2004 Atlantic hurricane season when eight named storms formed during August. Although September is the climatological peak of hurricane season, it was much less active than August. Four tropical cyclones developed in September, with Marilyn, Noel, and Opal eventually strengthening into hurricanes. Four tropical cyclones also formed in October; notably, Hurricane Roxanne developed in that month. The last storm of the season, Hurricane Tanya, developed later in October and eventually became extratropical on November 1.[5]
The season's activity was reflected with a very high accumulated cyclone energy (ACE) rating of 228, the fifth highest value on record,[12] and far above the 1981–2010 median of 92.[16] Broadly speaking, ACE is a measure of the power of a tropical or subtropical storm multiplied by the length of time it existed. Therefore, a storm with a longer duration or stronger intensity, such as Felix, Luis, Opal, or Roxanne will have high values of ACE. It is only calculated for full advisories on specific tropical and subtropical systems reaching or exceeding wind speeds of 39 mph (63 km/h). Accordingly, tropical depressions are not included here. After the storm has dissipated, typically after the end of the season, the NHC reexamines the data, and produces a final report on each storm. These revisions can lead to a revised ACE total either upward or downward compared to the operational value.[12]
Systems[]
Hurricane Allison[]
| Category 1 hurricane (SSHWS) | |
  | |
| Duration | June 3 – June 6 |
|---|---|
| Peak intensity | 75 mph (120 km/h) (1-min) 987 mbar (hPa) |
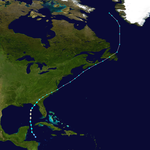
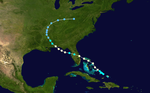
A westward moving tropical wave reached the Caribbean Sea in late May and gradually organized over the next few days. Around 00:00 UTC on June 3, a tropical depression developed about 265 miles (425 km) east of Belize City, Belize. The depression initially moved northwestward before recurving to the north. The depression entered the Gulf of Mexico and strengthened into Tropical Storm Allison by 12:00 UTC. Despite unfavorable upper-level winds, the storm intensified into a hurricane about 24 hours later. Allison then peaked with maximum sustained winds of 75 mph (120 km/h) and a minimum barometric pressure of 987 mbar (29.1 inHg). Increasing wind shear weakened it to a tropical storm early on June 5. At 14:00 UTC, Allison made landfall near Alligator Point, Florida, with winds of 70 mph (110 km/h). After briefly emerging over Apalachee Bay, Allison struck near St. Marks with winds of 65 mph (100 km/h). Early on June 6, Allison weakened to a tropical depression, shortly before becoming extratropical. The remnants continued northeastward and later struck Newfoundland before dissipating near Greenland on June 11.[17]
While brushing Cuba, Allison produced wind gusts up to 64 mph (102 km/h) and as much as 18 in (460 mm) of rainfall. A total of 32 structures were damaged or destroyed, causing one death.[17] In Florida, storm surge heights of 6 to 8 feet (1.8 to 2.4 m) were observed in Dixie and Wakulla counties and 2 to 6 ft (0.61 to 1.83 m) to the east, causing significant beach erosion and damaging 65 homes, 3 hotels, and a restaurant.[18] Elsewhere in Florida, damage was generally minor, totaling only about $860,000. In Georgia, there was minor flooding and tornadoes, one of which caused $800,000 in damage in St. Marys.[17] Some locations in Atlantic Canada reported tropical storm force winds and heavy rainfall.[19]
Tropical Storm Barry[]
| Tropical storm (SSHWS) | |
  | |
| Duration | July 5 – July 10 |
|---|---|
| Peak intensity | 70 mph (110 km/h) (1-min) 989 mbar (hPa) |
A frontal low situated between Bermuda and South Carolina developed into Tropical Depression Two late on July 6.[20] Strong wind shear initially prevented significant strengthening,[21] though by early on July 7, the depression became Tropical Storm Barry. A nearby trough enhanced convection and caused strengthening, with maximum sustained winds reaching 70 mph (110 km/h) later that day.[20] Later on July 8, Barry weakened slightly, falling to winds of 50 mph (85 km/h), an intensity it would retain until landfall.[20] An approaching mid-level trough accelerated the storm as it traveled roughly along the Gulf Stream.[22] Early on July 9, convection began to shift away from the storm's center. While moving rapidly northeastward, Barry made landfall in Hart Island, Nova Scotia, late on July 9.[20]
It weakened slightly and made landfall on Cape Breton Island less than an hour later.[20] Cold water caused deep convection to diminish as it was making landfall, and the storm lost most remaining tropical characteristics as it tracked toward Newfoundland.[23] Barry was declared extratropical early on July 10 near the west coast of Newfoundland. As a fast-moving and weakening extratropical cyclone, the system remained distinct until it passed across the east coast of Labrador, when it dissipated.[20] Tropical storm force winds were recorded at Fourchu, Nova Scotia, as well as wind gusts up to 62 mph (100 km/h) at Port aux Basques, Newfoundland. Barry dropped significant rainfall, peaking at 4.33 in (110 mm) in Nova Scotia, with lesser totals at several other locations.[24]
Tropical Storm Chantal[]
| Tropical storm (SSHWS) | |
  | |
| Duration | July 12 – July 20 |
|---|---|
| Peak intensity | 70 mph (110 km/h) (1-min) 991 mbar (hPa) |
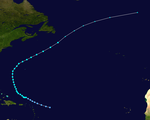
A tropical wave emerged into the Atlantic Ocean from the west coast of Africa on July 5. During the next week, the wave improved on satellite imagery and developed into a tropical depression about 420 mi (680 km) east-northeast of Guadeloupe on July 12. The depression quickly strengthened into Tropical Storm Chantal. Initially, Chantal threatened the Bahamas, and the Government of the Bahamas issued tropical storm watches and warnings, which were in effect for the southeast and central islands as well as the Turks and Caicos Islands. However, Chantal re-curved to the north and did not directly affect the Bahamas. After the cyclone turned northward, it threatened Bermuda, which prompted a tropical storm watch for the island on July 16. The watch was canceled on July 18 as the storm passed well northwest of the island.[25]
By early on July 17, Chantal attained its peak intensity with maximum sustained winds of 70 mph (110 km/h) and a minimum barometric pressure of 991 mbar (29.3 inHg). Thereafter, the storm began weakening and slowly losing tropical characteristics. At 18:00 UTC on July 20, Chantal transitioned into an extratropical storm about 225 mi (360 km) east-southeast of Cape Race, Newfoundland. The remnants continued rapidly northeastward and later east-northeastward, before dissipating west of the British Isles on July 22.[25] Although Chantal remained well offshore, the storm dropped heavy rainfall in Nova Scotia and Newfoundland, peaking at 3 in (76 mm) on the Burin Peninsula. Further west in Nova Scotia, heavier precipitation was reported, peaking at 4.84 in (123 mm) near Barrington.[26]
Tropical Storm Dean[]
| Tropical storm (SSHWS) | |
  | |
| Duration | July 28 – August 2 |
|---|---|
| Peak intensity | 45 mph (75 km/h) (1-min) 999 mbar (hPa) |
A stationary front in the Gulf of Mexico developed an upper-level circulation. By July 28, the system organized enough to be classified as Tropical Depression Four. Despite favorable conditions, the depression tracked westward without significantly intensifying, due to the poor organization of the storm itself. As the depression curved west-northwestward, it began to strengthen and was upgraded to Tropical Storm Dean while located only 70 mi (110 km) from the Texas coastline on July 30. The system made landfall early on July 31 near Freeport with winds of 45 mph (75 km/h) and a minimum barometric pressure of 999 mbar (hPa; 29.5 inHg). Shortly thereafter, Dean weakened back to a tropical depression. The storm continued to slowly weaken as it moved northwestward, dissipating on August 2 near the Texas–Oklahoma border.[27]
Storm surge caused minor coastal flooding, especially on Galveston Island.[28] Dean produced a large swath of rainfall between 5 and 10 in (130 and 250 mm), while some areas received more than 17 in (430 mm).[29] Precipitation from the storm caused moderate localized flood damage. A total of 20 families in Chambers County evacuated,[27] while 38 houses in the southeastern portions of Texas were flooded.[28] Two tornadoes were also reported in the state, but neither caused significant damage.[28] In Oklahoma, heavy rainfall flooded more than 40 houses and left about 24 cars stranded. At least three highways suffered significant flooding, while other minor roads were closed for several days.[30] Outside of Oklahoma and Texas, the remnants of the storm dropped rainfall in several Midwestern states, though minimal damage occurred.[29] Despite the flooding, property damage estimates were only $500,000,[28] while one fatality occurred.[30]
Hurricane Erin[]
| Category 2 hurricane (SSHWS) | |
  | |
| Duration | July 31 – August 6 |
|---|---|
| Peak intensity | 100 mph (155 km/h) (1-min) 973 mbar (hPa) |
A tropical wave exited the west coast of Africa on July 22 and headed toward the Leeward Islands, where the system nearly developed into a tropical cyclone but was inhibited by vertical wind shear. By July 31, the system was classified as Tropical Storm Erin while just west of the Turks and Caicos Islands. Despite effects from wind shear, Erin continued to strengthen as it moved northwestward and was upgraded to a hurricane later on July 31. Further intensification occurred, and Erin reached winds of 85 mph (140 km/h) before making landfall near Vero Beach, Florida, on August 1. The storm emerged over the Gulf of Mexico after weakening back to a tropical storm, though it quickly re-strengthened into a hurricane. Shortly before making landfall near Pensacola Beach, Florida on August 3, Erin briefly intensified into a Category 2 hurricane. After moving inland, Erin slowly weakened as it tracked across the Southern United States and Midwestern United States. By August 6, Erin merged with a frontal system over West Virginia.[31]
Erin was the first hurricane to strike the United States since Hurricane Andrew in 1992.[5] In Jamaica, the outer bands of Erin produced heavy rainfall on the island, which caused a plane crash, killing five people; two other fatalities occurred when two people were struck by lightning. Although many islands in the Bahamas experienced high winds and heavy rainfall, damage associated with Erin was fairly minor. Offshore of Florida, nine people drowned, three of which occurred after a cruise ship sunk. Over land, high winds produced by Erin damaged over 2,000 houses, most of which were in the Florida Panhandle. In addition, strong winds left over one million people without electricity. Several tornadoes were spawned in the state, causing damage. In Alabama, more than 100 houses were damaged by Erin.[31] Between 50 and 75 percent of the pecan crop in Baldwin County was lost. Similar impact also occurred in Mississippi, although to a lesser degree.[32] Elsewhere, some areas of the Mid-Atlantic and Northeastern United States experienced heavy rainfall.[33] Overall, Erin caused 13 fatalities and $700 million in damage.[31]
Tropical Depression Six[]
| Tropical depression (SSHWS) | |
  | |
| Duration | August 5 – August 7 |
|---|---|
| Peak intensity | 35 mph (55 km/h) (1-min) 1002 mbar (hPa) |
The southern part of the tropical wave that spawned Hurricane Erin continued into the Caribbean Sea in late July. By August 4, the system entered the Bay of Campeche and developed into Tropical Depression Six on August 5. The depression moved slowly over Mexico and gradually intensified that day and August 6. Satellite intensity estimated showed the depression was likely just below the threshold of tropical storm status. However, late on August 6, the depression made landfall in Cabo Rojo, Veracruz. The depression slowly weakened inland and dissipated late on August 7.[34] The depression and the precursor tropical wave dropped heavy rainfall in some areas of Mexico. Precipitation from the precursor system peaked at 14.45 in (367 mm) in Escuintla, Chiapas, while rainfall from the depression itself peaked at 12 in (300 mm) in Tlaxco, Puebla.[35] Some localized flooding may have occurred near the path of the depression.[34]
Hurricane Felix[]
| Category 4 hurricane (SSHWS) | |
  | |
| Duration | August 8 – August 22 |
|---|---|
| Peak intensity | 140 mph (220 km/h) (1-min) 929 mbar (hPa) |
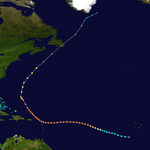
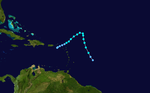
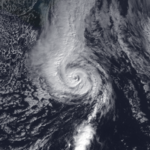
A tropical wave exited the west coast of Africa on August 6 developed into Tropical Depression Seven on August 8 while located about 460 mi (740 km) west-southwest of the Cape Verde Islands. The depression moved west-northwestward due to a subtropical ridge and deepened into Tropical Storm Felix later that day. Further intensification was slower, with Felix reaching hurricane status on August 11. Due to warm sea surface temperatures and light wind shear, Felix began to rapidly strengthen as it was curving northwestward. Late on August 12, Felix peaked with maximum sustained winds of 140 mph (220 km/h) and a minimum barometric pressure of 929 mbar (27.4 inHg). Felix weakened over the next few days back to a Category 1 hurricane on August 14, after an eyewall replacement cycle and an increase in wind shear.[36]
The storm posed a significant threat to Bermuda, warranting a hurricane warning between August 14 and August 15. During the latter date, Felix passed only 75 mi (120 km) to the southwest of the island. Continuing on its northwest trek, the cyclone also temporarily prompted preparations along the East Coast of the United States. However, the storm curved northward and then east-northeastward while remaining offshore. Felix briefly threatened Bermuda again, but turned back to the northeast and weakened to a tropical storm on August 20. It accelerated east-northeastward and passed a short distance offshore of Newfoundland, where it transitioned into an extratropical storm on August 22. The remnants of Felix continued northeastward across the Atlantic until dissipating near Shetland on August 25.[36]
Large waves in Puerto Rico caused minor coastal flooding in Cataño.[37] On Bermuda, the storm produced near-hurricane-force winds,[36] which downed trees and power lines, and left 20,000 people without power. Rough surf was also reported on Bermuda, which damaged a few boats and hotels.[38] In addition, the passage of Felix postponed Bermuda's 1995 independence referendum. In the United States, Felix generated large waves from northeast Florida to Maine.[36] In New York, two houses were washed away in The Hamptons, while 20 to 30 houses in North Carolina experienced minor damage from rough seas.[37] While passing southeast of Newfoundland, Felix produced moderate rainfall and large waves across the island, although damage was minimal.[39] Overall, Felix caused eight deaths due to drowning along the coasts of North Carolina and New Jersey, and $132,000 in damage.[36]
Tropical Storm Gabrielle[]
| Tropical storm (SSHWS) | |
  | |
| Duration | August 9 – August 12 |
|---|---|
| Peak intensity | 70 mph (110 km/h) (1-min) 988 mbar (hPa) |
A tropical wave emerged into the Atlantic from the west coast of Africa in late July 1995 and entered the Gulf of Mexico on August 8. On the following day, the system developed a weak low-level circulation and was declared Tropical Depression Eight while in the western Gulf of Mexico. The depression quickly intensified into Tropical Storm Gabrielle on August 10. Gabrielle continued to rapidly strengthen as it tracked toward the coast of Mexico, nearly becoming a hurricane late on August 11. However, Gabrielle made landfall near La Pesca, Tamaulipas, Mexico two hours later, which prevented further strengthening. Gabrielle rapidly weakened inland and dissipated early on August 12.[40]
Gabrielle dropped heavy rainfall in Mexico, where some areas possibly experienced more than 24 in (610 mm) of precipitation. However, according to the Weather Prediction Center (WPC), rainfall peaked at 19.44 in (494 mm) in southern Tamaulipas.[40][41] Despite the large amounts of precipitation, it was considered beneficial due to drought conditions in some areas, especially in Tamaulipas and Nuevo Leon.[40] However, in other nearby areas, the heavy rainfall flooded streets and destroyed roadways and bridges.[41] Further north, Gabrielle dropped light to moderate rainfall in Texas.[42] Gabrielle caused six fatalities in Mexico, while the damage figure is unknown.[40]
Hurricane Humberto[]
| Category 2 hurricane (SSHWS) | |
  | |
| Duration | August 22 – September 1 |
|---|---|
| Peak intensity | 110 mph (175 km/h) (1-min) 968 mbar (hPa) |
On August 19, a tropical wave crossed over Dakar, Senegal, shortly before entering into the Atlantic Ocean. The wave quickly organized once in the Atlantic and developed into Tropical Depression Nine on August 22.[43] Due to low wind shear and warm sea surface temperatures, the depression strengthened into Tropical Storm Humberto six hours later.[44] It continued west-northwestward and then westward under the influence of a mid-level trough. Early on August 23, Humberto intensified into a hurricane.[43] By early on August 24 the storm developed a well-defined eye after becoming a Category 2 hurricane.[45]
After peaking with winds of 110 mph (175 km/h) on August 24, Humberto began a fujiwhara interaction with Hurricane Iris.[43] This generated shear on Humberto, causing the storm to weaken back to a Category 1 hurricane on August 26.[46] Humberto continued to weaken until August 28, when it was barely a hurricane.[43] Operationally, Humberto was erroneously downgraded to a tropical storm on that same day.[47] Thereafter, the storm began restrengthening and reached a secondary peak slightly below the threshold for a Category 2 hurricane on August 30.[43] While tracking northeastward, Humberto began weakening and acquiring extratropical characteristics starting on the following day.[48] Later on August 31, Humberto weakened to a tropical storm. By 06:00 UTC on September 1, the storm was absorbed by an extratropical low while west of the Azores.[43] Humberto was the second of four tropical waves in quick succession in the tropical Atlantic that all eventually became tropical storms or hurricanes; it was preceded by the wave that became Iris, and followed by the waves that became Karen and Luis. It was also the first of three tropical cyclones to form within a 24-hour period on August 21 and 22; Iris formed 12 hours later and Jerry formed 18 hours later. It was also the first of five named storms to form within a seven-day period; Karen formed on August 26 and Luis on August 28.[5]
Hurricane Iris[]
| Category 2 hurricane (SSHWS) | |
  | |
| Duration | August 22 – September 4 |
|---|---|
| Peak intensity | 110 mph (175 km/h) (1-min) 965 mbar (hPa) |
A tropical wave emerged into the Atlantic Ocean from the west coast of Africa on August 16. It rapidly developed a closed circulation, though convection diminished a few days after the wave entered the Atlantic. However, convection began to re-develop and by 12:00 UTC on August 22, the system developed into Tropical Depression Ten. Six hours later, the depression strengthened into Tropical Storm Iris. Thereafter, Iris continued to intensify and became a hurricane later on August 23. After reaching winds of 85 mph (140 km/h), the storm began to weaken during a Fujiwhara interaction with Hurricane Humberto, causing Iris to be downgraded to a tropical storm on August 24. Iris continued to steadily weaken as it approached the Lesser Antilles. After making a direct hit on Saint Lucia and Martinique on August 26, steering currents produced by a trough forced Iris north-northwestward; this caused it to brush Dominica and Guadeloupe and make landfall in Antigua and Barbuda on August 27. Around the time, Iris began restrengthening due to a decrease in wind shear and became a hurricane again on August 28.[49]
It is possible that the forward motion of the storm became slightly erratic after a Fujiwhara interaction began with Tropical Storm Karen. By September 1, Iris peaked as a 110 mph (175 km/h) Category 2 hurricane. After curving north-northeastward, Iris began to weaken after encountering increasing wind shear and decreasing sea surface temperatures. Nonetheless, it was still able to absorb Tropical Depression Karen on September 3. By early on the following day, Iris weakened to a tropical storm, six hours before becoming extratropical, while centered southeast of Newfoundland.[49] While crossing through the Leeward Islands, Iris produced heavy rainfall. High waves in Trinidad caused coastal flooding and damage to boats.[50] In Martinique, significant amounts of precipitation led to flooding and landslides. Four fatalities were reported on that island,[49] two of which occurred after mudslides push a house off a cliff. Flooding was also reported in coastal areas, resulting in heavy damage in Le Vauclin.[51] On Guadeloupe, the only island to record tropical storm force winds, one fatality occurred after a person drowned in a flooded river. Rainfall in Antigua damaged banana trees and caused flooding in low-lying areas.[49]
Tropical Storm Jerry[]
| Tropical storm (SSHWS) | |
  | |
| Duration | August 22 – August 28 |
|---|---|
| Peak intensity | 40 mph (65 km/h) (1-min) 1002 mbar (hPa) |
A tropical wave which emerged off of Africa began convective organization in the vicinity of the Bahamas. On August 23, the system was declared Tropical Depression Eleven while located between Florida and Andros Island. The depression strengthened as it headed north-northwestward, despite only marginally favorable conditions. On the following day, the depression was upgraded to Tropical Storm Jerry while located only 33 mi (53 km) offshore Florida. At 18:00 UTC on August 23, the storm made landfall later near Jupiter, Florida, as a minimal tropical storm with winds of 40 mph (65 km/h). Jerry slowly weakened and was downgraded to a tropical depression late on August 24. After drifting across Florida, the cyclone briefly emerged over the Gulf of Mexico, but then headed northward and back inland. Jerry meandered over Georgia and eventually dissipated on August 28.[52]
Jerry dropped heavy rainfall in Florida, especially in the southern portion of the state, where 16.8 in (430 mm) of precipitation fell in Golden Gate.[53] Although the storm struck the east coast of the state, much of the damage in Florida occurred in Collier County. In that county, 340 houses were damaged and 12 others were destroyed due to flooding. Other nearby counties also reported flood damage, albeit less severe. Agricultural damage was also reported in southwest Florida, primarily to citrus crops. The storm also spawned two tornadoes in West Central Florida, though neither caused any damage.[52] Heavy rainfall also occurred in Georgia, with some areas experiencing over 12 in (300 mm) of rain. The remnants of Jerry produced heavy precipitation in North and South Carolina, with 18.51 in (470 mm) observed in Antreville, South Carolina.[53] In both states, many roads were flooded and numerous buildings and houses were damaged, especially in the Charlotte and Raleigh areas of North Carolina. Overall, there were eight fatalities and $40 million in damage associated with Jerry.[37][52]
Tropical Storm Karen[]
| Tropical storm (SSHWS) | |
  | |
| Duration | August 26 – September 3 |
|---|---|
| Peak intensity | 50 mph (85 km/h) (1-min) 1000 mbar (hPa) |
On August 23, a tropical wave emerged into the Atlantic from the west coast of Africa. Shortly after entering the Atlantic, the tropical wave developed into a low-pressure area. Over the next few days, the cloud pattern associated with the system fluctuated in organization and a tropical depression may have developed as early as August 24. Two days later, satellite imagery indicated a well-defined low-level cloud center. As a result, it is estimated that Tropical Depression Twelve developed at 12:00 UTC on August 26. The depression slowly intensified as it tracked west-northwestward under the influence of low- to mid-level flow.[54] Although sea surface temperatures were warm, outflow from Hurricane Humberto may have slowed further strengthening of the depression.[55]
The depression finally began to develop bands north of the center on August 27,[56] though overall, the deep convection remained disorganized; the circulation of the depression also became elongated.[57] Around 06:00 UTC on August 28, the depression strengthened into Tropical Storm Karen. Early on the following day, Karen peaked with maximum sustained winds of 50 mph (85 km/h). By August 31, Karen north-northwestward around the circulation of Hurricane Iris and thus, a Fujiwhara interaction began.[54] As the storm was approaching Iris, the National Hurricane Center (NHC) began predicting on September 1 that Karen would merge with the former.[58] On the following day, Karen weakened to a tropical depression. Early on September 3, Karen lost its well-defined center and merged with Iris at 06:00 UTC, while centered near Bermuda.[54]
Hurricane Luis[]
| Category 4 hurricane (SSHWS) | |
  | |
| Duration | August 28 – September 11 |
|---|---|
| Peak intensity | 150 mph (240 km/h) (1-min) 935 mbar (hPa) |
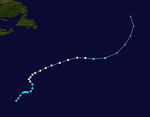
A westward-moving tropical wave developed into Tropical Depression Thirteen at 18:00 UTC on August 28. Initially, strong vertical shear hindered the depression from strengthening significantly; by early on August 29, however, it acquired sufficient organization to be named Tropical Storm Luis. The storm continued to strengthen slowly until wind shear decreased on August 30, causing Luis to become a hurricane later that day. By September 1, Luis became a major hurricane after it reached Category 3 intensity. Later that day, Luis was further upgraded to a Category 4 hurricane. Early on September 3, maximum sustained winds reached 150 mph (240 km/h), though the lowest pressure in relation to Luis was not recorded until September 8. After weakening slightly, Luis passed near Antigua and made landfall in Barbuda early on September 5, before brushing Saint Barthélemy, Saint Martin, and Anguilla. After remaining a major hurricane for a week, Luis weakened to a Category 2 hurricane while northeast of the Bahamas on September 8;[59] the weakening was possibly as a result of the storm crossing over decreasing ocean temperature due to upwelling from Hurricane Felix.[60][61] On September 10, Luis rapidly accelerated northeastward and weakened to a Category 1 hurricane. Luis made landfall on the Avalon Peninsula of Newfoundland early on September 11.[59] While crossing the island, cold, dry air began impacting the storm, causing it to rapidly become extratropical and merge with a frontal zone shortly after reentering the Atlantic Ocean.[59][62]
Strong winds and high waves wreaked havoc on several islands in the Lesser Antilles. In Antigua and Barbuda, winds reaching 121 mph (195 km/h) damaged numerous houses on Barbuda and destroyed nearly 45% of residences on Antigua.[59] An estimated 1,700 people were forced to flee to shelters and about 3,200 others were left homeless. Within Antigua and Barbuda alone, three fatalities occurred, 165 people were injured, and damage totaled to $350 million.[63] Strong winds in Guadeloupe caused moderate damage to homes and trees, especially in the Grande-Terre region. At Basse-Terre, nearly 100% of the banana crop was destroyed. Heavy rainfall in this portion of the island caused significant damage to roads. High waves also caused significant coastal flooding on the west coast of the island.[64] About $50 million in damage was reported and one fatality occurred.[59][65] The most significant effects occurred in the Netherlands Antilles, especially on Saint Martin – including both the French and Dutch side of the island. Approximately 60% of buildings were damaged to some degree.[59] Additionally, severe disruption to utility services was reported, including water, electricity, and telephone service.[66] Nine deaths and $1.8 billion in damage was reported on the island.[59]
In Dominica, storm surge left 1,000 people homeless and $47 million in property losses.[67] Winds exceeding 100 mph (160 km/h) caused severe impact in eastern Puerto Rico, especially Culebra. The area was left without electricity and 350 houses were extensively damaged or destroyed. On the main island, effects were primarily limited to downed trees and power lines on highways and electrical outages at about 200,000 houses. Throughout Puerto Rico, damaged reached $200 million and there were two deaths. Similarly strong winds lashed the United States Virgin Islands. Saint Thomas suffered the worst, where 75%–80% of houses were severely damaged or destroyed. The island's hospital was flooded. Damage in the United States Virgin Islands was estimated at $300 million.[68] Lesser effects occurred in the British Virgin Islands. Several homes were deroofed, especially on Anegada and Virgin Gorda. There were a number of telephone and electrical outages after a number of poles were toppled.[69] In the United States, storm surge and high tides were reported along the East Coast, leading to two drowning deaths—one in North Carolina and the other in New York. In the former state, eight homes were swept into the ocean and damage reached $1.9 million.[70] The storm also brought minor flooding to Newfoundland, with one death and $500,000 in damage.[71] In addition, Luis was the earliest twelfth-named storm on record at the time. However, this record has since been broken by Hurricane Laura in 2020.[72]
Tropical Depression Fourteen[]
| Tropical depression (SSHWS) | |
  | |
| Duration | September 9 – September 13 |
|---|---|
| Peak intensity | 35 mph (55 km/h) (1-min) 1008 mbar (hPa) |
A tropical wave exited the coast of Africa on September 4 and tracked westward across the Atlantic. The system gradually organized and became a tropical depression on September 9.[73] However, the NHC did not operationally declare the system as Tropical Depression Fourteen until September 11, while the system was centered 950 mi (1,530 km) southeast of Bermuda.[74] Although the National Hurricane Center predicted that it would intensify into a tropical storm, it was also noted shortly after advisories were initiated that "this might have been the only opportunity to name this depression."[75] The depression moved toward the northwest and encountered strong upper-level winds which removed the convection from the low-level center on September 13, causing the storm to dissipate.[73]
Hurricane Marilyn[]
| Category 3 hurricane (SSHWS) | |
  | |
| Duration | September 12 – September 22 |
|---|---|
| Peak intensity | 115 mph (185 km/h) (1-min) 949 mbar (hPa) |
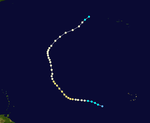
A tropical wave exited the west coast of Africa and entered into the Atlantic Ocean between September 7 and September 8. Although it had a large circulation, deep convection was minimal. After tracking steadily westward over the next few days, the system began developing convection. By 18:00 UTC on September 12, the system became Tropical Depression Fifteen, while centered about 585 mi (940 km) east-southeast of Barbados. The depression strengthened and became Tropical Storm Marilyn six hours later. Early on September 14, Marilyn further intensified to a hurricane. Later that day, Marilyn made landfall near Jenny Point, Dominica, with winds of 80 mph (130 km/h) at 21:00 UTC. Shortly thereafter, Marilyn entered the Caribbean Sea. While approaching the Virgin Islands and Puerto Rico, the storm became a Category 2 hurricane. After avoiding landfall, Marilyn re-entered into the Atlantic Ocean on September 16. The storm continued to intensify and early on September 17, it peaked as a minimal Category 3 hurricane. While curving northward, Marilyn fluctuated in intensity until beginning a weakening trend on September 20. The storm turned east-northeastward, and by the following day, it weakened to a tropical storm. By 06:00 UTC on September 22, Marilyn became extratropical while about 315 mi (505 km) southeast of Sable Island. The remnants of Marilyn lasted until merging with a cold front on October 1.[76]
Throughout the Lesser Antilles, the storm produced high winds and heavy rainfall.[76] After Hurricane Luis destroyed 90% of Dominica's banana crop, Marilyn ruined the remaining 10%. In addition, a roof was torn off an emergency shelter.[77] On Martinique, moderate rainfall and tropical storm force winds were recorded, though no damage or fatalities occurred. Effects in Guadeloupe were similar, but more intense. In Saint-Claude, 20 in (510 mm) of rain fell, which was the highest precipitation total associated with Marilyn. Wind speeds measured on Guadeloupe were also tropical storm force, with sustained winds of 59 mph (95 km/h) in Marie-Galante. Similar but lesser winds and rain occurred in Saint Barthélemy and Sint Maarten. However, the United States possessions, were, by far, suffered the most damage. Strong winds damaged or destroyed at least 80% of buildings on St. Thomas, which left 10,000 people homeless.[76] Storm surge in the Charlotte Amalie harbor beached the USCGC Point Ledge and damaged many smaller boats.[78] Moderate to severe damage was also reported on St. Croix and St. John,[76] where 20–30% of houses were damaged.[79] On Culebra, an offshore island of Puerto Rico, wind gusts as high as 125 mph (201 km/h) were reported.[76] As a result, light planes were overturned and 250 homes were either damaged or destroyed. Large waves also caused street flooding on the island. Flash floods on the main island of Puerto Rico sent rivers above their banks.[79] Moderate winds and rainfall on Antigua caused extensive damage to banana crops. While the storm bypassed Bermuda, tropical storm force winds were reported but no damage occurred.[76] Overall, Marilyn caused at least 13 fatalities and $2.1 billion in damage.[65][76][80]
Hurricane Noel[]
| Category 1 hurricane (SSHWS) | |
  | |
| Duration | September 26 – October 7 |
|---|---|
| Peak intensity | 75 mph (120 km/h) (1-min) 987 mbar (hPa) |
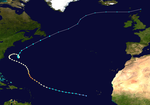
A tropical wave exited Africa on September 22 and within three days began to develop organized convection. After a low-level circulation formed, the system developed into Tropical Depression Sixteen late on September 26.[81] Despite the presence of wind shear, the depression strengthened into Tropical Storm Noel on September 27.[82] Moving northwestward, it gradually intensified to hurricane status by September 28, with peak winds of 75 mph (120 km/h). After remaining a hurricane for 42 hours, during which it turned to the northeast, Noel weakened to tropical storm strength due to increased wind shear.[81][83]
Although forecast to weaken to a tropical depression,[84] Noel maintained minimal tropical storm intensity as it curved to the northwest. Following a decrease in shear, Noel regained hurricane status on October 5 about 950 mi (1,530 km) west-southwest of the Azores. It turned to the east,[81] and the return of unfavorable conditions caused it to weaken to a tropical storm by October 6.[85] A day later, Noel weakened below tropical storm strength as it transitioned to an extratropical cyclone. The remnants lasted until late on October 7 until they were absorbed by a cold front.[81]
Hurricane Opal[]
| Category 4 hurricane (SSHWS) | |
  | |
| Duration | September 27 – October 5 |
|---|---|
| Peak intensity | 150 mph (240 km/h) (1-min) 916 mbar (hPa) |
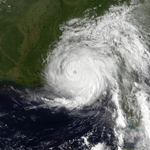
On September 11, a tropical wave emerged into the Atlantic from the west coast of Africa. The wave remained disorganized until nearing the Yucatán Peninsula, where it became a tropical depression on September 27 while 80 mi (130 km) south-southeast of Cozumel. The depression slowly moved over the Yucatán Peninsula for a few days, eventually emerging off the north coast, where it was upgraded to Tropical Storm Opal on September 30. After becoming a hurricane on October 2, the cyclone rapidly intensified and began moving north across the Gulf of Mexico. At 10:00 UTC on October 4, Opal peaked as a Category 4 hurricane with maximum sustained winds of 150 mph (240 km/h) and a minimum barometric pressure of 916 mbar (27.0 inHg). Shortly thereafter, the storm began weakening. Upon making landfall in Pensacola Beach, Florida, around 22:00 UTC on October 4, winds had decreased to 115 mph (185 km/h), which is Category 3 intensity. Opal weakened rapidly after moving inland, deteriorating to a tropical storm early on October 5 and then to a tropical depression about six hours later. At 18:00 UTC on October 5, Opal became extratropical over Kentucky. The extratropical storm dissipated over Ontario on October 6.[86]
The precursor and initial stages of Opal brought heavy rainfall and flooding to Guatemala and Mexico. In the former, rivers near the border with Mexico overflowed, resulting in the evacuation of 110 families in Tecún Umán. Approximately 34,000 people were left homeless. Landslides left damage to infrastructure and agriculture, with about $17 million in crop damage alone. Thirty-one deaths occurred in Guatemala.[87] In Mexico, more than 42,000 people were forced to evacuate as rivers overtopped their banks in Campeche and Tabasco,[88] while an estimated 100,000 people evacuated due to the storm.[89] Around 500,000 acres of crops had been destroyed by the floods.[88] Agricultural losses in Campeche alone were estimated in the hundreds of millions of dollars.[90] Nineteen fatalities were reported in Mexico.[86] In Florida, strong winds and storm surge left severe damage in the panhandle. From Wakulla County westward, many structures including homes and buildings were swept away or suffered some degree of damage. In Escambia, Okaloosa, and Santa Rosa counties, nearly 300 homes were destroyed and 1,000 others suffered major damage. The storm left at least $2.1 billion in damage in Florida.[91]
In Alabama, storm surge ranging from 4 to 7 ft (1.2 to 2.1 m) left significant damage in coastal counties. Inland, tropical storm force winds gusts were observed as far north as Huntsville. Numerous trees and power lines were downed in several counties, leaving 2.6 million people across the state without electricity at the height of the storm. Downed trees also damaged some dwellings, primarily mobile homes. Several short-lived tornadoes destroyed over 125 homes, while 150 others suffered major damage. It was estimated that the storm caused over $182 million in damage in Alabama.[91] Strong wind gusts were reported in northern Georgia, with a gust of 69 mph (111 km/h) at Marietta.[92] There were more than 1,200 telephone poles knocked down and almost 5,000 power lines snapped. Wind damage in Rabun County alone reached about $5 million, while the pecan crop suffered around $50 million in damage. Several other states reported lesser wind damage and flooding.[91] Throughout the United States, Opal caused approximately $4.7 billion in damage and 27 fatalities, including 14 in Georgia, 6 in Alabama, 5 in Florida, and 2 in North Carolina.[92][93]
Tropical Storm Pablo[]
| Tropical storm (SSHWS) | |
  | |
| Duration | October 4 – October 8 |
|---|---|
| Peak intensity | 60 mph (95 km/h) (1-min) 994 mbar (hPa) |
A tropical wave crossed the west coast of Africa and entered into the Atlantic Ocean on October 3. It quickly acquired a low-level circulation and by the following day, it developed into Tropical Depression Eighteen. Under the influence of deep easterlies, the storm tracked west-northwest and westward across the southern portions of the Atlantic Ocean.[94] At 12:00 UTC on October 5, the depression strengthened into Tropical Storm Pablo.[94] After becoming a tropical storm, Pablo developed well-defined outflow and the possibility of it strengthening into a hurricane seemed likely.[95]
Although strong upper-level westerlies were ahead of the storm, it was still predicted that Pablo would reach hurricane status.[96] By 12:00 UTC on October 6, Pablo peaked as a 60 mph (95 km/h) tropical storm.[94] However, shortly thereafter, strong vertical shear then diminished much of the deep convection associated with the storm.[97] Early on October 7, Pablo managed to re-develop some deep convection, though it did not restrengthen.[98] Later that day, the low level circulation became indiscernible on infrared imagery.[99] By 12:00 UTC on October 8, Pablo weakened to a tropical depression. Six hours later, Pablo dissipated while approaching the Windward Islands.[94]
Hurricane Roxanne[]
| Category 3 hurricane (SSHWS) | |
  | |
| Duration | October 7 – October 21 |
|---|---|
| Peak intensity | 115 mph (185 km/h) (1-min) 956 mbar (hPa) |
A tropical wave merged with a broad low pressure area and an upper trough near Honduras. The system quickly organized into Tropical Depression Nineteen on October 7. The depression brushed Central America before curving northward, where it strengthened into Tropical Storm Roxanne on October 9. Roxanne posed a threat to Cuba and the Cayman Islands, which briefly prompted the issuance of a tropical storm warning and a hurricane watch. However, a high pressure system forced Roxanne to tracked generally westward, which prevented it from significantly affecting the aforementioned islands. After becoming a hurricane on October 10, Roxanne began to rapidly strengthen. Later that day, the storm peaked as a minimal Category 3 hurricane, with winds of 115 mph (185 km/h).[100]
By 02:00 UTC on October 11, Roxanne made landfall just north of Tulum, Quintana Roo, on the Yucatán Peninsula with winds of 115 mph (185 km/h). The storm significantly weakened inland and emerged into the Bay of Campeche as a tropical storm. Several shortwave troughs and ridges caused Roxanne to track aimlessly through the southern Gulf of Mexico. By October 14, it re-strengthened into a hurricane. After making a close approach to the Yucatán Peninsula while heading southeastward, Roxanne weakened to a tropical storm on October 17 as it doubled back to the northwest. A cold front forced Roxanne westward on October 19, and it simultaneously weakened to a tropical depression. The cyclone curved abruptly southward and dissipated just offshore of Veracruz on October 21.[100]
In the Gulf of Mexico, a petroleum work barge with 245 people on board capsized, causing five people to drown. Due to its erratic movement, Roxanne dropped heavy rainfall in many areas of southern Mexico, and some areas reported over 25 in (640 mm) of precipitation.[101] Extensive flooding occurred as a result, which destroyed crops, washed out roads, and damaged at least 40,000 homes. In addition, significant coastal flooding also occurred, as storm surge for nearly a week caused water to travel inland for hundreds of yards. High winds also occurred over the Yucatán Peninsula, with one station reporting hurricane-force winds on October 11. Unconfirmed reports also indicated that many hotel lobbies in Cancun and Cozumel were damaged from pounding waves. Overall, Roxanne caused $1.5 billion in damage and 29 fatalities. However, not all damage could be distinguished from Hurricane Opal.[100][80]
Tropical Storm Sebastien[]
| Tropical storm (SSHWS) | |
  | |
| Duration | October 20 – October 25 |
|---|---|
| Peak intensity | 65 mph (100 km/h) (1-min) 1001 mbar (hPa) |
A tropical wave exited the west coast of Africa on October 13 and moved across the Atlantic. On October 20, it was declared a depression after shower activity increased. Twelve hours after forming, the depression became Tropical Storm Sebastien.[102] It organized and developed good outflow.[103] Although wind shear was expected to limit intensification,[104] the storm instead intensified and peaked with maximum sustained winds of 65 mph (100 km/h) late on October 22, based on a ship report.[102] At the time, most of the convection was sheared away from the center, and the storm was interacting with a low pressure area near Puerto Rico. The storm initially moved northwestward, before turning to the southwest along the low-level flow and into an area of increasing shear. On October 24, Sebastien weakened into a tropical depression, and it maintained this intensity until landfall on Anguilla. The next day, the system dissipated near the United States Virgin Islands, although the remnants continued westward.[102]
As it turned towards the Caribbean, the NHC issued a tropical storm watch for the United States Virgin Islands and the British Virgin Islands.[102] Other islands were on alert as the NHC stated that the watch area may need to be expanded.[105] Still recovering from Hurricane Marilyn less than a month prior, residents living in damaged homes reportedly evacuated their homes.[106] However, the watch was discontinued 24 hours later after the storm weakened to a tropical depression.[102] The remnants of Sebastien produced moderate rainfall across parts of Puerto Rico, peaking at 3.53 in (90 mm) in Quebradillas.[53]
Hurricane Tanya[]
| Category 1 hurricane (SSHWS) | |
  | |
| Duration | October 27 – November 1 |
|---|---|
| Peak intensity | 85 mph (140 km/h) (1-min) 972 mbar (hPa) |
Early on October 27, a tropical wave developed into a tropical depression. The system strengthened into Tropical Storm Tanya later that day. Tanya initially tracked northeastward due to a shortwave trough, though an upper-level cyclone soon turned the storm toward eastward. Early on October 29, Tanya was upgraded to a hurricane. On the following day, a cold front to the west forced the cyclone to accelerate northeastward.[107] Despite slightly cooler water,[108] Tanya strengthened a bit more that afternoon, reaching its peak intensity with maximum sustained winds of 85 mph (135 km/h) and a minimum barometric pressure of 972 mbar (28.7 inHg).[107] That intensity was maintained until late on October 31, when the storm weakened as it traveled over cooler waters.[109] Early on November 1, Tanya began to lose tropical characteristics while heading rapidly northeast towards the Azores. The system was downgraded to a tropical storm on November 1. That evening, Tanya became extratropical near the central Azores. The remnants turned northward and were absorbed by another extratropical cyclone early on November 3.[107]
In the Azores, Tanya tore roofs off houses and downed trees, and light posts flew through houses and buildings. One death by drowning was reported, as well as several injuries. The islands of Faial, Pico, São Jorge, and Terceira were hardest hit, where the storm sank numerous boats and knocked down trees and power lines, which severely disrupted electricity and telecommunications. Additionally, several houses were damaged and moderate crop losses were reported.[110]
Storm names[]
The following names were used for named storms that formed in the north Atlantic in 1995.[111] The names not retired from this list were used again in the 2001 season.[112] This is the same list used for the 1989 season except Humberto,[111] which replaced Hugo.[113] Storms were named Humberto, Luis, Marilyn, Noel, Opal, Pablo, Roxanne, Sebastien, and Tanya for the first time in 1995 (and only, in the cases of Luis, Marilyn, Opal and Roxanne). This was the first time since the modern name cycle began in 1979 that names starting with the letters O through T were used. Names that were not assigned are marked in gray.
Retirement[]
The World Meteorological Organization retired four names in the spring of 1996: Luis, Marilyn, Opal & Roxanne.[114] They were replaced in the 2001 season by Lorenzo, Michelle, Olga, and Rebekah.[112] With four names retired, the 1995 season is tied with the 1955, 2004 and 2017 seasons for the second most storm names retired after a single season in the Atlantic basin, only being surpassed by the 2005 season, where five names were retired.[114] Rebekah was not used in 2001, and would not be used until the 2019 season.
Season effects[]
This is a table of all of the storms that formed in the 1995 Atlantic hurricane season. It includes their duration, names, landfall(s) – denoted by bold location names – damages, and death totals. Deaths in parentheses are additional and indirect (an example of an indirect death would be a traffic accident), but are still related to that storm. Damage and deaths include totals while the storm was extratropical or a wave or low, and all of the damage figures are in 1995 USD.
| Saffir–Simpson scale | ||||||
| TD | TS | C1 | C2 | C3 | C4 | C5 |
| Storm name |
Dates active | Storm category
at peak intensity |
Max 1-min wind mph (km/h) |
Min. press. (mbar) |
Areas affected | Damage (USD) |
Deaths | Ref(s)
| ||
|---|---|---|---|---|---|---|---|---|---|---|
| Allison | June 3 – 6 | Category 1 hurricane | 75 (120) | 987 | Cuba, Southeastern United States, East Coast of the United States | $1.7 million | 1 | |||
| Barry | July 5 – 10 | Tropical storm | 70 (110) | 989 | Atlantic Canada | None | None | |||
| Chantal | July 12 – 22 | Tropical storm | 70 (110) | 991 | Atlantic Canada | None | None | |||
| Dean | July 28 – August 2 | Tropical storm | 45 (75) | 999 | Gulf Coast of the United States, Great Plains, Midwestern United States | $500,000 | None | |||
| Erin | July 31 – August 6 | Category 2 hurricane | 100 (165) | 973 | Southeastern United States, Midwestern United States, Mid-Atlantic states, New England | $700 million | 6 (7) | |||
| Six | August 5 – 7 | Tropical depression | 35 (55) | 1002 | Mexico | None | None | |||
| Felix | August 8 – 22 | Category 4 hurricane | 140 (220) | 929 | Puerto Rico, Bermuda, East Coast of the United States, Atlantic Canada | $3.63 million | 9 | |||
| Gabrielle | August 9 – 12 | Tropical storm | 70 (110) | 988 | Mexico | Unknown | 6 | |||
| Humberto | August 21 – September 1 | Category 2 hurricane | 110 (175) | 968 | None | None | None | |||
| Iris | August 22 – September 4 | Category 2 hurricane | 110 (175) | 965 | Lesser Antilles | Unknown | 5 | |||
| Jerry | August 22 – 28 | Tropical storm | 40 (65) | 1002 | Southeastern United States | $40 million | 6 (2) | |||
| Karen | August 26 – September 3 | Tropical storm | 50 (85) | 1000 | None | None | None | |||
| Luis | August 28 – September 11 | Category 4 hurricane | 150 (240) | 935 | Leeward Islands, Puerto Rico, Bermuda, East Coast of the United States, Atlantic Canada | $3.3 billion | 19 | |||
| Fourteen | September 9 – 13 | Tropical depression | 35 (55) | 1008 | None | None | None | |||
| Marilyn | September 12 – 22 | Category 3 hurricane | 115 (185) | 949 | Lesser Antilles, Virgin Islands, Bermuda | $2.1 billion | 13 | |||
| Noel | September 26 – October 7 | Category 1 hurricane | 75 (120) | 987 | None | None | None | |||
| Opal | September 27 – October 5 | Category 4 hurricane | 150 (240) | 916 | Guatemala, Mexico, Gulf Coast of the United States, Midwestern United States, Mid-Atlantic states, New England, Canada | $4.7 billion | 67 (10) | |||
| Pablo | October 4 – 8 | Tropical storm | 60 (95) | 994 | None | None | None | |||
| Roxanne | October 7 – 21 | Category 3 hurricane | 115 (185) | 956 | Mexico | $1.5 billion | 29 | |||
| Sebastien | October 20 – 25 | Tropical storm | 65 (100) | 1001 | Lesser Antilles, Puerto Rico | None | None | |||
| Tanya | October 26 – November 1 | Category 1 hurricane | 85 (140) | 972 | Azores | Unknown | 1 | |||
| Season aggregates | ||||||||||
| 21 systems | June 2 – November 1 | 150 (240) | 916 | $12.32 billion | 162 (20) | |||||
See also[]
- Atlantic hurricane season
- 1995 North Indian Ocean cyclone season
- 1995 Pacific typhoon season
- 1994–95 Australian region cyclone season
- 1995–96 Australian region cyclone season
- 1994–95 South Pacific cyclone season
- 1995–96 South Pacific cyclone season
- 1994–95 South-West Indian Ocean cyclone season
- 1995–96 South-West Indian Ocean cyclone season
- Lists of Atlantic hurricanes
- Mediterranean tropical-like cyclone
Notes[]
- ^ An average season, as defined by the National Oceanic and Atmospheric Administration, has twelve tropical storms, six hurricanes and two major hurricanes.[1]
- ^ A major hurricane is a storm that ranks as Category 3 or higher on the Saffir–Simpson Hurricane Scale.[2]
- ^ All damage figures are in 1995 USD, unless otherwise noted
- ^ There is an undercount bias of zero to six tropical cyclones per year between 1851 and 1885 and zero to four per year between 1886 and 1910, due to the lack of modern observation techniques, see Tropical cyclone observation. This may have led to significantly lower ACE ratings for hurricane seasons prior to 1910.[9][10]
References[]
- ^ "Background Information: The North Atlantic Hurricane Season". National Oceanic and Atmospheric Administration. August 4, 2011. Archived from the original on 2010-08-26. Retrieved December 5, 2011.
- ^ "What is a super-typhoon? What is a major hurricane? What is an intense hurricane?". Atlantic Oceanographic and Meteorological Laboratory. Retrieved December 5, 2011.
- ^ a b c d Forecast Verifications (Report). Fort Collins, Colorado: Colorado State University. 2012. Archived from the original on December 14, 2013. Retrieved August 3, 2013.
- ^ a b Jill F. Hasling (May 1, 2008). Comparison of Weather Research Center's OCSI Atlantic Annual Seasonal Hurricane Forecasts with Colorado State Professor Bill Gray's Seasonal Forecast (PDF) (Report). Weather Research Center. Archived from the original (PDF) on July 18, 2011. Retrieved September 27, 2016.
- ^ a b c d e f g h "Atlantic hurricane best track (HURDAT version 2)" (Database). United States National Hurricane Center. May 25, 2020.
- ^ Background information: the North Atlantic Hurricane Season. Climate Prediction Center (Report). National Oceanic and Atmospheric Administration. August 4, 2011. Retrieved September 17, 2011.
- ^ a b Philip J. Klotzbach; William M. Gray (December 8, 2006). Extended Range Forecast of Atlantic Seasonal Hurricane Activity and U.S. Landfall Strike Probability for 2007 (Report). Fort Collins, Colorado: Colorado State University. Archived from the original on March 4, 2016. Retrieved July 1, 2012.
- ^ William M. Gray (November 30, 1994). Extended Range Forecast of Atlantic Seasonal Hurricane Activity for 1995 (PDF) (Report). Fort Collins, Colorado: Colorado State University. p. 2. Retrieved September 27, 2016.
- ^ Christopher W. Landsea, Hurricane Research Division (2010-05-08). "Subject: E11) How many tropical cyclones have there been each year in the Atlantic basin? What years were the greatest and fewest seen?". National Oceanic and Atmospheric Administration. Retrieved 2011-01-03.
- ^ Christoper W. Landsea, Hurricane Research Division (2014-03-26). "HURDAT Re-analysis Original vs. Revised HURDAT". NOAA. Retrieved 2014-03-27.
- ^ a b Kirk Saville (November 30, 1995). "Hurricane Season Comes To Merciful End". Sun-Sentinel. Retrieved September 27, 2016.
- ^ a b c Atlantic basin Comparison of Original and Revised HURDAT. Hurricane Research Division; Atlantic Oceanographic and Meteorological Laboratory (Report). Miami, Florida: National Oceanic and Atmospheric Administration. Retrieved August 12, 2016.
- ^ Masters, Jeff (October 24, 2012). "Hurricane Sandy pounding Jamaica, may hit US this weekend; TS Tony forms". Weather Underground. TWC Product and Technology. Retrieved September 25, 2021.
- ^ "Subtropical Storm Teresa Becomes the 19th Named Storm of the Season". The New York Times. September 25, 2021. Retrieved September 25, 2021.
- ^ Richard J. Pasch (January 29, 1996). Preliminary Report: Hurricane Allison (PDF). National Hurricane Center (Report). Miami, Florida: National Oceanic and Atmospheric Administration. Retrieved March 10, 2016.
- Gene Hafele (August 4, 1995). Summary of Tropical Storm Dean. National Weather Service Houston, Texas (Report). National Oceanic and Atmospheric Administration. p. 2. Retrieved August 12, 2016.
- August 1995 Storm Data. National Weather Service Norman, Oklahoma (Report). National Oceanic and Atmospheric Administration. August 1995. Archived from the original on 8 October 2006. Retrieved November 29, 2008.
- Edward N. Rappaport (November 26, 1995). Preliminary Report: Hurricane Erin (PDF). National Hurricane Center (Report). Miami, Florida: National Oceanic and Atmospheric Administration. Retrieved August 12, 2016.
- Mark Guishard; James Dodgson; Michael Johnston (May 2015). Hurricanes - General Information for Bermuda (DOC) (Report). Bermuda Weather Service. Retrieved October 7, 2015.
- B. Max Mayfield; Jack L. Beven (November 19, 1995). Preliminary Report: Hurricane Felix (PDF). National Hurricane Center (Report). Miami, Florida: National Oceanic and Atmospheric Administration. Retrieved March 10, 2016.
- Steve Stone (August 18, 1995). "Life Returns to Normal as Hurricane Felix Glides Away from Land" (GIF). The Virginia Pilot. Retrieved September 27, 2016.
- "Storm Data and Unusual Weather Phenomena" (PDF). Storm Data. Asheville, North Carolina: National Climatic Data Center. 37 (8): 12, 17, 59, 64, 65, 90, 91, 92. August 1995. ISSN 0039-1972. Archived from the original (PDF) on March 10, 2016. Retrieved March 10, 2016.
- Miles B. Lawrence (December 1, 1995). Preliminary Report: Tropical Storm Gabrielle (PDF). National Hurricane Center (Report). Miami, Florida: National Oceanic and Atmospheric Administration. Retrieved August 12, 2016.
- Edward N. Rappaport (November 2, 2000). Preliminary Report: Hurricane Iris (PDF). National Hurricane Center (Report). Miami, Florida: National Oceanic and Atmospheric Administration. Retrieved August 12, 2016.
- Richard J. Pasch (January 31, 1996). Preliminary Report: Tropical Storm Jerry (PDF). National Hurricane Center (Report). Miami, Florida: National Oceanic and Atmospheric Administration. Retrieved August 29, 2016.
- "International Disaster Database". Centre for Research on the Epidemiology of Disasters. 2016. Retrieved September 25, 2016.
- 1995-Luis (Report). Environment Canada. September 14, 2010. Archived from the original on March 13, 2013. Retrieved May 19, 2021.
- Edward N. Edward (January 17, 1996). Preliminary Report: Hurricane Marilyn (PDF). National Hurricane Center (Report). Miami, Florida: National Oceanic and Atmospheric Administration. Retrieved August 29, 2016.
- Neal Lott; Tom Ross (2007). Billion Dollar U.S. Weather Disasters (PDF). National Climatic Data Center (Report). Asheville, North Carolina. Archived from the original (PDF) on November 22, 2006. Retrieved September 27, 2016.
- Hurricane Opal Preliminary Report (PDF) (NOAA Technical Memorandum 95-02). National Climatic Data Center. November 1995. pp. 4, 9. Retrieved September 26, 2016.
- Eric S. Blake; Christopher W. Landsea; Ethan J. Gibney (August 10, 2011). The deadliest, costliest and most intense United States tropical cyclones from 1851 to 2010 (and other frequently requested hurricane facts) (PDF). National Hurricane Center (NOAA Technical Memorandum NWS NHC-6). National Oceanic and Atmospheric Administration. Retrieved September 16, 2016.
- Lixion A. Avila (November 29, 1995). Preliminary Report: Hurricane Roxanne (PDF). National Hurricane Center (Report). Miami, Florida: National Oceanic and Atmospheric Administration. Retrieved September 16, 2016.
- "Resolution on Hurricane Tanya". European Parliament. European Union. 1995. Archived from the original on June 23, 2008. Retrieved September 16, 2016.
- ^ Phillip J. Klotzbach; William M. Gray (April 10, 2014). "Extended Range Forecast of Atlantic Seasonal Hurricane Activity and Landfall Strike Probability for 2014" (PDF). Colorado State University. Colorado State University. Archived from the original (PDF) on January 9, 2017. Retrieved April 10, 2014.
- ^ a b c Richard J. Pasch (January 29, 1996). Preliminary Report: Hurricane Allison (PDF). National Hurricane Center (Report). Miami, Florida: National Oceanic and Atmospheric Administration. Retrieved March 10, 2016.
- ^ "Storm Data and Unusual Weather Phenomena" (PDF). Storm Data. Asheville, North Carolina: National Climatic Data Center. 37 (6): 42. June 1995. ISSN 0039-1972. Archived from the original (PDF) on March 10, 2016. Retrieved March 10, 2016.
- ^ 1995-Allison (Report). Environment Canada. September 14, 2010. Archived from the original on March 13, 2013. Retrieved May 19, 2021.
- ^ a b c d e f B. Max Mayfield (November 19, 1995). Preliminary Report: Tropical Storm Barry (PDF). National Hurricane Center (Report). Miami, Florida: National Oceanic and Atmospheric Administration. Retrieved March 10, 2016.
- ^ B. Max Mayfield (July 6, 1995). Tropical Depression Two Discussion Number 2. National Hurricane Center (Report). Miami, Florida: National Oceanic and Atmospheric Administration. Retrieved March 10, 2016.
- ^ Lixion A. Avila (July 8, 1995). Tropical Storm Barry Discussion Number 9. National Hurricane Center (Report). Miami, Florida: National Oceanic and Atmospheric Administration. Retrieved March 10, 2016.
- ^ B. Max Mayfield (July 9, 1995). Tropical Storm Barry Discussion Number 13. National Hurricane Center (Report). Miami, Florida: National Oceanic and Atmospheric Administration. Retrieved March 10, 2016.
- ^ 1995-Barry (Report). Environment Canada. September 14, 2010. Archived from the original on March 13, 2013. Retrieved May 19, 2021.
- ^ a b Miles B. Lawrence (November 17, 1995). Preliminary Report: Tropical Storm Chantal (PDF). National Hurricane Center (Report). Miami, Florida: National Oceanic and Atmospheric Administration. Retrieved March 10, 2016.
- ^ 1995-Chantal (Report). Environment Canada. September 14, 2010. Archived from the original on May 19, 2021. Retrieved May 19, 2021.
- ^ a b Lixion A. Avila (November 14, 1995). Preliminary Report: Tropical Storm Dean (PDF). National Hurricane Center (Report). Miami, Florida: National Oceanic and Atmospheric Administration. Retrieved August 12, 2016.
- ^ a b c d Gene Hafele (August 4, 1995). Summary of Tropical Storm Dean. National Weather Service Houston, Texas (Report). National Oceanic and Atmospheric Administration. p. 2. Retrieved August 12, 2016.
- ^ a b David M. Roth (January 18, 2007). Tropical Storm Dean – July 28-August 4, 1995. Weather Prediction Center (Report). College Park, Maryland: National Oceanic and Atmospheric Administration. Retrieved August 12, 2016.
- ^ a b August 1995 Storm Data. National Weather Service Norman, Oklahoma (Report). National Oceanic and Atmospheric Administration. August 1995. Archived from the original on 8 October 2006. Retrieved November 29, 2008.
- ^ a b c Edward N. Rappaport (November 26, 1995). Preliminary Report: Hurricane Erin (PDF). National Hurricane Center (Report). Miami, Florida: National Oceanic and Atmospheric Administration. Retrieved August 12, 2016.
- ^ Gary Beeler (1995). Preliminary Storm Report for Hurricane Erin. National Weather Service Mobile, Alabama (Report). Mobile, Alabama. Retrieved August 12, 2016.
- ^ David M. Roth (August 30, 2007). Hurricane Erin – August 1-7, 1995. Weather Prediction Center (Report). College Park, Maryland: National Oceanic and Atmospheric Administration. Retrieved August 12, 2016.
- ^ a b Richard J. Pasch (January 10, 1996). Brief Information about Tropical Depression Six (PDF). National Hurricane Center (Report). Miami, Florida: National Oceanic and Atmospheric Administration. Retrieved March 10, 2016.
- ^ David M. Roth (October 8, 2008). Tropical Depression Six - August 3-7, 1995. Weather Prediction Center (Report). College Park, Maryland: National Oceanic and Atmospheric Administration. Retrieved March 10, 2016.
- ^ a b c d e B. Max Mayfield; Jack L. Beven (November 19, 1995). Preliminary Report: Hurricane Felix (PDF). National Hurricane Center (Report). Miami, Florida: National Oceanic and Atmospheric Administration. Retrieved March 10, 2016.
- ^ a b c "Storm Data and Unusual Weather Phenomena" (PDF). Storm Data. Asheville, North Carolina: National Climatic Data Center. 37 (8): 12, 17, 59, 64, 65, 90, 91, 92. August 1995. ISSN 0039-1972. Archived from the original (PDF) on March 10, 2016. Retrieved March 10, 2016.
- ^ Paul Egan (August 16, 1995). "Felix Stationary: 250 Miles Northwest of Bermuda". Associated Press. Retrieved March 10, 2016.
- ^ 1995-Felix (Report). Environment Canada. September 14, 2010. Archived from the original on March 13, 2013. Retrieved May 19, 2021.
- ^ a b c d Miles B. Lawrence (December 1, 1995). Preliminary Report: Tropical Storm Gabrielle (PDF). National Hurricane Center (Report). Miami, Florida: National Oceanic and Atmospheric Administration. Retrieved August 12, 2016.
- ^ a b "Mexicans clean up after Tropical Storm Gabrielle". The Dallas Morning News. Monterrey, Nuevo León. August 14, 1995. Retrieved August 12, 2016.
- ^ David M. Roth (January 27, 2007). Tropical Storm Gabrielle – August 9-August 14, 1995. Weather Prediction Center (Report). College Park, Maryland: National Oceanic and Atmospheric Administration. Retrieved August 12, 2016.
- ^ a b c d e f Lixion A. Avila (November 15, 1995). Preliminary Report: Hurricane Humberto (PDF). National Hurricane Center (Report). Miami, Florida: National Oceanic and Atmospheric Administration. Retrieved August 12, 2016.
- ^ Richard J. Pasch; B. Max Mayfield (August 22, 1995). Tropical Storm Humberto Discussion Number 3. National Hurricane Center (Report). Miami, Florida: National Oceanic and Atmospheric Administration. Retrieved August 12, 2016.
- ^ Edward N. Rappaport (August 24, 1995). Hurricane Humberto Discussion Number 10. National Hurricane Center (Report). Miami, Florida: National Oceanic and Atmospheric Administration. Retrieved August 12, 2016.
- ^ Edward N. Rappaport (August 25, 1995). Hurricane Humberto Discussion Number 15. National Hurricane Center (Report). Miami, Florida: National Oceanic and Atmospheric Administration. Retrieved August 12, 2016.
- ^ B. Max Mayfield (August 28, 1995). Hurricane Humberto Discussion Number 25. National Hurricane Center (Report). Miami, Florida: National Oceanic and Atmospheric Administration. Retrieved August 29, 2016.
- ^ Steve Lyons (August 31, 1995). Hurricane Humberto Discussion Number 38. National Hurricane Center (Report). Miami, Florida: National Oceanic and Atmospheric Administration. Retrieved August 29, 2016.
- ^ a b c d Edward N. Rappaport (November 2, 2000). Preliminary Report: Hurricane Iris (PDF). National Hurricane Center (Report). Miami, Florida: National Oceanic and Atmospheric Administration. Retrieved August 12, 2016.
- ^ C. B. Daniel; R. Maharaj (May 2001). Tropical Cyclones Affecting Trinidad and Tobago, 1725 to 2000 (Report). Trinidad and Tobago Meteorological Service. p. 14. Archived from the original on June 26, 2015. Retrieved May 5, 2012.
- ^ Javier Maymi (August 28, 1995). "Tropical Storm Iris is cause of at least three deaths in Caribbean". The Bryan Times. San Juan, Puerto Rico. Associated Press.
- ^ a b c Richard J. Pasch (January 31, 1996). Preliminary Report: Tropical Storm Jerry (PDF). National Hurricane Center (Report). Miami, Florida: National Oceanic and Atmospheric Administration. Retrieved August 29, 2016.
- ^ a b c Roth, David M. (October 18, 2017). "Tropical Cyclone Point Maxima". Tropical Cyclone Rainfall Data. United States Weather Prediction Center. Retrieved November 26, 2017.
- ^ a b c B. Max Mayfield (November 19, 1995). Preliminary Report: Tropical Storm Karen (PDF). National Hurricane Center (Report). Miami, Florida: National Oceanic and Atmospheric Administration. Retrieved August 29, 2016.
- ^ B. Max Mayfield (August 27, 1995). Tropical Depression Twelve Discussion Number 4. National Hurricane Center (Report). Miami, Florida: National Oceanic and Atmospheric Administration. Retrieved August 29, 2016.
- ^ Steve Lyons (August 27, 1995). Tropical Depression Twelve Discussion Number 5. National Hurricane Center (Report). Miami, Florida: National Oceanic and Atmospheric Administration. Retrieved August 29, 2016.
- ^ Steve Lyons (August 27, 1995). Tropical Depression Twelve Discussion Number 6. National Hurricane Center (Report). Miami, Florida: National Oceanic and Atmospheric Administration. Retrieved August 29, 2016.
- ^ Miles B. Lawrence (September 1, 1995). Tropical Storm Karen Discussion Number 5. National Hurricane Center (Report). Miami, Florida: National Oceanic and Atmospheric Administration. Retrieved August 29, 2016.
- ^ a b c d e f g Miles B. Lawrence (January 8, 1996). Preliminary Report: Hurricane Luis (PDF). National Hurricane Center (Report). Miami, Florida: National Oceanic and Atmospheric Administration. Retrieved August 29, 2016.
- ^ Edward N. Rappaport (September 8, 1995). Hurricane Luis Discussion Number 46. National Hurricane Center (Report). Miami, Florida: National Oceanic and Atmospheric Administration. Retrieved August 29, 2016.
- ^ Lixion A. Avila (September 9, 1995). Hurricane Luis Discussion Number 48. National Hurricane Center (Report). Miami, Florida: National Oceanic and Atmospheric Administration. Retrieved August 29, 2016.
- ^ Richard J. Pasch (September 11, 1995). Hurricane Luis Discussion Number 56. National Hurricane Center (Report). Miami, Florida: National Oceanic and Atmospheric Administration. Retrieved August 29, 2016.
- ^ Caribbean - Hurricane Luis Sep 1995 UN DHA Situation Reports 1-10. United Nations Office for the Coordination of Humanitarian Affairs (Report). ReliefWeb. September 7, 1995. Archived from the original on September 27, 2007. Retrieved September 25, 2016.
- ^ Conséquences du passage des cyclones Iris, Luis et Marylin aux Antilles françaises (Guadeloupe et Martinique) (PDF) (Report) (in French). Marseille, France. December 1995. Retrieved September 25, 2016.
- ^ a b "International Disaster Database". Centre for Research on the Epidemiology of Disasters. 2016. Retrieved September 25, 2016.
- ^ E.A. Torriero (September 7, 1995). "Luis Kills 13, Skirts Past Puerto Rico, Likely To Turn North". Orlando Sentinel. Fajardo, Puerto Rico. Retrieved September 25, 2016.
- ^ Dominica - Hurricane Situation Report No.4. United Nations Office for the Coordination of Humanitarian Affairs (Report). ReliefWeb. October 12, 1995. Retrieved September 25, 2016.
- ^ Mireya Navarro (September 17, 1995). "Damage Heavy as Hurricane Ravages Island of St. Thomas". The New York Times. Miami, Florida. Retrieved September 25, 2016.
- ^ Summary of Impact of Hurricane "Luis" on CDERA Participating States (PDF) (Report). Port of Spain, Trinidad and Tobago. October 6, 1995. Archived from the original (PDF) on September 27, 2016. Retrieved September 25, 2016.
- ^ "Storm Data and Unusual Weather Phenomena" (PDF). Storm Data. Asheville, North Carolina: National Climatic Data Center. 37 (9): 34 and 35. September 1995. ISSN 0039-1972. Archived from the original (PDF) on September 25, 2016. Retrieved September 25, 2016.
- ^ 1995-Luis (Report). Environment Canada. September 14, 2010. Archived from the original on March 13, 2013. Retrieved May 19, 2021.
- ^ Laura Jazmin Tolliver-Jackson (August 21, 2020). "Tropical Storm Laura is already breaking records". Naples Daily News. Retrieved May 19, 2021.
- ^ a b Lixion A. Avila (January 8, 1996). Preliminary Report: Tropical Depression Fourteen (PDF). National Hurricane Center (Report). Miami, Florida: National Oceanic and Atmospheric Administration. Retrieved August 29, 2016.
- ^ Jerry D. Jarrell (September 11, 1995). Tropical Depression Discussion Number 1. National Hurricane Center (Report). Miami, Florida: National Oceanic and Atmospheric Administration. Retrieved August 29, 2016.
- ^ Jerry D. Jarrell (September 11, 1995). Tropical Depression Discussion Number 2. National Hurricane Center (Report). Miami, Florida: National Oceanic and Atmospheric Administration. Retrieved August 29, 2016.
- ^ a b c d e f g Edward N. Edward (January 17, 1996). Preliminary Report: Hurricane Marilyn (PDF). National Hurricane Center (Report). Miami, Florida: National Oceanic and Atmospheric Administration. Retrieved August 29, 2016.
- ^ Arnold Markowitz (September 16, 1995). "Hurricane Marilyn pounds U.S. islands". The Miami Herald. Retrieved May 4, 2012.
- ^ "September - Daily Chronology of Coast Guard History". United States Coast Guard. December 21, 2016. Retrieved May 19, 2021.
- ^ a b Preliminary Storm Report - Hurricane Marilyn. National Weather Service San Juan, Puerto Rico (Report). San Juan, Puerto Rico: National Hurricane Center. October 31, 1995. p. 3. Retrieved May 4, 2012.
- ^ a b Costliest U.S. tropical cyclones tables updated (PDF) (Report). Miami, Florida: National Hurricane Center. January 26, 2018. Retrieved February 4, 2018.
- ^ a b c d Richard J. Pasch (February 1, 1996). Preliminary Report: Hurricane Noel (PDF). National Hurricane Center (Report). Miami, Florida: National Oceanic and Atmospheric Administration. Retrieved August 29, 2016.
- ^ Lixion A. Avila (September 27, 1995). Tropical Storm Noel Discussion Number 3. National Hurricane Center (Report). Miami, Florida: National Oceanic and Atmospheric Administration. Retrieved August 29, 2016.
- ^ Miles B. Lawrence (September 29, 1995). Hurricane Noel Discussion Number 10. National Hurricane Center (Report). Miami, Florida: National Oceanic and Atmospheric Administration. Retrieved August 29, 2016.
- ^ Edward N. Rapport (September 30, 1995). Hurricane Noel Discussion Number 17. National Hurricane Center (Report). Miami, Florida: National Oceanic and Atmospheric Administration. Retrieved August 29, 2016.
- ^ Miles B. Lawrence (October 6, 1995). Tropical Storm Noel Discussion Number 38. National Hurricane Center (Report). Miami, Florida: National Oceanic and Atmospheric Administration. Retrieved September 16, 2016.
- ^ a b B. Max Mayfield (September 9, 2014). Preliminary Report: Hurricane Opal (PDF). National Hurricane Center (Report). Miami, Florida: National Oceanic and Atmospheric Administration. Retrieved September 16, 2016.
- ^ "31 muertos por mal tiempo en Guatemala". EFE. Guatemala City, Guatemala. 1995. Retrieved September 16, 2016.
- ^ a b Sara Silver (October 1, 1995). "Opal Floods Yucatan Peninsula". Mexico City, Mexico: Associated Press. (Accessed through LexisNexis)
- ^ Joseph B. Frazier (October 3, 1995). "At Least Seven Dead as Hurricane Heads North Toward U.S". Veracruz, Mexico: Associated Press. (Accessed through LexisNexis)
- ^ "Yucatan peninsula cut off by floods". Campeche, Mexico: United Press International. October 3, 1995. (Accessed through LexisNexis)
- ^ a b c "Storm Data and Unusual Weather Phenomena" (PDF). Storm Data. Asheville, North Carolina: National Climatic Data Center. 37 (10): 12, 14, 24–26, 31–33, 36, 38, 40–42, 45–46, 49–51, 53–55, 57, 59–60, 64–65, 67–68. October 1995. ISSN 0039-1972. Archived from the original (PDF) on September 26, 2016. Retrieved September 26, 2016.
- ^ a b Hurricane Opal Preliminary Report (PDF) (NOAA Technical Memorandum 95-02). National Climatic Data Center. November 1995. pp. 4, 9. Retrieved September 26, 2016.
- ^ Eric S. Blake; Christopher W. Landsea; Ethan J. Gibney (August 10, 2011). The deadliest, costliest and most intense United States tropical cyclones from 1851 to 2010 (and other frequently requested hurricane facts) (PDF). National Hurricane Center (NOAA Technical Memorandum NWS NHC-6). National Oceanic and Atmospheric Administration. Retrieved September 16, 2016.
- ^ a b c d Miles B. Lawrence (December 4, 1995). Preliminary Report: Tropical Storm Pablo (PDF). National Hurricane Center (Report). Miami, Florida: National Oceanic and Atmospheric Administration. Retrieved September 16, 2016.
- ^ Richard J. Pasch (October 5, 1995). Tropical Storm Pablo Discussion Number 4. National Hurricane Center (Report). Miami, Florida: National Oceanic and Atmospheric Administration. Retrieved September 16, 2016.
- ^ Miles B. Lawrence (October 6, 1995). Tropical Storm Pablo Discussion Number 6. National Hurricane Center (Report). Miami, Florida: National Oceanic and Atmospheric Administration. Retrieved September 16, 2016.
- ^ Edward N. Rappaport (October 6, 1995). Tropical Storm Pablo Discussion Number 7. National Hurricane Center (Report). Miami, Florida: National Oceanic and Atmospheric Administration. Retrieved September 16, 2016.
- ^ Lixion A. Avila (October 7, 1995). Tropical Storm Pablo Discussion Number 9. National Hurricane Center (Report). Miami, Florida: National Oceanic and Atmospheric Administration. Retrieved September 16, 2016.
- ^ Miles B. Lawrence (October 7, 1995). Tropical Storm Pablo Discussion Number 10. National Hurricane Center (Report). Miami, Florida: National Oceanic and Atmospheric Administration. Retrieved September 16, 2016.
- ^ a b c Lixion A. Avila (November 29, 1995). Preliminary Report: Hurricane Roxanne (PDF). National Hurricane Center (Report). Miami, Florida: National Oceanic and Atmospheric Administration. Retrieved September 16, 2016.
- ^ David M. Roth (January 27, 2007). Hurricane Roxanne - October 9-21, 1995. Weather Prediction Center (Report). Camp Springs, Maryland: National Oceanic and Atmospheric Administration. Retrieved September 16, 2016.
- ^ a b c d e Edward N. Rapport (December 4, 1995). Preliminary Report: Tropical Storm Sebastien (PDF). National Hurricane Center (Report). Miami, Florida: National Oceanic and Atmospheric Administration. Retrieved September 16, 2016.
- ^ Lixion A. Avila (October 20, 1995). Tropical Storm Sebastien Discussion Number 2. National Hurricane Center (Report). Miami, Florida: National Oceanic and Atmospheric Administration. Retrieved September 16, 2016.
- ^ Lixion A. Avila (October 22, 1995). Tropical Storm Sebastien Discussion Number 8. National Hurricane Center (Report). Miami, Florida: National Oceanic and Atmospheric Administration. Retrieved September 16, 2016.
- ^ "Tropical Storm Sebastien Swirls Towards Caribbean". Daily News. Miami, Florida. Reuters. October 19, 1995. p. 21. Retrieved September 16, 2016.
- ^ "Another storm takes aim at islands". The Register-Guard. Charlotte Amalie, United States Virgin Islands. October 24, 1995. p. 2. Retrieved September 16, 2016.
- ^ a b c Richard J. Pasch (February 1, 1996). Preliminary Report: Hurricane Tanya (PDF). National Hurricane Center (Report). Miami, Florida: National Oceanic and Atmospheric Administration. Retrieved September 16, 2016.
- ^ Edward N. Rappaport (October 30, 1995). Hurricane Tanya Discussion Number 14. National Hurricane Center (Report). Miami, Florida: National Oceanic and Atmospheric Administration. Retrieved September 16, 2016.
- ^ Richard J. Pasch (November 1, 1995). Hurricane Tanya Discussion Number 19. National Hurricane Center (Report). Miami, Florida: National Oceanic and Atmospheric Administration. Retrieved September 16, 2016.
- ^ Resolution on Hurricane Tanya. European Parliament (Report). European Union. 1995. Archived from the original on June 23, 2008. Retrieved September 16, 2016.
- ^ a b "Beware! Hurricane season nears". The Spokesman-Review. Associated Press. May 29, 1995. Retrieved October 4, 2011.
- ^ a b "Atlantic Storms 1996–2001". Atlantic Oceanographic and Meteorological Laboratory. National Oceanic and Atmospheric Administration. 1996. Archived from the original on March 4, 2016. Retrieved October 4, 2011.
- ^ "4 hurricane for the Atlantic predicted in 1989". Star-News. Bal Harbour, Florida. Associated Press. June 1, 1989. Retrieved September 27, 2016.
- ^ a b Tropical Cyclone Naming History and Retired Names. National Hurricane Center (Report). Miami, Florida: National Oceanic and Atmospheric Administration. 2016. Retrieved September 27, 2016.
Further reading[]
- Landsea, Christopher W.; Bell, Gerald D.; Gray, William M.; Goldenberg, Stanley B.; et al. (1998). "The Extremely Active 1995 Atlantic Hurricane Season: Environmental Conditions and Verification of Seasonal Forecasts". Monthly Weather Review. 126 (5): 1174–1193. Bibcode:1998MWRv..126.1174L. doi:10.1175/1520-0493(1998)126<1174:TEAAHS>2.0.CO;2.
External links[]
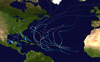
![[79]](#cite_note-pshsju03.gif-83)
- 1995 Atlantic hurricane season